http://dx.doi.org/10.1590/s2175-97902018000117165
Article
*Correspondence: L. A. Barbosa. Universidade Federal de São João Del Rei, Campus Centro-Oeste Dona Lindu. Av Sebastião Gonçalves Coelho, 400, CEP 35501-296 Divinopolis, MG, Brasil. Email: [email protected]. Phone: 55-37-3221-1610
Effects of high fat diet on kidney lipid content and the
Na,K-ATPase activity
Israel José Pereira Garcia
1,
Jessica Silva Cézar
1, Bruno Silva Lemos
2, Lilian Nayra Silva
2, Rosy Iara
Maciel de Azambuja Ribeiro
3, Camilla Camerino Santana
4, Luciano Aparecido Meireles Grillo
4,
Flavia Carmo Horta Pinto
5,
Samyra Lopes Buzelle
6, Vanessa Faria Cortes
1, Hérica de Lima Santos
1,
Maria Emilia Soares Martins dos Santos
2,7, Leandro Augusto Barbosa
1*1Laboratório de Bioquímica Celular, Faculdade de Bioquímica, Universidade Federal de São João Del Rei, Campus Centro-Oeste Dona Lindu, Divinópolis, Minas Gerais, Brasil, 2Laboratório de Bioquímica Metabólica, Faculdade de Bioquímica, Universidade Federal de São Joao Del Rei, Campus Centro-Oeste Dona Lindu, Divinópolis, Minas Gerais, Brasil, 3Laboratorio de Patologia Experimental, Universidade Federal de São João Del Rei, Campus Centro-Oeste Dona Lindu, Divinópolis, Minas Gerais, Brasil, 4Universidade Federal de Alagoas, Escola de Enfermagem e Farmácia, Campus A C Simões, Maceió, Alagoas, Brasil, 5Departamento de Ciências Naturais (DCNA), Universidade Federal de São João Del Rei, Campus Dom Bosco, São João Del Rei, Minas Gerais, Brasil, 6Departamento de Bioquímica, Faculdade de Medicina de Ribeirão Preto, Universidade de São Paulo, Ribeirão Preto, São Paulo, Brasil, 7Departamento de Bioquímica, Farmacologia e
Fisiologia/ICBN, Universidade Federal do Triângulo Mineiro, Uberaba, MG, Brasil
It is widely known that high fat diet (HFD) can contribute to the advent of health problems. Recent studies have indicated that obesity imposes a hemodynamic overload to the kidneys. In order to further investigate such injuries, two groups of six Swiss mice each were fed with a controlled AIN93G diet
or a high fat (AIN93G modified) diet for eight weeks. Blood samples were collected to determine the hormonal, lipid profile, glucose, urea, and creatinine levels. Histopathological and immunohistochemical
analysis were carried out to analysis the kidney damage. Fractions of renal membranes were prepared to assess the Na,K-ATPase activity, lipid peroxidation, total cholesterol, and phospholipid content. The
results indicated that the blood lipid profile, urea and creatinine was not altered by the HFD. On the other
hand, it was observed in HFD diet mice elevated glucose blood levels along with an augment on insulin and a decrease on corticosterone release. HFD provoked a reduction in the diameter of the convoluted tubules and cell volume in Bowman’s capsule and an increased number of positive cells with Na,K-ATPase, but reduced the Na,K-ATPase activity and the cholesterol content in the kidney cell membrane but favored the lipid peroxidation.
Keywords: High fat diet/Effects. Na,K-ATPase. Lipid peroxidation. Kidney. Cell membrane.
INTRODUCTION
The profound scientific, technological and socioeconomic changes observed throughout the history of the societies promoted a striking impact on their demographic, nutritional and epidemiological
profiles. Modifications on the dietary patterns with the
introduction of hypercaloric and high fat diets (HFD)
contributed to elevate the incidence of overweight and obesity worldwide. As consequence, a transformation on
health-disease process could be observed specifically with
the augment of the prevalence of chronic diseases such as diabetes, hypertension, cardiovascular impairment, and cancer (Crescenzo et al., 2015; Frazier-Wood, 2015; McKeown, 2009).
development of kidney failure. In fact, a retrospective study revealed a prevalence of 70% of metabolic syndrome among 202 patients with kidney failure admitted to initiate the renal replacement therapy (Young et al., 2007).
A review involving 6,618 renal biopsies performed from 1986 to 2000, reported a ten-fold increase in the incidence of obesity-associated glomerulonephritis in 2000 when compared to those investigated in 1986 (Kambham et al., 2001). Obesity imposes a hemodynamic burden to the kidneys, which is characterized by glomerular
hyperfiltration and microalbuminuria. It was observed
that dogs with obesity induced by high fat diet presented
an elevation of 30% on the glomerular filtration rate five
weeks after the induction, along with an expansion of Bowman’s capsule and an augment of mesangial matrix after nine weeks (Henegar et al., 2001). In addition, it has been described that changes in lipoprotein metabolism and serum lipids occur with increasing renal dysfunction. A subgroup analysis of 1,329 CKD (Chronic kidney disease) patients followed over 5 years, showed a relative risk reduction of 28% with sinvastatin treatment. (Chauhan, Vaid, 2009; Choudhury, Tuncel, Levi, 2009; Szolkiewicz et al., 2002). Moreover, the high levels of cholesterol and obesity have been associated with changes of glomerular
structure during the final stages of renal disease (Sasatomi et al., 2001).
Na,K-ATPase exerts pivotal physiological functions in the kidneys, such as a primary role in the reabsorption of Na+ and water, which is essential for the maintenance
of body fluid and electrolyte homeostasis (Reinhard et al., 2013). Moreover, the lipid content on the plasma membrane of the cells can modulate the activity and functions modulates by the Na,K-ATPase (Cornelius, 2008; Yoneda et al., 2014). Since HFD is capable of impair the kidney functions and also cause modulations of lipid
content in the body, it is important to verify the effect of
HFD on the activity of the Na,K-ATPase, an important enzyme responsible for several kidney functions.
Furthermore, there is a few reports about the
influence of HFD on the kidney Na,K-ATPase activity.
High fat diets induces an interaction between Na,K-ATPase and CD36, a receptor that plays an important role in the metabolism of fatty acids and glucose (Kennedy et al., 2013). According to this particular study, the products generated in a hyperlipidemia state, activate CD36 and Na,K-ATPase, both being involved in the activation of Src kinases and the generation of free radicals. The authors suggested that CD36 and Na,K-ATPase acts synergically,
developing an inflammatory cycle in the renal proximal
tubule cells including the associated macrophages. In obese rats, leptin provoked urine output by only 29.1%
and natriuresis by 28.9%, and had no significant effect
on medullary Na,K-ATPase, but the obese rats had an increased of Na,K-ATPase activity compared to lean rats (about 40%) (Beltowski, Gorny, Marciniak, 2002).
Therefore, the objective of the present study was
to assess the effect of a high fat diet on the Na,K-ATPase
activity of Swiss male mice fed. Changes in body weight, adipose tissue depots, serum levels of metabolic markers, and renal function markers were investigated. Additionally, histopathological and immunohistochemical analysis were carried out to analysis the kidney damage and fractions of renal membranes were prepared to assess the Na,K-ATPase activity, lipid peroxidation, total cholesterol, and phospholipid.
MATERIAL AND METHODS
Sample
M a l e 4 - w e e k - o l d S w i s s m i c e , r e c e i v i n g a commercial diet were housed in number of six in cages in an environmentally controlled room (light from 6 am to 6 pm; mean temperature, 22 ± 1 °C) at the animal facility of the Midwest Campus of the São João del-Rei Federal University. After the acclimatizing period (3 days), the animals were randomly divided into 2 groups of 12 animals with free access of food and water. The control (CT) group was fed with a standard balanced diet (AIN93G) composed of 7% lipid, 63% carbohydrate and 20% protein, while the HFD group was fed with a fat diet (modified AIN93G) composed of 35% lipid, 35% carbohydrate and 20% protein (Table I) for 8 weeks. After this period, blood, retroperitoneal and edipidymal adipose tissue and kidneys were collected in order to perform the experiments. The animals were managed according to the Brazilian College of Animal Experimentation Rules and approved by the Animal Ethics Committee – Commission for the Ethical Use of Animals at the Federal University of São João del-Rei (CEUA-UFSJ) - under the Protocol Number 11/2012.
Preparation of kidney crude membrane homogenates
Extraction of lipid fractions from the crude membrane homogenates
Samples of 100 µL from the crude membrane h o m o g e n a t e s w e r e m i x e d w i t h 2 0 v o l u m e s o f chloroform:methanol (2:1 v/v) in Falcon tubes (15 mL). After 1 h at room temperature, the tubes were centrifuged at 2,100 rpm for 20 min. A volume of distilled water corresponding to 1/5 of total volume (∼ 400 µL) was
added to each tube which was settled for 1 h at room temperature before new centrifugation cycle as previous described. After 24 h, the organic phase (mainly containing phospholipids and cholesterol) was retrieved, dried on a rotary evaporator, dissolved in chloroform:methanol (2:1 v/v), and subsequently stored at -20 °C (Folch, Lees, Stanley, 1957).
Determination of total phospholipids from the crude membrane homogenates
The phospholipids were determined based on the amount of phosphate released by the acid hydrolysis (Chen, Toribara, Warner, 1956). Previously known amounts of Pi (5 to 80 nmol) and samples of commercial dioleoylphosphatidylcholine (DOPC) were used to assess the lipid hydrolysis and to prepare the standards.
Determination of total cholesterol from the crude membrane homogenates
To quantify the cholesterol, 1.5 mL of acetic acid and 1 mL of ferric chloride reagent (2.5% w/v FeCl3 in 85%
w/v H3PO4 diluted in concentrated H2SO4, 8% v/v) were
added to each sample. The absorbance of a purple/pink color developed after 20 min was read in a plate reader set at 550 nm. A standard curve was prepared simultaneously (Rackova, 2013).
Determination of Thiobarbituric Acid Reactive Substances (TBARS)
L i p o p e r o x i d a t i o n w a s d e t e r m i n e d b y t h e
quantification of TBARS levels. In a 100 μL aliquot of
mice membrane kidney crude membrane homogenate the
volume was filled to 200 μL with 50 mM sodium phosphate buffer (pH 7.4). A 200 μL of 12% trichloroacetic acid (TCA) was added and then 400 μL of 1% thiobarbituric
acid was added. The mixture was vortexed and taken to the water bath at 95 °C for 30 minutes. After this period, it was taken to the ice bath for 10 minutes. After this time, the absorbance was read in a spectrophotometer at 532 nm (Buege, Aust, 1978). The determinations were made
in triplicate, and the quantification of the lipoperoxidation
was calculated with respect to a standard curve. The standard curve was taken from a standard solution of malondialdehyde (MDA) by varying the amount of 0 to 300 nM.
Metabolism and biochemical measurements
The animals were sacrificed by decapitation between 8 and 10 o’clock in the morning. Blood samples were collected and the serum used for biochemical analyses. Serum free fatty acid (FFA) (NEFA Randox®),
triacylglycerol (TAG) (Labtest®), cholesterol (Doles®),
urea, creatinine and glucerol (Bioclin-Quibasa®), were all
determined enzymatically by commercial kits. The glucose was determined by using a glucometer (Accu-Chek Performa; Roche®). ELISA was used for determination of
serum concentrations of adiponectin (R&D System Inc.®),
leptin, and insulin (Millipore®). The corticosterone serum
concentrations were measured by radioimmunoassay.
Na,K-ATPase activity
The Na,K-ATPase activity was evaluated using 20
μg of the total membrane homogenates per ml of reaction
medium (pH 7.5) consisted of 50 mM HEPES, 3 mM ATP, 10 mM KCl, 5 mM MgCl2,and 50 mM NaCl. The
reaction was conducted at 37 ºC. The experiments were performed in the presence and the absence of 1 mM
ouabain, in order to specifically determine the activity of
Na,K-ATPase. The reaction started by the addition of the TABLE I - Composition of control diet and High fat diet
Ingredients Control Diet
(g/100 g)
High Fat Diet (g/100 g)
Casein 20.0 20.0
L-Cystine 0.3 0.3
Corn starch 39.8 11.8
Maltodextrin 13.2 13.2
Sucrose 10.0 10.0
Soybean oil 7.0 4.0
Lard - 31.0
Cellulose 5.0 5.0
Mineral mix 3.5 3.5
Vitamin mixture 1.0 1.0
Choline bitartrate 0.25 0.25
enzyme to the reaction medium and was interrupted by the addition of cold 30% TCA after 1 hour. The tubes were placed in an ice bath in order to reduce the ATP hydrolysis and centrifuged 2000 rpm for 10 minutes. The phosphate was then determined following the method described by Heinomen and Lahti (1981).
The Na,K-ATPase activity was calculated by the
difference between the two assays regarding the total of
ATPase (without or without ouabain). The enzyme activity was expressed as nmol/min/mg protein.
Histochemistry
The fragments of renal tissue were fixed in 10%
of buffered formaldehyde and dehydrated by increased
alcohol concentrations (70 to 100%). The fragments were cleaned three times in xylene baths before be
embedded in paraffin. Sections of 4 µm thick were fixed
on glass slides. For histochemical analysis the slides were rehydrated in with decreasing concentrations (100 to 70%) of alcohol and afterwards in tap water. The slides were then submitted to hematoxylin, and next, to eosine.
Images of the histologic fields were obtained by a Zeiss
Axiolab microscope connected to a camera interconnected
to a board computer scanner (Zeiss, Axiovision Rel. 4.6).
Morphometric analyzes (Sharma et al., 1995) were performed with the help of the Image J program (National Institute of Health, USA). For morphometric analysis of the Bowman space area, 10 glomeruli of each animal of each group were photographed, in an increase of 200X. The area of the glomerular capillary tuft and the Bowman capsule area were measured, the Bowman space area being obtained by subtracting the tuft area with the capsule area. The average of the 10 values of the measured area was considered as the average area for each one of the animals. For morphometric analysis of the inner diameter of the proximal tubules, 30 tubules of each animal of each group
were photographed and identified by the classic morphology
of their epithelial cells, in an increase of 200X. The mean of the 30 values of the internal diameter measured was considered as the mean diameter for each of the animals.
Immunohistochemistry
Immunohistochemistry was performed with 4-μm sections that were deparaffinized with xylene and then
rehydrated in decreasing concentrations of ethanol. Antigen retrieval was performed by incubating the
specimens in a sodium citrate buffer (1 M, pH 6.0 to 6.2)
using three 5-minutes cycles in a microwave with 1-minute interval between the cycles. The slides were washed
twice with 1 M PBS for 5 minutes. The blocking of the endogenous peroxidase was performed with 30% H2O2 in a dark humid chamber with three changes of 20 minutes each. The specimens were again rinsed twice with 1 M PBS for 5 minutes. The blocking was achieved with 2% bovine serum albumin (BSA). After the blocking, there was further wash with PBS (twice for 5 minutes each). The incubation was performed using the polyclonal primary antibody alpha1 Na,K-ATPase (Santa Cruz Biotechnology, C464.6: sc-21712, Santa Cruz, CA, USA) at a dilution of 1:100 for 12 hours in a dark humid chamber at 4 °C. After that, the secondary antibodies (HRP-System LBSA - DAKO) were incubated for 45 minutes under the same conditions. The excess of secondary antibodies was removed by washing with 1 M PBS. The specimens were incubated with the horse-radish peroxidase (HRP) enzyme for 45 minutes in a humid chamber followed again by two baths 1 M PBS for 5 minutes. The final products were revealed by the DAB substrate chromogen 3.3 (100 mg, Sigma, USA), 1.2 mL of 30% H2O2, and 120 mL of PBS at 37° C for 6 minutes. The specimens were then washed in water for 5 minutes, counterstained with hematoxylin for 40 seconds. Finally, the tissues were dehydrated. Negative and positive controls for every immunohistochemical staining process were used to ensure the quality of the staining. Two independent observers evaluated the extent
of the expression of each of the markers on a 40x field.
Statistical analysis
GraphPad Prism® 5 package was applied to compare
the means of the continuous variables using the unpaired
Student’s t test. 5.0% α was established for the significant
analysis.
RESULTS
Body weight and adipose tissue depots
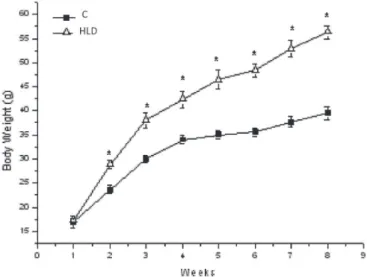
The HFD mice showed increased body weight when compared to control mice. This was observed from second week, until the end of the experimental period (Figure 1). After 8 weeks, the HFD mice also presented an augment of 169% in their adipose tissue depots (retroperitoneal (RET) and 107% of epididymal (EPD) tissues) when compared to control group (Table II).
Histopathological analysis of the kidneys
tubules at kidney sections observed by microscopic
analyses, (Figure 2A). In a different manner, for the HFD
group it was possible to observe areas with a swelling in the cells lined (Figure 2) with the convoluted proximal tubules leading to a reduction of their internal diameters and a decrease of cell volume in Bowman’s capsule, as shown in Figure 3.
Biochemical analysis of metabolism
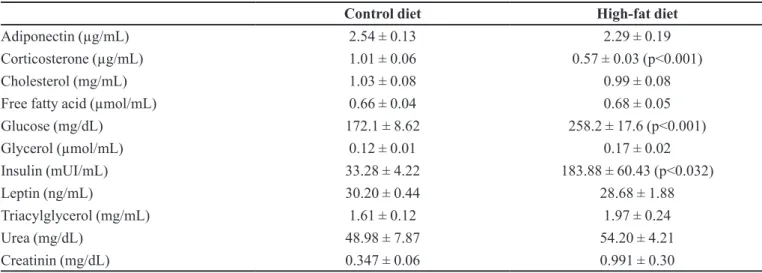
Blood levels of urea, creatinine, lipid profiles,
adiponectin, and leptin levels were not different between
both groups. However, it was observed an increase of glucose (p<0.001) and insulin (p<0.032), and a decrease of corticosterone levels (p<0.001) in HFD group compared to the control (Table III).
Na,K-ATPase activity
Na,K-ATPase activity of the HFD group showed a reduction of 25% and 37% for right and left kidney, respectively (Figure 4). Interestingly, it was noticed a higher Na,K-ATPase activity, of about 4 times greater, in the right kidney compared to the left kidney. However, it
is worth of note that the effect of HFD diet remains the
same in both the kidneys indicating a modulation of the renal function.
TABLE II - Adipose tissue depots (g) (retroperitoneal (RET) and epididimal (EPD) of mice fed with a control diet (C) or a high fat diet (HFD) for 8 weeks. Results are mean ± standard error (n= 6). *versus C (p<0,05)
Groups RET EPD
C 0.286±0.05 1.4±0.2
HL 0.770±0.06* 2.9±0.3*
FIGURE 1 - Body weight of mice fed a controle diet (C) or a high fat diet (HFD) for 8 weeks. Results are mean ± standard error (n= 6). * versus C (P<0.05).
FIGURE 3 - Morphometric renal analyzes. The Bowman space area (A) and the diameter of tubule lumen (B) was measured. *
represent p<0.05 of t test(n=6).
TABLE III - Biochemical serum/plasma analysis of mice fed control or high-fat diet
Control diet High-fat diet
Adiponectin (µg/mL) 2.54 ± 0.13 2.29 ± 0.19
Corticosterone (µg/mL) 1.01 ± 0.06 0.57 ± 0.03 (p<0.001)
Cholesterol (mg/mL) 1.03 ± 0.08 0.99 ± 0.08
Free fatty acid (µmol/mL) 0.66 ± 0.04 0.68 ± 0.05
Glucose (mg/dL) 172.1 ± 8.62 258.2 ± 17.6 (p<0.001)
Glycerol (µmol/mL) 0.12 ± 0.01 0.17 ± 0.02
Insulin (mUI/mL) 33.28 ± 4.22 183.88 ± 60.43 (p<0.032)
Leptin (ng/mL) 30.20 ± 0.44 28.68 ± 1.88
Triacylglycerol (mg/mL) 1.61 ± 0.12 1.97 ± 0.24
Urea (mg/dL) 48.98 ± 7.87 54.20 ± 4.21
The immunohistochemistry study revealed greater labeling profiles of Na,K-ATPase in the mice that had been treated with the HFD diet than those of control group (Figure 5). This data showed that a HFD diet could increase the number of Na,K-ATPase positive cells (Figure 5G), as well the total Na,K-ATPase stain intensity (Figure 5H) of in the renal tissues.
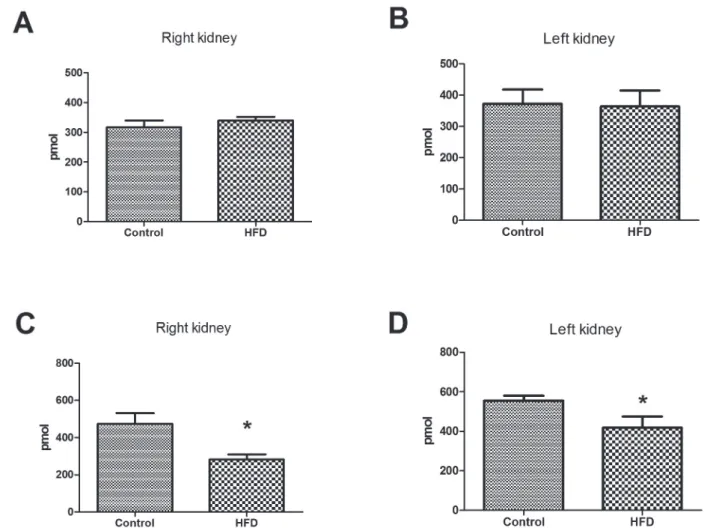
Cell membrane cholesterol and phospholipid content
The amount of phospholipids was not altered by HFD fed, but a lower total cholesterol content was observed in kidney membranes fraction, with a reduction
of 41% for the left kidney (p<0.05) and 25% for the right kidney (p<0.0127) (Figure 6).
Lipid peroxidation
The right kidneys of the mice treated with the HFD presented an augment of 45% (p<0.05) in cell membrane lipid peroxidation (Figure 7) when compared to the control group.
DISCUSSION
HFD fed mice have increased body weight of 52% after 8 weeks of diet and white adipose tissue depots about 169% in their adipose tissue depots (retroperitoneal). The use of a high fat diet in order to induce obesity in mice models is a very useful tool to understand the disruptions in the body’s metabolism. Overweight and obesity are important causes for several associated pathologies, including hypertension. The pathogenesis of obesity-associated hypertension is very complex, and it is not fully understood. However, as in other forms of hypertension, abnormal renal sodium handling and a disturbed regulation of the vascular tone, plays predominant roles (Seki et al., 2008).
Increased WAT depots are expected in high fat fed animals. In our study, HFD dietary intake for 8 weeks
did not cause changes in the plasma lipid profile of the
animals: concentrations of FFA, TAG and cholesterol were not different, which may indicate that peripheral tissues, mainly liver and white adipose tissue (WAT) are able to capture dietary FFA in an attempt to avoid
ectopic deposition. Fatty acid esterification into TAG in
WAT seems to protect organisms from FFA lipotoxicity to other organs, once derived FFA from WAT can impair peripheral tissues function, resulting insulin resistance and hepatic steatosis (Cao et al., 2008). Kwon et al. studied
the temporal effect of HFD in C57BL / 6J mice observed
results similar to ours, with no differences in plasma levels of TAG and FFA up to 24 weeks of diet (Kwon et al., 2012).
Despite the fact that mutations resulting in the absence of leptin or its receptor have been associated with severe obesity and diabetes, diet-induced obesity in animals and humans has been characterized by hyperleptinemia (Surwit et al., 1997). After 4 and 14 wk, plasma leptin concentrations are lower in rats fed the HFD. In the short term, a moderately HFD is associated with lower than expected circulating leptin concentrations, which correlate with a higher body weight. And authors argue that a HFD may therefore contribute to weight gain FIGURE 4 - Kidney Na,K-ATPase activity of mice fed with high
fat diet. Membrane preparations of left (A) and right (B) kidney were used to determine Na,K-ATPase activity. The experiments
by reducing leptin secretion in adipose tissue (Ainslie et al., 2000).
The immunohistochemistry analysis showed that amount of Na,K-ATPase positive cells were increased in the renal tubular region of the HFD group. In this context, Bickel et al. (2001) supported our results. They described
that obese Zucker rats significantly increased the
α1-subunit of Na,K-ATPase in the rat’s kidneys, probably because of the predominance of the proximal tubules in the cortex. However, we found high Na,K-ATPase amounts in the kidney tubules and the Na,K-ATPase activities were
significantly reduced in the HFD group but, the role of
how this inhibition occurs is not clear.
Curiously, we found a difference in Na,K-ATPase
activity between the right and left kidneys. There are papers demonstrated asymmetry of the kidneys, with a
substantial differences between left and right renal blood flow may be present in up to 51% of hypertensive patients
with angiographically proven patent renal arteries (van Onna et al., 2003). In an evaluation of a large group of hypertensive patients by renal scintigraphy, it was noticed that, without captopril challenge, the single kidney fractional uptake was statistically significantly lower on the left side than on the right side (46% versus 54%) (van Jaarsveld et al., 1997). Furthermore, some studies have already shown that there is a difference in levels and activity of Na,K-ATPase in right and left kidney
2012; Yingst et al., 2009). Nevertheless, it is important
to emphasize that the effect of HFD is the same for both
kidneys and that the Na,K-ATPase can have different modulated in kidneys.
The reduction of cholesterol in the cell membrane
increases its fluidity and makes the cell more sensitive to
lipid peroxidation (Van der Paal et al., 2016). Obesity is associated with an increased on the generation of reactive oxygen species from the mononuclear cells. Oxidative injuries to the kidney stimulates the angiotensin synthesis by inducing the PKC and p38MAPK signaling systems (Chalmers, Kaskel, Bamgbola, 2006). Although no changes of lipid peroxidation were observed in the left kidney, it was increased about 25% in the right kidney of HFD group. This process is an important factor to the modulation of Na,K-ATPase activities, probably because modification on the membrane microenvironment is associated to changes on protein conformation which may reduce the pump activity (Rodrigo et al., 2007; Rodrigo et al., 2014).
Recent studies have been shown that a HFD can cause a reduction of the Na,K-ATPase expression and this could also potentially impact the albumin uptake and the sodium
reabsorption (Briffa et al., 2015). It has been demonstrated that Na,K-ATPase is located also in caveolae (Cai et al., 2008). There are several reports showing influence of cholesterol and phospholipids of the cell membranes on the activity of Na,K-ATPase (Cornelius, 2008; Rodrigo et al., 2014). The possible modulation of the Na,K-ATPase
could be due to the modification of the lipid contents of
the kidney cell membranes. It is further known that the Na,K-ATPase can serve as a cell membrane cholesterol level sensor and can directly connect to this particular molecule. Thus, Na,K-ATPase may regulate the cholesterol synthesis and the distribution of the cellular signaling pathways (Chen et al., 2009). In addition, the HFD regulates cholesterol metabolism, and Na,K-ATPase signaling pathway is involved in this process possibly by regulating the expression of lipid metabolism-associated proteins HMG-CoA reductase and SREBP-2 (Wang et al., 2015). FIGURE 6 - Total lipid profile of kidney of mice fed with high fat diet. Total phospholipids (A, B) and cholesterol (C, D) were
Several studies have indicated that the lipid
microenvironment affects the Na,K-ATPase activities.
The Na,K-ATPase activities and structures are strongly modulated by a cholesterol presence in the membranes and changes in the amounts of that molecule can lead to increased or decreased activities (Cornelius, 2008; Cuevas, Jameson, Sotomayor, 2006). The addition of cholesterol to the membrane mimetic systems can also cause a destabilization of the phospholipid bilayer and these changes were recognized in the protein conformations (Yoneda et al., 2014). Another study investigating the effects of cholesterol on the Na,K-ATPase activities has shown that maximum enzyme
activities can be observed in the presence of an specific
amount of cholesterol in the membrane. When the levels of cholesterol are above or below to such amount, the pump activity decreases (Yeagle, Young, Rice, 1988).
All together, this explains the observation of a significant
reduction of cholesterol contents (Figure 6 C,D) and Na,K-ATPase (Figure 4).
Leptin resistance induced by a HFD seems to involve
different causes, mainly a defect in peripheral leptin ability
in activate hypothalamus areas, and impaired intracellular signaling in leptin-responsive hypothalamic neurons (El-Haschimi et al., 2000). Several studies have demonstrated that there is an increment of leptin levels in obese subjects (Fine, Fine, 1997; Savino et al., 2013) and other studies have demonstrated that leptin induces a time- and dose-dependent decrement in the Na,K-ATPase activities in the renal medulla (Beltowski, Marciniak, Wojcicka, 2004). In addition, leptin acts via activation of p38MAPK and PKC.
These two proteins can inhibit the Na,K-ATPase (El-Zein et al., 2015). Briffa et al. (2015) suggested that there was a direct relationship between the levels of leptin and the decreased expression levels of the kidney Na,K-ATPase, through a pathway involving the modulation of ERK1/2. In our model, the leptin levels remained unchanged. However, we did observe a remarkable increase in the insulin levels and insulin resistance. This is commonly associated with a decrement of the Na,K-ATPase activity (Galuska et al., 2009).
It has been described that insulin increases the sodium reabsorption in the proximal tubule (the thick ascending limb) and the distal tubule, including the collecting duct (Feraille et al., 1995; Ito et al., 1997). However, it has been shown that an insulin treatment
has caused an internalization of the α1 isoform of
Na,K-ATPase in LLC-PK1 cells. Those particular authors have suggested that the sodium pump and the insulin receptor compete for intracellular proteins (which are necessary for an endocytosis process) (Gupta et al., 2012). Therefore, a possible explanation for the decreased Na,K-ATPase activities may be due to the augment of circulating insulin, causing an internalization of the pump. This also may explain the decrease on the expression levels of the Na,K-ATPase enzyme observed in the kidneys during previous
studies (Briffa et al., 2015).
Our investigation showed an effect of a HFD on kidney function. We observed that a diet rich in lipids induced the weight gain, altered the renal cellular
morphology, without affect the blood levels of creatinine
and urea. An important enzyme for renal function, Na,K-ATPase, has been shown to decrease its activity and increase its expression in the mouse kidneys in response to HFD. Interestingly, the HFD reduced the cholesterol FIGURE 7 - Lipid peroxidation determination of kidney
content of the membrane within the kidney. Divergently from lipid peroxidation of the cell membrane. These changes in the membrane, and perhaps the internalization of Na,K-ATPase due to the elevated circulating levels of insulin, may have contributed to impair the Na,K-ATPase activity in mice treated with the high fat diet.
Therefore, our results suggest that a high fat diet may be a contributing factor to induce or accelerate the progression of renal disease which is a special concern pre-diabetes or diabetes population, or patients already diagnosed with renal injury.
ACKNOWLEDGMENT
This work was supported by FAPEMIG (Fundação de Amparo a Pesquisa do Estado de Minas Gerais) APQ-00290-16, CAPES (Coordenação de Aperfeiçoamento de Pessoal de Nível Superior) and CNPq (Conselho
Nacional de Desenvolvimento Científico e Tecnológico)
401914/2016-0.
CONFLICTS OF INTEREST
The authors declare that there is no conflict of interest.
LIST OF ABBREVIATIONS:
WHO – World Health Organization HFD – High fat diets
NAFLD – Non-alcoholic fatty liver disease
HEPES – 4-(2-Hydroxyethyl)-1-piperazineethanesulfonic acid
CD36 – Fatty acid translocase ATP – Adenosine triphosphate
PBS – Phosphate-buffered saline
BSA – Bovine serum albumin HRP – Horseradish peroxidase RET – Retroperitoneal EPD – Epididimal
CKD- Chronic kidney disease ROS – Reactive Oxygen Species
TBARS – Thiobarbituric acid reactive substances PKC – Protein kinase C
TNF-α – Tumor necrosis factor alpha
p38MAPK – P38 mitogen-activated protein kinases CD11c – Integrin alpha X chain protein
FFA – Serum free fatty acid WAT – White adipose tissue TAG – Triacylglycerol
REFERENCES
Ainslie DA, Proietto J, Fam BC, Thorburn AW. Short-term, high-fat diets lower circulating leptin concentrations in rats. Am J Clin Nutr. 2000;71(2):438-442.
Beltowski JGWj, Gorny D, Marciniak A. Human leptin administered intraperitoneally stimulates natriuresis and decreases renal medullary Na+, K+-ATPase activity in the rat - impaired effect in dietary-induced obesity. Med Sci Monit. 2002;8(6):21-229.
Beltowski J, Marciniak A, Wojcicka G. Leptin decreases r e n a l m e d u l l a r y N a + , K + - AT P a s e a c t i v i t y t h r o u g h phosphatidylinositol 3-kinase dependent mechanism. J Physiol Pharmacol. 2004;55(2):391-407.
Bickel CA, Verbalis JG, Knepper MA, Ecelbarger CA. Increased renal Na-K-ATPase, NCC, and beta-ENaC abundance in obese Zucker rats. Am J Physiol Renal Physiol. 2001;281(4):F639-648.
Briffa J F, Grinfeld E, Jenkin KA, Mathai ML, Poronnik P, McAinch AJ, et al. Diet induced obesity in rats reduces NHE3 and Na(+) /K(+) -ATPase expression in the kidney. Clin Exp Pharmacol Physiol. 2015;42(10):1118-1126.
Buege JA, Aust SD. Microsomal lipid peroxidation. Methods Enzymol. 1978;52:302-310.
Cai T, Wang H, Chen Y, Liu L, Gunning WT, Quintas LE, et al. Regulation of caveolin-1 membrane trafficking by the Na/K-ATPase. J Cell Biol. 2008;182(6):1153-1169.
Cao H, Gerhold K, Mayers JR, Wiest MM, Watkins SM, Hotamisligil GS. Identification of a lipokine, a lipid hormone linking adipose tissue to systemic metabolism. Cell. 2008;134(6):933-944.
Chalmers L, Kaskel FJ, Bamgbola O. The role of obesity and its bioclinical correlates in the progression of chronic kidney disease. Adv Chronic Kidney Dis. 2006;13(4):352-364.
Chauhan V, Vaid M. Dyslipidemia in chronic kidney disease: managing a high-risk combination. Postgrad Med. 2009;121(6):54-61.
Chen Y, Cai T, Wang H, Li Z, Loreaux E, Lingrel JB, et al. Regulation of intracellular cholesterol distribution by Na/K-ATPase. J Biol Chem. 2009;284(22):14881-14890.
Choudhury D, Tuncel M, Levi M. Disorders of lipid metabolism and chronic kidney disease in the elderly. Semin Nephrol. 2009;29(6):610-620.
C o r n e l i u s F. C h o l e s t e r o l - d e p e n d e n t i n t e r a c t i o n of polyunsaturated phospholipids with Na,K-ATPase. Biochemistry. 2008;47(6):1652-1658.
Crescenzo R, Bianco F, Mazzoli A, Giacco A, Cancelliere R, di Fabio G, et al. Fat quality influences the obesogenic effect of high fat diets. Nutrients. 2015;7(11):9475-9491.
Cuevas FJ, Jameson DM, Sotomayor CP. Modulation of reconstituted pig kidney Na+/K+-ATPase activity by cholesterol in endogenous lipid vesicles: Role of lipid domains. Biochemistry. 2006;45(46):13855-13868.
Dalboge LS, Pedersen PJ, Hansen G, Fabricius K, Hansen HB, Jelsing J, et al. A hamster model of diet-induced obesity for preclinical evaluation of anti-obesity, anti-diabetic and lipid modulating agents. PLoS One. 2015;10(8):e0135634.
El-Haschimi K, Pierroz DD, Hileman SM, Bjorbaek C, Flier JS. Two defects contribute to hypothalamic leptin resistance in mice with diet-induced obesity. J Clin Invest. 2000;105(12):1827-1832.
El-Zein O, Usta J, El Moussawi L, Kreydiyyeh SI. Leptin inhibits the Na(+)/K(+) ATPase in Caco-2 cells via PKC and p38MAPK. Cell Signal. 2015;27(3):416-423.
Feraille E, Rousselot M, Rajerison R, Favre H. Effect of insulin on Na+,K(+)-ATPase in rat collecting duct. J Physiol. 1995;488(Pt 1):171-180.
Fine JB, Fine RM. Leptin levels in obesity. Int J Dermatol. 1997;36(10):727-728.
Folch J, Lees M, Stanley GHS. A simple method for the isolation and purification of total lipides from animal tissues. J Biol Chem. 1957;226(1):497-509.
Frazier-Wood AC. Dietary patterns, genes, and health: challenges and obstacles to be overcome. Curr Nutr Rep. 2015;4:82-87.
Galuska D, Kotova O, Barres R, Chibalina D, Benziane B, Chibalin AV. Altered expression and insulin-induced trafficking of Na+-K+-ATPase in rat skeletal muscle: effects of high-fat diet and exercise. Am J Physiol Endocrinol Metab. 2009;297(1):E38-49.
Gupta S, Yan Y, Malhotra D, Liu J, Xie Z, Najjar SM, et al. Ouabain and insulin induce sodium pump endocytosis in renal epithelium. Hypertension. 2012;59(3):665-672.
Heinonen JK, Lahti RJ. A new and convenient colorimetric determination of inorganic orthophosphate and its application to the assay of inorganic pyrophosphatase. Anal Biochem. 1981;113(2):313-317.
Henegar JR, Bigler SA, Henegar LK, Tyagi SC, Hall JE. Functional and structural changes in the kidney in the early stages of obesity. J Am Soc Nephrol. 2001;12(6):1211-1217.
Ito O, Kondo Y, Oba M, Takahashi N, Omata K, Abe K. Tyrosine kinase, phosphatidylinositol 3-kinase, and protein kinase C regulate insulin-stimulated NaCl absorption in the thick ascending limb. Kidney Int. 1997;51(4):1037-1041.
Kambham N, Markowitz GS, Valeri AM, Lin J, D’Agati VD. Obesity-related glomerulopathy: an emerging epidemic. Kidney Int. 2001;59(4):1498-1509.
Kava L, Rossi NF, Mattingly R, Yingst DR. Increased expression of Na,K-ATPase and a selective increase in phosphorylation at Ser-11 in the cortex of the 2-kidney, 1-clip hypertensive rat. Am J Hypertens. 2012;25(4):487-491.
Kennedy DJ, Chen Y, Huang W, Viterna J, Liu J, Westfall K, et al. CD36 and Na/K-ATPase-alpha1 form a proinflammatory signaling loop in kidney. Hypertension. 2013;61(1):216-224.
Kwon EY, Shin SK, Cho YY, Jung UJ, Kim E, Park T, et al. Time-course microarrays reveal early activation of the immune transcriptome and adipokine dysregulation leads to fibrosis in visceral adipose depots during diet-induced obesity. BMC Genomics. 2012;13:450.
Lee HS, Nam Y, Chung YH, Kim HR, Park ES, Chung SJ, et al. Beneficial effects of phosphatidylcholine on high-fat diet-induced obesity, hyperlipidemia and fatty liver in mice. Life Sci. 2014;118(1):7-14.
Effects of high fat diet on kidney lipid content and the Na,K-ATPase activity
Rackova L. Cholesterol load of microglia: contribution of membrane architecture changes to neurotoxic power? Arch Biochem Biophys. 2013;537(1):91-103.
Reinhard L, Tidow H, Clausen MJ, Nissen P. Na(+),K (+)-ATPase as a docking station: protein-protein complexes of the Na(+),K (+)-ATPase. Cell Mol Life Sci. 2013;70(2):205-222.
Rodrigo R, Bachler JP, Julia A, Prat H, Passalacqua W. Relationship between (Na plus K)-ATPase activity, lipid peroxidation and fatty acid profile in erythrocytes of hypertensive and normotensive subjects. Mol Cell Biochem. 2007;303(1-2):73-81.
Rodrigo R, Miranda-Merchak A, Grau RV, Bachler JP, Vergara L. Modulation of (Na,K)-ATPase activity by membrane fatty acid composition: therapeutic implications in human hypertension. Clin Exp Hypert. 2014;36(1):17-26.
Sasatomi Y, Tada M, Uesugi N, Hisano S, Takebayashi S. Obesity associated with hypertension or hyperlipidemia accelerates renal damage. Pathobiology. 2001;69(2):113-118.
Savino F, Liguori SA, Benetti S, Sorrenti M, Fissore MF, Cordero di Montezemolo L. High serum leptin levels in infancy can potentially predict obesity in childhood, especially in formula-fed infants. Acta Paediatr. 2013;102(10):e455-459.
Seki G, Hideomi Y, Li Y, Horita S, Suzuki M, Toshiro F. The roles of abnormal renal sodium handling in hypertension associated with metabolic syndrome. Curr Hypert Rev. 2008;4(3):197-202.
Sharma R, Schumacher U, Ronaasen V, Coates M. Rat intestinal mucosal responses to a microbial flora and different diets. Gut. 1995;36(2):209-214.
Surwit RS, Petro AE, Parekh P, Collins S. Low plasma leptin in response to dietary fat in diabetes- and obesity-prone mice. Diabetes. 1997;46(9):1516-1520.
Szolkiewicz M, Sucajtys E, Chmielewski M, Wolyniec W, Rutkowski P, Boguslawski W, et al. Increased rate of cholesterologenesis - a possible cause of hypercholesterolemia in experimental chronic renal failure in rats. Horm Metab Res. 2002;34(5):234-237.
Van der Paal J, Neyts EC, Verlackt CCW, Bogaerts A. Effect of lipid peroxidation on membrane permeability of cancer and normal cells subjected to oxidative stress. Chem Sci. 2016;7(1):489-498.
van Jaarsveld BC, Krijnen P, Derkx FH, Oei HY, Postma CT, Schalekamp MA. The place of renal scintigraphy in the diagnosis of renal artery stenosis. Fifteen years of clinical experience. Arch Intern Med. 1997;157(11):1226-1234.
van Onna M, Houben AJ, Kroon AA, Wierema TK, Koster D, van Engelshoven JM, et al. Asymmetry of renal blood flow in patients with moderate to severe hypertension. Hypertension. 2003;41(1):108-113.
Wang L, Xu F, Zhang XJ, Jin RM, Li X. Effect of high-fat diet on cholesterol metabolism in rats and its association with Na(+)/K (+)-ATPase/Src/pERK signaling pathway. J Huazhong Univ Sci Technolog Med Sci. 2015;35(4):490-494.
Yeagle PL, Young J, Rice D. Effects of cholesterol on (Na+,K+)-ATPase ATP hydrolyzing activity in bovine kidney. Biochemistry. 1988;27(17):6449-6452.
Yingst DR, Araghi A, Doci TM, Mattingly R, Beierwaltes WH. Decreased renal perfusion rapidly increases plasma membrane Na-K-ATPase in rat cortex by an angiotensin II-dependent mechanism. Am J Physiol Renal Physiol. 2009;297(5):F1324-1329.
Yoneda JS, Rigos CF, de Lourenco TF, Sebinelli HG, Ciancaglini P. Na,K-ATPase reconstituted in ternary liposome: the presence of cholesterol affects protein activity and thermal stability. Arch Biochem Biophys. 2014;564:136-141.Issue number is missing
Young DO, Lund RJ, Haynatzki G, Dunlay RW. Prevalence of the metabolic syndrome in an incident dialysis population. Hemodial Int. 2007;11(1):86-95.
Received for publication on 05th April 2017