THERMAL REQUIREMENTS OF CITRUS FRUITS GRAFTED ONTO
ROOTSTOCKS IN THE LOW
-
MIDDLE REGION OF THE SÃO FRANCISCO
RIVER BASIN
1FÁDIA SAMARA SANTOS NASCIMENTO2*, VALTEMIR GONÇALVES RIBEIRO2, DÉBORA COSTA BASTOS3, JUCIENY FERREIRA DE SÁ4, PEDRO HENRIQUE DIAS NASCIMENTO5
ABSTRACT – To understand the production cycle of a particular cultivar in a given region, it is necessary to obtain information related to its phenology and the accumulated degree days. The purpose of this study was to evaluate the phenological cycle of citrus species grafted onto two rootstocks and grown in the Low-Middle Region of the São Francisco River Basin, in particular with respect to accumulated degree days. The experiment was conducted using ‘Rubi’ and ‘Pera D-12’ oranges and ‘Page’ mandarins. Two rootstocks were used, namely ‘Cravo’ and ‘Volkameriano’ lemon species that were drip irrigated in the Campo Experimental de Bebedouro, an experimental field owned by Embrapa Semiárido. ‘Page’ mandarins with ‘Cravo’ or ‘Volkameriano’ rootstocks exhibited a subperiod (0–10) of 183.32 and 181.24 days, respectively. Meanwhile, ‘Pera D-12’ and ‘Rubi’ oranges with ‘Cravo’ rootstocks had values of 249.57 and 178.58 days, respectively, while those with ‘Volkameriano’ rootstocks had values of 226.35 and 200.41 days, respectively. The accumulated degree days were measured from the initial sprouting to harvesting, which took place when the fruits presented a soluble solids/titratable acidity ratio equal to or greater than 12. ‘Page’ mandarins required 2,720 degree days, whereas ‘Pera D-12’ and ‘Rubi’ oranges required approximately 3,390 and 2,280 degree days, respectively. Finally, ‘Pera D-12’ and ‘Rubi’ oranges with either rootstock presented cycles characterized as mid-season and precocious, respectively, while ‘Page’ mandarins had precocious cycles.
Keywords: Phenology. Degree days. Orange. Mandarin. Caatinga biome.
EXIGÊNCIAS TÉRMICAS DE FRUTOS DE ESPÉCIES CÍTRICAS SOBRE DOIS PORTA
-ENXERTOS NO SUBMÉDIO SÃO FRANCISCO
RESUMO - Para definir o ciclo de produção de uma cultivar em uma determinada região são necessárias informações relacionadas à fenologia e ao acúmulo de graus-dia para a sua produção. O objetivo deste trabalho foi avaliar o ciclo fenológico de espécies cítricas, enxertadas sobre dois Porta- enxertos em função do acúmulo de graus-dias nas condições do Submédio São Francisco. O experimento foi conduzido com duas laranjeiras ‘Rubi’ e ‘Pera D-12’ e uma tangerineira ‘Page’, sobre dois porta-enxertos: limoeiros ‘Cravo’ e limoeiro ‘Volkameriano’, irrigadas por gotejamento, no Campo Experimental de Bebedouro, pertencente à Embrapa Semiárido. Para a tangerineira ‘Page’ nos porta-enxertos ‘Cravo’ e ‘Volkameriano’, o subperíodo (0-10) foi de 183,32 dias e 181,24 dias, respectivamente; para as laranjeiras ‘Pera D-12’ e ‘Rubi’, sobre o porta-enxerto ‘Cravo’, foi de 249,57 dias e 178,58 dias e, para o ‘Volkameriano’, foi de 226,35 dias e 200,41dias, respectivamente. Desde a emissão da brotação até a colheita, fase em que os frutos apresentaram valor de “ratio” igual ou superior a 12, para a tangerineira ‘Page’ foram necessários aproximadamente 2.720 graus-dias, e para as laranjeiras ‘Pera D12’ e ‘Rubi’, aproximadamente 3.390 e 2.280 graus-dias, respectivamente. As laranjeiras ‘Pera D-12’ e ‘Rubi’, enxertadas sobre os dois porta-enxertos apresentaram ciclos caracterizados como sendo de meia-estação e precoce, respectivamente, e a tangerineira ‘Page’, ciclo precoce.
Palavras-chave: Fenologia. Graus-dia. Laranjeira. Tangerineira. Bioma caatinga.
____________________ *Corresponding author
1Received for publication in 11/01/2016; accepted in 05/16/2017. Paper extracted from the Master’s dissertation of the first author.
INTRODUCTION
Brazil ranks first in the worldwide production of both oranges and orange juice, generating approximately 17 million tons in 2017 (IBGE, 2017). The largest subnational producer of oranges is the State of São Paulo, with an estimated production of 12.290 million tons. The Northeast Region of Brazil is the second-largest producer in the country, with a total yield of approximately 1.026 million tons (ANUÁRIO, 2016). In addition, Brazil is the third largest producer of mandarin oranges and hybrids, with an estimated yield of 937,819 tons in 2014 (AGRIANUAL, 2016).
The São Francisco River Valley region has one of the most favorable climatic and soil conditions for the growth of citrus fruit. This valley provides high-quality products with respect to the local market and is particularly notable for its low occurrence of pests and diseases (PASSOS et al., 2010; ALMEIDA; PASSOS, 2011). Koller (2006) reported that species cultivated under high temperature conditions exhibit a decreased growth cycle and inferior production with respect to samples grown under lower temperature conditions.
Citrus plants are among the most studied fruits in Brazil, with research particularly focused on cultivation and phytosanitation. However, few studies regarding their botanical and physiological properties have been completed (ESPOSTI; SIQUEIRA; CECON, 2008). Such studies are important in order to begin cultivating these species in the São Francisco River Valley region. The ability of citrus plants to adapt to different climatic conditions allows these crops to have a wide geographical distribution. This adaptation has resulted in distinct flowering behaviors.
Given the behavioral changes presented by these species geographically, it is necessary to carry out studies of their phenological cycles, focusing on the stages of flowering and fruiting. According to Morellato et al. (2000), phenological characterization makes it possible to determine when the flowers, seeds, and fruits are available. In order to determine the ideal harvest times for optimal fruit quality, it is important to understand the growing process and fruit development (ESPOSTI; SIQUEIRA; CECON, 2008).
The purpose of this study was to evaluate the phenological cycle of citrus species that were grafted onto two rootstocks and grown in the Low-Middle Region of the São Francisco River Basin, with particular focus on accumulated degree days.
MATERIAL AND METHODS
The experiment was conducted between September 2014 and August 2015 at the Campo Experimental de Bebedouro, which belongs to Embrapa Semiárido in the municipality of Petrolina, PE, located at latitude: 9°09′S; longitude: 40°22′W; altitude: 365 m. According to Koeppen (1948), the climate in the region can be classified as BShw, corresponding to a very hot, semi-arid climate, with a minimum average temperature of 21.6 °C and a maximum of 32.9 °C. Meteorological data was obtained from the Estação Agrometeorológica de Bebedouro of Embrapa Semiárido. The experiment was completed in Red-Yellow Argisol.
‘Rubi’ and ‘Pera D-12’ oranges and ‘Page’ mandarins were used. ‘Cravo’ and ‘Volkameriano’ lemons were used for rootstocks, with a spacing of 7 × 4 m. All trees were 10 years old. Drip irrigation was employed using two drip lines (120 L/day/plant) that were spaced every 50 cm along the planting line. The plants were fertilized and cultivated (with pruning) according to established techniques for these species, following the usual citrus calendar.
The phenological stages were evaluated by marking and tracking 40 branches on four plants of each of the tested cultivar combinations. Flowering was evaluated by tracking early sprouting and sprout growth during the crop’s phenological cycle.
The number of accumulated degree days (DD) was calculated over the course of the study. This value was calculated for the different subperiods of the phenological stages, as described by Villa Nova et al. (1972):
DD = (TMAX – TMIN)/2 - Bt
Where:
TMAX = daily maximum temperature (°C); TMIN = daily minimum temperature (°C); Bt = base temperature (13 °C).
The accumulated DD was calculated by adding up the daily DD of every subperiod. Maximum and minimum temperatures obtained in the Estação Agrometeorológica at the Campo Experimental de Bebedouro, Petrolina, PE were used to calculate the DD.
Plants were characterized using descriptive statistics with confidence intervals, applying the Student’s t-test to compare the averages of both the number of days and the degree days. The tests had a 5% probability of error and were completed using the statistical program SAS (Statistical Analysis System) (SAS, 2008) version 8.2.
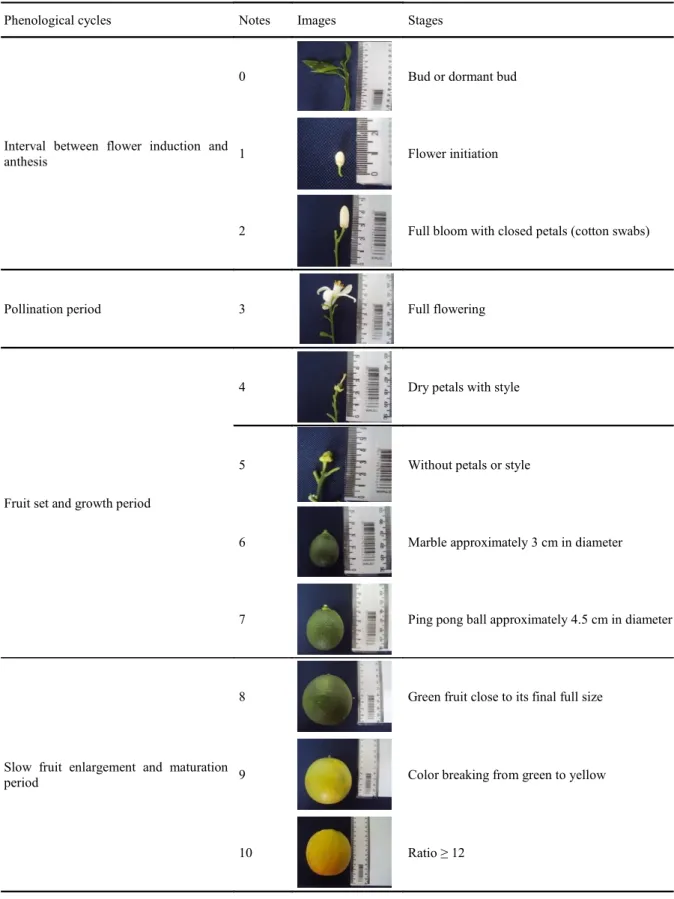
fruit with an approximate diameter of 4.5 cm (“ping pong ball”); (8) green fruit close to its final full size; (9) color breaking from green to yellow. Photographs of these varieties were also used to determine the
physical and physicochemical properties of the plants; (10) Ratio (Soluble Solids (°Brix)/Titratable Acidity (% of citric acid)) ≥ 12 (BARBASSO; PEDRO JÚNIOR; PIO, 2005) (Table 1).
Table 1. Scale for the different orange and mandarin reproductive stages attached to different rootstocks.
Phenological cycles Notes Images Stages
Interval between flower induction and anthesis
0 Bud or dormant bud
1 Flower initiation
2 Full bloom with closed petals (cotton swabs)
Pollination period 3 Full flowering
Fruit set and growth period
4 Dry petals with style
5 Without petals or style
6 Marble approximately 3 cm in diameter
7 Ping pong ball approximately 4.5 cm in diameter
Slow fruit enlargement and maturation period
8 Green fruit close to its final full size
9 Color breaking from green to yellow
RESULTS AND DISCUSSION
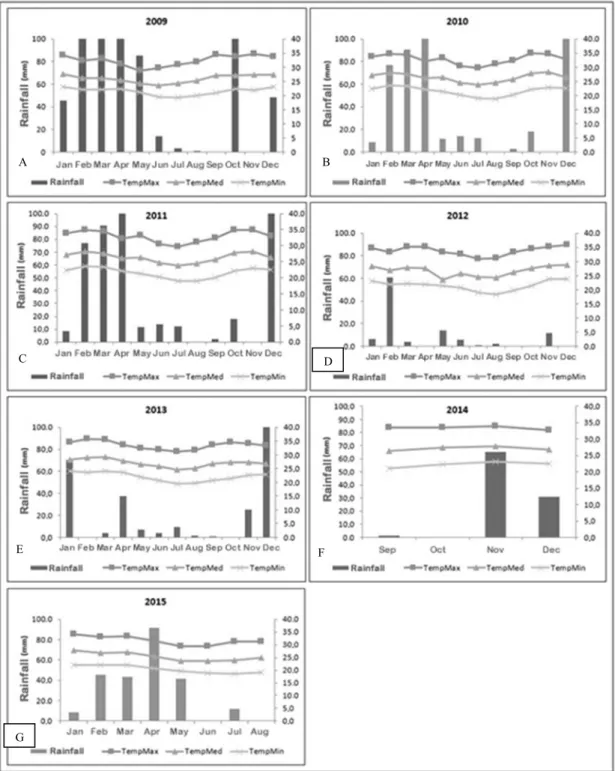
Figure 1 (A-G) displays monthly
meteorological data, including both rainfall and average, maximum, and minimum temperatures.
These cover the years preceding the studies, from 2009 to 2013, and from September 2014 to August 2015, respectively. This information was provided by Embrapa Semiárido.
A B
C D
E F
G
Figure 1. Monthly data detailing rainfall and average, maximum, and minimum temperature from the five years preceding
There was greater rainfall in 2009 compared with 2010. The year 2012 exhibited the greatest shortage of rainfall over that five-year period. There was more evenly distributed rainfall during the research period. Medium temperatures increased in months in different years, reaching average annual
temperatures of approximately 27 °C.
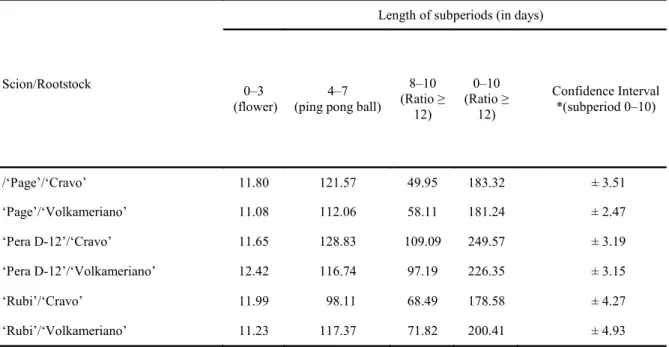
Given the conditions of the study, it was possible to verify that the fruits produced by dormant buds showed subperiods of development that ranged from 178.58 to 249.57 days. (Table 2 and Figure 2).
Table 2. Average length of development subperiods (in days) for the orange and mandarin samples with different
rootstocks, 2014–2015 harvest.
Scion/Rootstock
Length of subperiods (in days)
0–3 (flower)
4–7 (ping pong ball)
8–10 (Ratio ≥
12)
0–10 (Ratio ≥
12)
Confidence Interval *(subperiod 0–10)
/‘Page’/‘Cravo’ 11.80 121.57 49.95 183.32 ± 3.51
‘Page’/‘Volkameriano’ 11.08 112.06 58.11 181.24 ± 2.47 ‘Pera D-12’/‘Cravo’ 11.65 128.83 109.09 249.57 ± 3.19
‘Pera D-12’/‘Volkameriano’ 12.42 116.74 97.19 226.35 ± 3.15
‘Rubi’/‘Cravo’ 11.99 98.11 68.49 178.58 ± 4.27
‘Rubi’/‘Volkameriano’ 11.23 117.37 71.82 200.41 ± 4.93
*with 95% confidence that the mean is within the range.
For ‘Page’ on ‘Cravo’ and ‘Volkameriano’ rootstock, the length of the subperiod (0–3) was close to 11.80 days and 11.08 days, respectively. The subperiod (0–10) for ‘Cravo’ was higher than for ‘Volkameriano’, at 183.32 days (Table 2 and Figure 2). Different results were found by Nascimento et al. (2013). They observed that ‘Page’ on ‘Cravo’ and ‘Volkameriano’ presented periods of 192 and 179 days, respectively, for the 0–10 subperiod. Meanwhile, Nascimento et al. (2015) measured 229 days from flowering to maturity for ‘Page’ on ‘Volkameriano’ rootstock. However, the mandarin cultivar ‘Murcott’, when inserted on ‘Cravo’, gave a subperiod (3–10) length of 255 days (BARBASSO; PEDRO JÚNIOR; PIO, 2005). These results suggest that the length of the phenological cycle changes for the same cultivar depending on the region. It is very likely that these changes are the result of different temperatures in different regions.
‘Pera D-12’ on ‘Cravo’ rootstock had the longest phenological cycle, reaching a ratio of 12 at
249.57 days. ‘Pera D-12’ combined with
‘Volkameriano’ showed shorter subperiods (4–7 and 8–10) than when combined with ‘Cravo’. To be more precise, the cycle for ‘Pera D-12’ on ‘Volkameriano’
had a shorter subperiod (0–10) length of 226.35 days, rendering it more precocious than ‘Pera
D-12’ on ‘Cravo’ (Table 2 and Figure 2). These results differ from those reported Carvalho et al. (2012) in the phenological characterizations of ‘Pera D-12’ and ‘Pera D-9’ oranges on ‘Volkameriano’, which gave a subperiod (0–10) of 158 and 146 days, respectively.
Figure 2. 95% confidence intervals for the length of the subperiod (0–10) for the combined scion/rootstock in the 2014–2015 harvest.
The subperiod (4–7) was the longest for every single cultivar, meaning that it was the slowest phase. This could be due to the observed high temperatures affecting the growth cycle and plant production. Species cultivated in high temperature environments usually exhibit a lower growth and production cycle compared to those cultivated in lower temperatures (KOLLER, 2006). When
comparing these cultivars with others produced in the State of São Paulo, they also present a shorterer cycle.
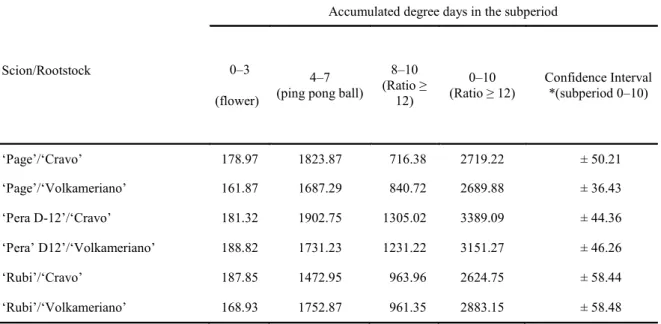
Table 3 and Figure 3 show that the accumulated degree days in the subperiod (0–10) for ‘Page’ combined with ‘Cravo’ necessitated a higher thermal demand (DD=2,719.22) in comparison with ‘Volkameriano’ (DD=2,689.88).
Table 3. Average accumulated degree days in the subperiods, for the combination scion/rootstock, in the 2014–2015
harvest.
Scion/Rootstock
Accumulated degree days in the subperiod
0–3
(flower)
4–7 (ping pong ball)
8–10 (Ratio ≥
12)
0–10
(Ratio ≥ 12) Confidence Interval *(subperiod 0–10)
‘Page’/‘Cravo’ 178.97 1823.87 716.38 2719.22 ± 50.21 ‘Page’/‘Volkameriano’ 161.87 1687.29 840.72 2689.88 ± 36.43
‘Pera D-12’/‘Cravo’ 181.32 1902.75 1305.02 3389.09 ± 44.36
‘Pera’D12’/‘Volkameriano’ 188.82 1731.23 1231.22 3151.27 ± 46.26
‘Rubi’/‘Cravo’ 187.85 1472.95 963.96 2624.75 ± 58.44
‘Rubi’/‘Volkameriano’ 168.93 1752.87 961.35 2883.15 ± 58.48
*with 95% confidence that the mean is within the range.
Different results were observed by Rivadeneira (2012) with the ‘Satsuma Okitsu’ mandarin, which gave a value of 2,029.37 degree days in Zona de Concordia, Entre Ríos Province,
Figure 3. 95% confidence intervals for the average number of accumulated degree days for the subperiod (0–10), for the combination scion/rootstock, in the 2014–2015 harvest.
The lowest values for the ‘Rubi’ orange with the ‘Cravo’ and ‘Volkameriano’ lemon rootstocks were 2,624.75 and 2,883.15 degree days, respectively. Ortolani, Pedro Júnior and Alfonsi (1991) considered orange trees that had values close to 3,100 degree days to be mid-season, which has been verified in the case of ‘Pera D-12’. In this context, ‘Page’, whose value was close to 2,500 degree days, can be considered as having a precocious cycle. In this sense, knowing the thermal requirements of a particular cultivar in different climatic conditions allows for the prediction of different phenological stages, such as its harvest period. (RIVADENEIRA, 2012).
CONCLUSIONS
When grown in the climatic conditions of the Low-Middle Region of the São Francisco River Valley, the ‘Pera D-12’ orange grafted to ‘Cravo’ and ‘Volkameriano’ lemon rootstocks presented a mid-season production cycle, comprising 249.6 days (DD=3,390 °C). The ‘Rubi’ orange and the ‘Page’ mandarin, grafted onto the same rootstocks, showed precocious cycles of 200.40 days (DD=2,280 °C) and 183.3 days (DD=2,720 °C), respectively.
REFERENCES
AGRIANUAL. Anuário da Agricultura Brasileira.
21. ed. São Paulo, SP: FNP Consultoria & Agroinformativos, 2016. 502 p.
ALMEIDA, C. O.; PASSOS, O. P. Citricultura
brasileira em busca de novos rumos: Desafios e oportunidades na região nordeste. 1. ed. Cruz das
ANUÁRIO BRASILEIRO DA FRUTICULTURA. Brasilian Fruit Yearbook. 2016. Disponível em: ˂http://www.grupogaz.com.br/tratadas/
eo_edicao/4/2014/03/20140325_3d8463877/
pdf/4333_fruticultura_2014.pdf˃. Acesso em: 29 jul. 2017.
BARBASSO, D. V.; PEDRO JÚNIOR, M. J.; PIO, R. M.; Caracterização fenológica de variedades do tipo Murcot em três porta-enxertos. Revista Brasileira de Fruticultura, Jaboticabal, v. 27, n. 3, p. 399-403, 2005.
BASTOS, D. C. et al. Fenologia de três cultivares de laranjeira no Vale do São Francisco. In:
CONGRESSO BRASILEIRO DE
FRUTICULTURA, 2012, Bento Gonçalves. Anais... Bento Gonçalves: SBF, 2012, p. 3562-3565.
CARVALHO, R. D. et al. Fenologia da laranjeira ‘Pera D12’ no Vale do São Francisco. In:;
CONGRESSO BRASILEIRO DE
FRUTICULTURA, 2012, Bento Gonçalves. Anais... Bento Gonçalves: SBF, 2012, p. 3566- 3568.
ESPOSTI, M. D. A.; SIQUEIRA, D. L.; CECON, P. R. Crescimento de frutos da tangerineira
‘Poncã’ (Citrus reticulata Blanco). Revista
Brasileira de Fruticultura, Jaboticabal, v. 30, n. 3, p. 657-661, 2008.
los climas de la Tierra. México: Fondo de Cultura Economia. 1. ed. México, 1948, 478 p.
KOLLER, O. C. Citricultura: 1. Laranja: tecnologia de produção, pós-colheita, industrialização e comercialização. 1. ed. Porto Alegre, RS: Cinco Continentes, 2006. 395 p.
MORELLATO, L. P. C. et al. Phenology of atlantic rain forest trees: a comparative study. Biotropica, Belo Horizonte , v. 32, Sup., p. 811-823, 2000.
NASCIMENTO, F. S. S. et al. Duração das fases fenológicas de tangerineira ‘Page’ em dois porta -enxertos nas condições do Semiárido nordestino. In: VIII Jornada de Iniciação Científica da Embrapa Semiárido. 253., 2013, Petrolina. Anais... Petrolina: Embrapa, 2013. p. 203-208.
NASCIMENTO, P. H. D. et al. Ciclo de Produção da Tangerineira Page no Submédio Vale do São Francisco. In: X Jornada de Iniciação Cientifica da Embrapa Semiárido. 264, 2015, Petrolina. Anais... Petrolina: Embrapa, 2015. p. 47-51.
ORTOLANI, A. A.; PEDRO JÚNIOR, M. J.; ALFONSI, R. R. Agroclimatologia e o cultivo dos citros. In: RODRIGUEZ, O. et al. (Eds.). Citricultura brasileira. Campinas: Fundação Cargill, 1991. v. 1, p. 153-188.
PASSOS, O. S. et al. Potencialidade do submédio São Francisco para citricultura. In: Seminário Desafios e Potencialidades da Fruticultura no semiárido, 3., 2010, Petrolina. Anais... Petrolina: Embrapa Semiárido, 2010. p. 1-16.
RIVADENEIRA, M. F. Grados dias acumulados
en naranjas y mandarinas sobre pie trifolio en la zona de Concordia. 31. ed. Buenos Aires: Associación Argentina de Horticultura, 2012. 26 p.
STATISTICAL ANALYSIS SYSTEM - SAS. SAS/
STAT User’s Guide. Version 8.2. Cary, NC, p. 943, 2008.
VILLA NOVA, N. A. et al. Estimativa de graus


