José Carlos Leitão Portugal Nunes
julho de 2014
Cognitive and physical performance
correlates of low iron status
UMinho|20
14
José Carlos Leitão P
or tugal N unes Cognitive and ph ysical per formance correlates of lo w iron s tatus
Universidade do Minho
Escola de Ciências da Saúde
Trabalho efetuado sob a orientação da
Professora Doutora Joana Almeida Santos
Pacheco Palha
e coorientação da
Doutora Nadine Correia Santos
José Carlos Leitão Portugal Nunes
julho de 2014
Dissertação de Mestrado
Mestrado em Ciências da Saúde
Cognitive and physical performance
correlates of low iron status
Universidade do Minho
Escola de Ciências da Saúde
ii DECLARAÇÃO
Nome: José Carlos Leitão Portugal Nunes
Endereço eletrónico: [email protected] Número do Bilhete de Identidade: 13253180
Título da dissertação:
Cognitive and physical performance correlates of low iron status Orientadora:
Professora Doutora Joana Almeida Santos Pacheco Palha Coorientadora:
Doutora Nadine Correia Santos
Ano de conclusão: 2014 Designação do Mestrado: Ciências da Saúde
DE ACORDO COM A LEGISLAÇÃO EM VIGOR, NÃO É PERMITIDA A REPRODUÇÃO DE QUALQUER PARTE DESTA DISSERTAÇÃO
Universidade do Minho, 23 de julho de 2014
iii
“Would you tell me, please, which way I ought to go from here?" "That depends a good deal on where you want to get to," said the Cat. "I don't much care where –" said Alice.
"Then it doesn't matter which way you go," said the Cat. "– so long as I get somewhere," Alice added as an explanation.
"Oh, you're sure to do that," said the Cat, "if you only walk long enough." "But I don't want to go among mad people," Alice remarked.
"Oh, you can't help that," said the Cat: "We're all mad here. I'm mad. You're mad." "How do you know I'm mad?" said Alice.
"You must be," said the Cat, "otherwise you wouldn't have come here."
Lewis Carroll's novel, Alice's Adventures in Wonderland
A toda a minha família, mas em especial ao mais recente membro, a minha sobrinha Diana, e ao seu mais antigo elemento, a minha Avó. À minha Irmã por ser um exemplo de força e carácter e um dos meus mais sólidos pilares. Aos meus Pais.
v
Agradecimentos
À Joana não só por ter sido orientadora deste trabalho mas principalmente pela disponibilidade sempre demonstrada, pela pertinência das sugestões, pela precisão dos seus comentários críticos e firmes, mas sobretudo pelo seu perfil, que alia o aspeto humano à competência profissional e pelo enorme contributo para minha formação profissional e pessoal. Se hoje sou melhor do que era quando comecei este percurso é graças a muitos mas principalmente graças à Joana. Se amadureci durante este período foi muito pelo que a Joana me ensinou, mesmo quando me levava a passear pelos jardins do ICVS, pois as palavras que tinha para me dizer eram duras, eu percebi sempre que eram para meu bem e que eram o melhor que alguém poderia fazer por mim. Muito obrigado também pela paciência que sempre teve comigo e por me estar sempre a desafiar para que eu saiba mais e melhor sobre tudo aquilo que conversamos. Aproveito ainda para agradecer a oportunidade que me deu ao integrar-me na sua equipa de investigação. Esta foi sem dúvida a mais importante das oportunidades que tive para iniciar uma carreira na investigação e pela qual serei para sempre grato. É uma honra trabalhar com alguém com tão elevada qualidade e mérito, e espero que essa honra me seja permitida durante muitos e muitos anos. Se queremos ser bons temos de trabalhar com os melhores, e eu tenho essa sorte.
À Nadine pelo papel que teve na coorientação deste trabalho e pela disponibilidade sempre demonstrada. Por estar lá sempre que eu precisei. Por me por a mexer quando eu estava “encalhado”. Pelos votos de confiança. Pelas chamadas de atenção. Pelos desafios e provas de fogo. Pela partilha de ideias e discussões. Pela liberdade para divagar. Por me chamar de volta à Terra quando a viagem na Lua já ia longa. Por me dar razão quando eu a tinha e por não ceder quando eu não a tinha, apesar da minha enorme “persistência” (a.k.a. teimosia). Pelo tanto que tenho para agradecer mas que não tenho palavras para expressar.
À Margarida por ser sempre um ombro amigo, por estar sempre presente, por olhar para a minha cara e perceber o meu estado de espirito. Por me colocar sempre mais e mais desafios. Por tantas coisas que tenho para agradecer e porque tenho tão poucas palavras para o fazer, resta-me apenas dizer que agradeço por tudo. Que venham muitos anos como estes últimos 2 anos e meio de preferência acompanhados com muita Erdinger Weissbier.
vi
Ao Nuno por me fazer sentir integrado no NeRD, pelos desafios que me colocou e pela disponibilidade sempre demonstrada; pela pertinência das sugestões e pela forma como nos faz pensar nas perguntas que coloca. Agradeço ainda o exemplo de trabalho e competência. Todas estas são características essenciais e que ambiciono um dia vir a adquirir.
À Liliana, ao Pedro e à Teresa (por ordem alfabética) por todo o apoio no desenvolvimento deste trabalho e por disporem do seu tempo para que ele se concretizasse. Ao Paulo, ao Ricardo e ao Zé Miguel (por ordem alfabética) pelo apoio demostrado neste percurso. A todos vós pela amizade e companheirismo. Muito obrigado por tudo aquilo que vocês sabem e que eu sei que não preciso de dizer.
Ao Patrício pelo tanto que me ensinou, por ter despertado em mim o gosto pela estatística. Pelo exemplo de carácter e capacidade de relacionamento. Muito obrigado pelos ensinamentos que foram para além da ciência. Ao Mariz e ao Capela pelo apoio no recrutamento de participantes e pelas pertinentes sugestões que deram ao longo do desenvolvimento deste trabalho. A toda a equipa do CCA, em especial à Enf.ª Ana Berta. Muito obrigado.
A todos os NeRDs, mas em especial à Ana Maria, à Cláudia, à Daniela e à Joana, por me tratarem sempre tão bem. Destaco também a Catarina e a Fernanda pelo apoio e esclarecimento de dúvidas que iam surgindo.
À Inês, não pelo passado, não pelo futuro que espero que tenhamos, mas pelo presente que me proporcionas. Obrigado por tornares os meus dias mais leves e por sempre que estamos juntos me fazeres esquecer que existe mais mundo para além de ti.
Apesar de em nome da amizade não dever agradecer, não resisto em o fazer. Ladies
first – à Ana, à Elisa, à Joana e à Martina (por ordem alfabética); Gentlemen – ao António, ao Iúri, ao Mateus, ao Nuno, ao Vítor M. ao Vítor P. e ao Zé Dinis (por ordem alfabética). Apesar de não ter resistido em vos agradecer, resisto agora em dizer porquê; cada um sabe e sente as minhas razões. Obrigado “Gang” por, apesar das minhas ausências, a cada regresso sinto que nunca estive longe. Ao Nuno uma palavra especial – obrigado por seres o “irmão” para todos os momentos.
vii
Abstract
Iron deficiency is the most prevalent nutrient deficiency affecting all age groups worldwide. Deleterious alterations on cognition, psychological morbidity and physical performance have been observed in several reports; however, the main body of literature focuses on infants, children, adolescents or women of childbearing age. These groups are considered to be at high risk due to physiologic conditions. Nonetheless, several pathological conditions are also risk factors for iron deficiency, with many of them highly prevalent in older individuals. In a growing older society, considering that older individuals are at greater risk of cognitive decline, neuropsychological morbidity, decrements in physical performance and impaired functional ability, the study of the factors influencing these outcomes are of utmost importance. Still, despite of all the evidence pointing for a role of iron deficiency in cognition, mood and physical functional ability, there is a worrying small amount of research in older individuals.
In this work, by first using a cross-sectional analysis, we investigated the association of low iron status with cognitive performance, neuropsychological morbidity and physical functional ability in a cohort of older individuals (n=151). Next, using a quasi-experimental study design (n=12, intervention; n=10, non-intervention), namely intervention via an iron-fortified fruit–based dessert, we addressed if low dosage iron fortification of foods is feasible and effective in altering (and/or correcting for) the effects of low iron status.
In order to reduce the number of multiple comparisons, principal component analysis of cognitive, psychological, physical variables and iron biomarkers was performed and the obtained dimensions used for analysis. We observed that the storage [body iron, soluble serum transferrin receptor (sTFR), ratio of sTFR to the logarithmic value of ferritin (sTFR – Log(FT)) index and ferritin (FT)] and erythropoiesis [red cells blood Count (RBC), hemoglobin and hematocrit]
dimensions were significant predictors of the memory dimension [selective reminding test (SRT) -
consistent long term retrieval (CLTR), - long term storage (LTS) and - delayed recall (DR) and the Consortium to establish a registry for Alzheimer's disease (CERAD) (total hits and DR)], along with the interaction of storage and nutritional status. The geriatric depression scale (GDS) score was predicted by the transport [serum iron (Fe) and transferrin saturation (TF sat.)], transport saturation [transferrin (TF) and total iron binding capacity (TIBC)] and erythropoiesis dimensions. The functional tiredness (mobility-, lower limb- and upperlimb-tiredness) dimension was predicted by the storage, transport, red cells composition [mean corpuscular volume (MCV), mean cell hemoglobin (MCH), mean cell hemoglobin concentration (MCHC) and red cell distribution width (RDW)] and erythropoiesis dimensions. After 12 weeks (+/- 2 weeks) of intervention, the daily consumption of an iron fortified dessert was associated with an improvement of the total and
viii
sub-scores of performance-oriented mobility assessment, along with hand grip strength and lower limb tiredness.
Our observations indicate that lower iron status is associated with poorer memory ability, depressive mood and functional tiredness from activities of daily living. Furthermore, results indicate that the physical negative effects of low iron status seem to be recovered by iron supplementation, highlighting the importance of prevention. Identification of molecular bases of the associations here reported is paramount and further research is needed.
ix
Resumo
A deficiência de ferro é o deficit nutricional mais prevalente em todo o mundo, afetando todas as faixas etárias. Vários estudos têm demonstrado um impacto negativo da deficiência de ferro sobre a cognição, a morbidade psicológica e desempenho físico; no entanto, os referidos estudos debruçam-se essencialmente em crianças, adolescentes ou mulheres em idade fértil, nos quais várias condições fisiológicas concorrem para que estes grupos sejam considerados de alto risco. No entanto não devemos descurar, igualmente, que várias condições patológicas são fatores de risco para deficiência de ferro, sendo muitas delas altamente prevalentes em idosos. Numa sociedade cada vez mais envelhecida, e onde os indivíduos mais velhos apresentam risco acrescido de declínio cognitivo, morbidade neuropsicologia, decréscimos no desempenho físico e capacidade funcional comprometida, o estudo dos fatores que influenciam estas consequências do envelhecimento são de extrema importância. Apesar de todas as evidências apontarem para um papel da deficiência de ferro na cognição, humor e capacidade física funcional, a investigação em idosos é escassa.
Neste trabalho, utilizando uma análise transversal, investigámos as associações de baixos níveis de ferro com o desempenho cognitivo, a morbidade neuropsicológica e a capacidade funcional física em idosos. Através de um estudo quasi-experimental, investigamos, ainda, se a fortificação de alimentos com pequenas doses de ferro é viável e eficaz para melhorar a capacidade cognitiva, o humor e a condição física.
Com o objetivo de reduzir o número de comparações múltiplas foi realizada a análise dos componentes principais das variáveis cognitivas, psicológicas, físicas e dos biomarcadores de ferro e os componentes obtidos utilizados para análise estatística. Observou-se que os componentes armazenamento [ferro corporal, receptor solúvel da transferrina (sTFR), indice do rácio do sTFR para a transformação logarítmica da ferritina (sTFR – Log(FT)) e ferritina (FT)] e eritropoiese [eritrócitos (RBC), hemoglobina e hematócrito], bem como a interação do componente armazenamento com estado nutricional, foram preditores significativos do
componente memória [teste de memoria selectiva (SRT) – evocação da memória a longo prazo
(CLTR), - armazenamento na memória a longo prazo (LTS) e – evocação tardia (DR); e o Consórcio para estabelecer um registro para a doença de Alzheimer (CERAD) (total de respostas certas e DR)]. O valor da escala de depressão geriátrica (GDS) foi previsto pelos componentes transporte [ferro sérico (Fe) e saturação da transferrina (TF sat.)], saturação do transporte [transferrina (TF) e capacidade total de ligação do ferro (TIBC)] e da eritropoiese. Os componentes armazenamento, transporte, composição células vermelhas [volume corpuscular médio (MCV), hemoglobina corpuscular média (MCH), concentração de hemoglobina
x
corpuscular média (MCHC) e a anisocitose (RDW)] e eritropoiese foram preditores significativos do componente obtido para o cansaço associado às atividades funcionais diárias. Observámos, ainda, que após 12 semanas (+ / - 2 semanas), o consumo diário de uma sobremesa fortificada em ferro se associa a uma melhoria no total e subtotais de avaliação da mobilidade orientada para o desempenho, juntamente com força de preensão manual e menor cansaço dos membros inferiores.
Estes resultados indicam que os níveis de ferro estão associados a menor memória, a humor depressivo e a cansaço funcional nas atividades da vida diária. Além disso, os resultados sugerem que os efeitos negativos de baixo nível de ferro a nível físico melhoram com a suplementação de ferro, destacando a importância da prevenção do declínio nos níveis de ferro. Importa no futuro a confirmação destes resultados em estudos de base populacional, assim como a identificação das bases moleculares que lhes estão subjacentes.
xi
Index
1. Introduction ... 1
1.1. Iron homeostasis... 5
1.1.1. Iron absorption and metabolism ... 5
1.1.2. Assessment of iron status ...15
1.2. Iron deficiency...20
1.2.1. From basics to clinics ...20
1.2.2. Epidemiology of iron deficiency ...23
1.2.3. General health ...25
1.2.4. Physical performance and functional ability ...26
1.2.5. Brain and cognition ...27
1.2.6. Mood ...28
1.3. T(h)reat(en) the iron deficiency ...29
2. Research objectives ... 33
3. Material and methods ... 37
3.1. Subjects and procedures ...39
3.2. Iron food fortification ...41
3.3. Laboratory analyses ...42
3.4. Neurocognitive/psychological assessment ...43
3.4.1. Baseline characterization ...43
3.4.2. Additional assessment ...44
3.4.3. Endpoint characterization ...44
3.5. Assessment of functional ability and physical performance ...44
3.5.1. Questionnaire of functional ability ...44
3.5.2. Hand grip strength ...45
3.5.3. 6-m timed walk ...45
3.5.4. Tinetti evaluation ...45
3.6. Nutritional status and body composition assessment ...46
3.6.1. Mini nutritional assessment ...46
xii
3.6.3. Anthropometric characterization ...46
3.7. Statistical analysis ...48
3.8. Team ...49
4. Results ... 51
4.1 Cross-sectional analysis: iron status correlates of cognition and physical status and performance ...53
4.1.1 Participants characterization ...53
4.1.2 Relevance of iron deficiency for cognition, mood and physical performance ...61
4.1.3 Nutritional risk factors for iron deficiency ...66
4.1.4 Iron status as a possible predictor of cognition, mood and physical functional ability ...68
4.1.5 Mediation effect of nutritional status on the iron status components ...76
4.2. Longitudinal analysis: iron fortification, cognition, mood and physical performance ...82
4.2.1 Characterization of participants ...82
4.2.2 Variation of hematological dimensions during intervention ...85
4.2.3 Comparison of pre- and post-intervention differences in cognitive variables ...88
4.2.4 Longitudinal analysis of psychological morbidity difference between groups ...90
4.2.5 Time-treatment interaction on physical performance and functional ability ...91
5. Discussion and conclusions ... 95
5.1. Strengths and limitations ...97
5.2. Iron deficiency or low iron status – What matters? ...99
5.3. Nutritional status and iron nutriture – obviously! ... 100
5.4. Memory - the neurocognitive facet of lower iron status ... 101
5.5. Depressive mood in depressed iron status ... 104
5.6. If we are not made of iron, we get tired ... 104
5.7. Can we reverse it and its liabilities? ... 105
5.8. Concluding remarks and future directions ... 106
xiii
Tables index
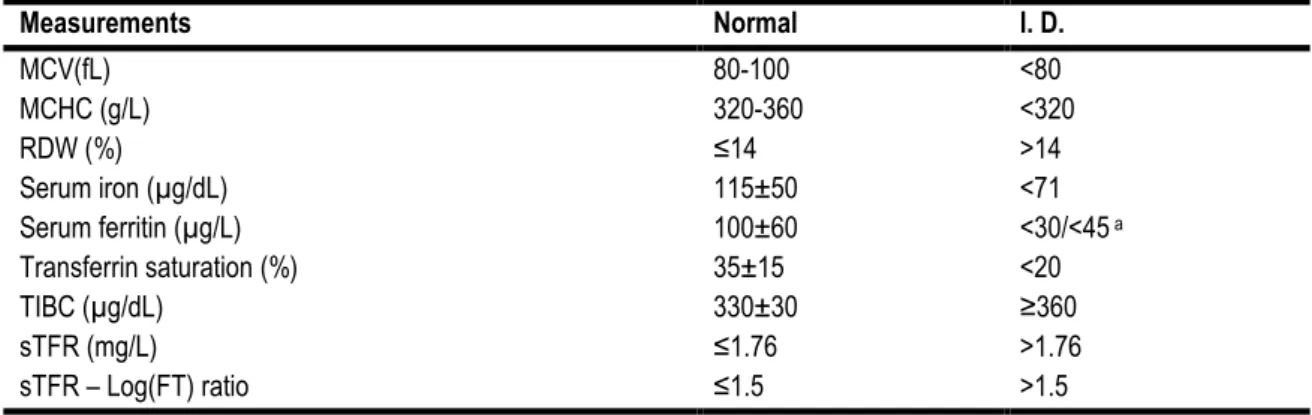
Table 1 - Cut off points for ID diagnosis. Adapted from Susan F Clark, 2009; Gibson, 2005; G. H. Guyatt et al., 1992; Gordon H Guyatt et al., 1990; Herbert, 1987; Johnson-Wimbley & Graham, 2011; Punnonen et al., 1997; Rimon et al., 2002; Zhu et al., 2010; Zimmermann &
Hurrell, 2007 ... 20
Table 2 - Physiologic and pathologic conditions that can cause ID or IDA. Adapted from Nancy C. Andrews, 1999; Susan F. Clark, 2008; Susan F Clark, 2009; Munoz, Garcia-Erce, & Remacha, 2011b ... 21
Table 3 - Prevalence of IDA in WHO regions, 2004 ... 23
Table 4 - Deaths (population in thousands) due to IDA by age and sex, in WHO regions. Global health estimates 2012 ("WHO | Estimates for 2000–2012," 2014). ... 24
Table 5 - Burden of disease in DALYs (population in thousands) due to IDA by age and sex, in WHO regions. Global health estimates 2012 ("WHO | Estimates for 2000–2012," 2014). ... 25
Table 6 – Common iron compounds used in iron deficiency treatment and prevention. Adapted from Dary & Hurrell, 2006; Macdougall, 1999 ... 30
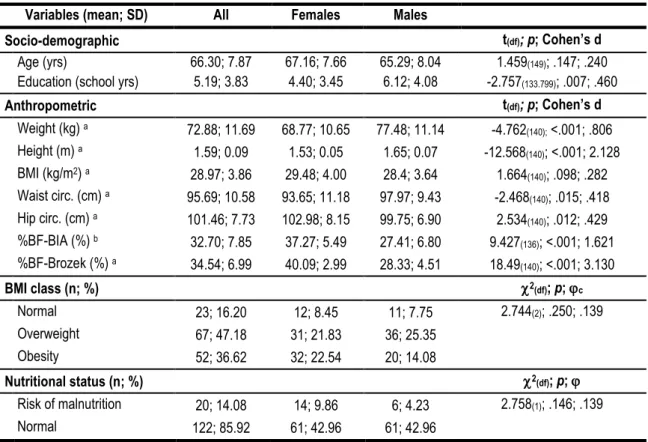
Table 7 - Socio-demographic, anthropometric and nutritional characteristics of participants. ... 53
Table 8 - Neuropsychological and neurocognitive variables in all sample and by gender. ... 55
Table 9 - Physical functional ability sub-scales and functional dimensions. ... 57
Table 10 - Hematologic variables and dimensions for iron status assessment. ... 59
Table 11 - Characteristics of participants with and without ID ... 61
Table 12 - Neuropsychological and neurocognitive variables in iron sufficiency and ID. ... 62
Table 13 - Functional ability and functional dimensions regarding iron status classification ... 62
Table 14 - Hematologic variables and dimensions in iron status groups. ... 64
Table 15 – ANCOVA for neurocognitive dimensions ... 65
Table 16 – ANCOVA for general cognition variables ... 66
Table 17 - ANCOVA for neuropsychological variables ... 66
Table 18 – ANCOVA for functional dimensions ... 66
Table 19 – Binary logistic regression of nutritional predictors for ID ... 67
Table 20 - Hierarchical regression models to predict neurocognitive dimensions. ... 69
Table 21 - Hierarchical regression models to predict general cognition. ... 71
xiv
Table 23 - Hierarchical regression models to predict functional dimensions. ... 75
Table 24 - Hierarchical regression models of interaction to predict neurocognitive dimensions. ... 77
Table 25 - Hierarchical regression models of interaction to predict general cognition ... 79
Table 26 - Hierarchical regression models of interaction to predict neuropsychological variables. ... 80
Table 27 - Hierarchical regression models of interaction to predict functional dimensions. ... 81
Table 28 - Characteristics comparison for participants. ... 83
Table 29 - Neuropsychological and neurocognitive variables of participants. ... 84
Table 30 - Baseline characteristics on physical functional ability. ... 84
Table 31 – Hematological characterization and comparison at baseline ... 85
Table 32 - Repeated measures ANOVA for hematological dimensions ... 86
Table 33 - Repeated measures ANOVA for hematological variables. ... 87
Table 34 - Neurocognitive pre- and post-intervention comparison of differences. ... 89
Table 35 - Repeated measures ANOVA of neurocognitive assessment. ... 90
Table 36 - Pre- and post-intervention comparison of differences for neuropsychological assessment ... 91
Table 37 - Repeated measures ANOVA for balance ... 92
Table 38 - Repeated measures ANOVA for walking ability ... 92
Table 39 - Repeated measures ANOVA for hand grip strength ... 92
xv
Figure index
Figure 1 - Summary diagram of the established and putative iron absorption pathways in the
intestinal enterocyte. ... 8
Figure 2 – Adult iron distribution and daily whole body iron metabolism. ... 12
Figure 3 - Conceptual diagram of the relationship between iron deficiency and/or anemia in a hypothetical population. Adapted from WHO (2001). ... 15
Figure 4 – Flow Diagram of the study. ... 41
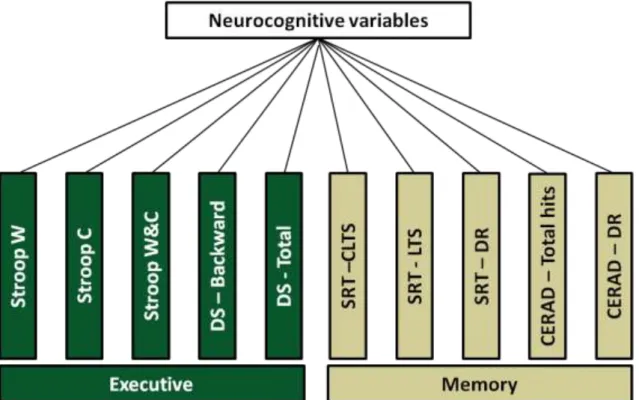
Figure 5 – Diagram of neurocognitive dimensions formation by PCA. ... 54
Figure 6 – Mean value of neurocognitive and neurpsychological variables/dimensions by gender. ... 56
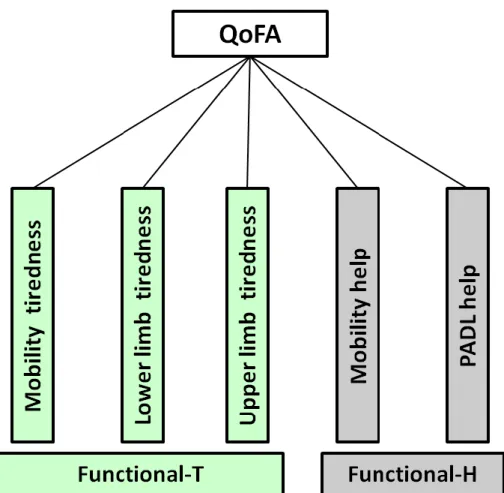
Figure 7 – Representation of functional dimension obtained by PCA. ... 57
Figure 8 – Distribution of functional dimensions by gender. ... 58
Figure 9 - Representation of hematological dimensions obtained by PCA. ... 59
Figure 10 – Distribution of hematological dimensions by gender. ... 60
Figure 11 – Distribution of neurocognitive/neuropsychological dimensions by iron status groups. ... 63
Figure 12 - Functional dimensions mean value by iron status groups. ... 63
Figure 13 - Hematological dimensions by iron status groups. ... 65
Figure 14 - Summary model for the correlation between memory dimension and hematological dimensions and associated beneficial and detrimental factors. ... 70
Figure 15 – Summary model for the correlation between depressive mood (GDS score) and hematological dimensions and associated beneficial and detrimental factors. ... 74
Figure 16 - Summary model for the correlation functional-T dimension and hematological dimensions and associated beneficial and detrimental factors. ... 76
Figure 17 - Summary model for the correlation between memory dimension and interaction of storage dimension with nutritional status (MNA) and associated beneficial and detrimental factors. ... 78
xvii
Abbreviations list
6MTW 6 meter timed walk
ABCB7 ATP-binding cassette, subfamily B, member 7
ACD Anemia of chronic disease
ACER Addenbrooke's cognitive examination-revised
ANCOVA Analysis of covariance
ATP Adenosine triphosphate
BAI Beck anxiety inventory
BDI Beck depression inventory
BF Body fat
BIA Bioelectrical impedance analysis
BMI Body mass index
BNT-15 Boston naming test 15-item version
C Colors
CCA-B Clinical academic center – Braga
CERAD Consortium to establish a registry for Alzheimer's disease
circ. Circumference
CLTR Consistent long term retrieval
Cog. Cognition
COWAT-FAS Controlled oral word association test F-A-S
CP Ceruloplasmin
DALY Disability adjusted life years
DASS-21 Depression, anxiety and stress scales – 21 items
DCYTB Duodenal cytochrome b
df Degrees of freedom
DMT1 Divalent metal transporter 1
DR Delayed recall
DS Digits spam
FAO Food and Agriculture Organization of the United Nations
Fe Serum iron
Fe2+ Ferrous iron
Fe3+ Ferric iron
Fe-S Iron-sulfur
FLVCR Feline leukemia virus subgroup C receptor
FPN Ferropotin
FT Ferritin
GDS Geriatric depression scale
H. pylori Helicobacter pylori
HCP1 Heme carrier protein 1
HIF Hypoxia inducible factor
HO Heme oxigenase
HP Hephaestin
hsCRP High sensitive C-reactive protein
xviii
IDA Iron deficiency anemia
IL-6 Interleukin-6
IRE Iron responsive element
IRP Iron responsive protein
Log Base ten logarithm
LTS Long term storage
MCH Mean cell hemoglobin
MCHC Mean cell hemoglobin concentration
MCV Mean corpuscular volume
MMSE Mini mental state examination
MNA Mini nutritional assessment
MOCA Montreal cognitive assessment
Na(Fe3+)EDTA Ethylenediaminetetraacetic acid ferric sodium salt
NHANES National health and nutrition examination survey
NSAID Nonsteroidal anti-inflammatory drug
OR Odds ratio
PCA Principal component analysis
PCFT Proton coupled folate transporter
POMA Performance oriented mobility assessment
PSS Perceived stress scale
QoFA Questionnaire of functional ability
RBC Red cells blood Count
RDW Red cell distribution width
SD Standard deviation
SE Standard error
SOP Standard operating procedures
SRT Selective reminding test
STEAP Six transmembrane epithelial antigen of the prostate
sTFr Soluble serum transferrin receptor
sTFr-LogFT Ratio of sTFR to the logarithmic value of ferritin
Supplem. Supplemented
TF Transferrin
TF sat. Transferrin saturation
TFR Transferrin receptor
TIBC Total iron binding capacity
W Words
W&C Words/colors
WAIS III Wechsler adult intelligence test
WHO World health organization
1
3
Iron is essential for several biochemical/biological processes. Namely, it is a component and cofactor of various enzymes, participating in oxygen transport and storage, mitochondrial electron transport, catecholamine metabolism and neurotransmitters and DNA synthesis, among others (J. L. Beard, Connor, & Jones, 1993; Hill, 1985; IOM, 2001; M. B. Youdim & Green, 1978). In normal conditions, healthy adults have approximately 35 to 45 mg of iron per kilogram of body weight (premenopausal females have lower iron stores due to recurrent menstrual blood losses), being more than two thirds incorporated in hemoglobin (Nancy C. Andrews, 1999). Imbalance in iron homeostasis, both excess and deficiency, are deleterious to human health and are associated with conditions such as hemochromatosis, neurodegenerative disorders (i.e. Parkinson and Alzheimer diseases), type II diabetes and anemia (Iron Deficiency Anemia – IDA) (Hentze, Muckenthaler, & Andrews, 2004; Jiang et al., 2004; Zecca, Youdim, Riederer, Connor, & Crichton, 2004; Zhao et al., 2012).
Paradoxically, although iron is one of the most abundant elements on the planet, iron deficiency is the most common nutritional deficiency (Boccio & Iyengar, 2003). While several causes can be present in the etiology of the disorder, it can, in general, be explained as an imbalance between iron intake, absorption and losses (Cook, 2005; Zimmermann & Hurrell, 2007). The inability to maintain, for a long period of time, adequate plasma iron levels and/or body iron stores, leads to iron deficiency (ID) anemia (IDA) (De Domenico, McVey Ward, & Kaplan, 2008), the most common hematological disorder (McLean, Cogswell, Egli, Wojdyla, & de Benoist, 2009; Mukhopadhyay & Mohanaruban, 2002). In fact, the World Health Organization (WHO) estimates that, worldwide, more individuals have IDA than any other health problem (Mathers, Fat, Boerma, & Organization, 2008; McLean et al., 2009). Although all age groups are vulnerable to ID, infants, adolescents, women of childbearing age or pregnant, and middle-aged/older individuals (defined as age ≥ 60 years) are particularly susceptible (De Benoist, Cogswell, Egli, & McLean, 2008; McLean et al., 2009; WHO, 2001). In adults, ID and IDA can result or be associated with a wide range of adverse effects, including: fatigue, reduced work performance, diminished exercise capacity, impaired thermoregulation, immune dysfunction, gastrointestinal disturbances, and neurocognitive impairment (Susan F. Clark, 2008; Haas & Brownlie, 2001; Zimmermann & Hurrell, 2007).
Of particular concern, the raise of life expectancy in the last century has led to an increase of the aged population worldwide (Christensen, Doblhammer, Rau, & Vaupel, 2009). Specifically, in the last 160 years women’s life expectancy has increased 3 months per year in an
4
almost linear trend, with the same trend observed for men, albeit at a slower pace (Oeppen & Vaupel, 2002). ‘Normal’ healthy aging is associated with a degree of cognitive decline, termed “age-related cognitive decline/aging” (defined as no dementia, mild cognitive impairment or other specific cognitive decline-associated syndromes/diseases), as well as with physical challenges and decrements (Beddington et al., 2008; Deary et al., 2009; Guralnik, Fried, & Salive, 1996; Janssen, Heymsfield, & Ross, 2002). Despite being indisputable that life expectancy increase should be celebrated, this current demographic and societal phenomenon will result in an increasing number of older individuals with various age-associated health concerns/problems and pathologies (including, for example, cancer, fractured hips, strokes, dementia), which may occur concurrently (that is, co- or multi-morbidities) (Rechel et al., 2013; The, 2012). Furthermore, aged individuals are also the largest consumers of prescribed drugs or medication (Qato et al., 2008), with age-associated disease burden and medication consumption accounting for significant health care needs, which is reflected by an increase in the expenditure of the health and welfare systems of nations (Rechel et al., 2013). Of relevant note, several morbidities and therapeutic drugs that are highly prevalent in older individuals are also possible causes of ID (see 1.2.1 – From basics to clinics) (Susan F. Clark, 2008).
Taken together, aging and ID can be deleterious for health and wellbeing, particularly in cognition and physical ability. Notably, however, extremely little focused research has been conducted in this population strata. A systematic review and meta-analysis found an increased risk of incident dementia in anemic individuals; however, the type of anemia was not addressed (Peters et al., 2008). Although anemia is used as an indicator of ID and the terms anemia, ID and IDA are used interchangeably, it should be noticed that anemia can also be caused by
vitamin B12 deficiency, which is a well-known cause of dementia (Reynolds, 2006; WHO, 2001).
Furthermore, physical functional ability in the elder has been associated with anemia (Chaves, 2008; Denny, Kuchibhatla, & Cohen, 2006; Penninx et al., 2003; Penninx et al., 2004; Mya Thein et al., 2009). Still, to the best of our knowledge no study has addressed associations with ID.
The growing older population and the potential reversibility, amelioration or prevention of the delirious effects of ID in cognition and physical functionality dictate the need of studies that multi-disciplinarily address and explore the association between iron status, cognitive ability and physical functional performance in middle-aged/older individuals.
5
1.1. Iron homeostasis
The physiology of iron metabolism has been known for more than a half a century, mostly by means of human and animal studies using iron isotopes. More recently, the discoveries of key molecules that are involved in intestinal iron absorption allowed a better understanding of this process at the molecular level (Frazer & Anderson, 2005; T. Ganz, 2008). Iron is a nutrient classified as an essential trace element with the ability to easily gain and loose
electrons (inter-conversion between ferric [Fe3+] and ferrous [Fe2+] forms) (De Domenico et al.,
2008; T. Ganz, 2008; Hentze et al., 2004). This chemical property of iron makes it an useful component of oxygen binding molecules, cytochromes and non-heme enzymes, largely explaining its biological importance, but also underlying the reasons for its deleterious and toxic effects when in excess (Hentze et al., 2004). Iron can catalyze a “fenton-type” redox reaction where the ferrous form interacts with hydrogen peroxide or lipid peroxidases originating free radicals (i.e. superoxide anions and the hydroxyl radical) that ‘attack’ and damage cellular membranes, nucleic acids and proteins (Nancy C. Andrews, 1999; Hentze et al., 2004). In humans, there is no known physiological regulated form to actively excrete iron, and since both iron overload and deficiency lead to several disorders, iron homeostasis must be tightly regulated via absorption and storage mechanisms (Nancy C. Andrews, 1999; De Domenico et al., 2008; Zimmermann & Hurrell, 2007). Daily, 1 to 2 mg of iron is absorbed from dietary sources, with similar amounts lost by epithelial cell shedding (skin, gastrointestinal and urinary tract cells) and fluids loses (menstruation, minor bleeding, tears and sweat) (T. Ganz, 2008; Miret, Simpson, & McKie, 2003). Despite of the small amounts that renew (and/or ‘recycle’) the iron pool, the erythron (all the erythrocyte, their precursors and organs involved in their production) has daily requirements of 20 to 30 mg (Nancy C. Andrews, 1999; Miret et al., 2003).
1.1.1. Iron absorption and metabolism
As mentioned, although 1 to 2 mg of iron are absorbed by enterocytes each day to compensate the losses, these amounts only represent a small portion of the body iron daily needs. The mean dietary intake of iron for an adult ranges from 12 to 18 mg/day, which is sufficient to meet the dietary reference allowance (8 mg/day for men and post-menopausal women and 18mg/day for pre-menopausal women) (IOM, 2001). Dietary iron can be divided in
6
two components: (i) heme iron (protoporfirin IX – from hemeproteins) and (ii) nonheme iron (dietary ferritin and iron salts and chelates). These have distinct bioavailabilities. Heme iron is found mainly in meat food sources and corresponds to up to 15% of the dietary iron, the remaining is nonheme iron which is found mainly in vegetable sources (Hallberg, 2001). Heme and nonheme iron are absorbed in the small intestine, where a gradient for absorption occurs, with higher rate at the duodenum and decreasing in the jejunum and in the ileum (De Domenico et al., 2008; Gibson, 2005; Miret et al., 2003). The enterocytes (polarized intestinal epithelial cells) are responsible for all iron absorption (Nancy C. Andrews, 1999). These cells, which derive from stem cells in the intestinal crypts (crypts of Lieberkuhn) and migrate up the villus, are characterized by an apical side (presenting the brush-border) and a basolateral side that are in contact with the intestinal lumen and the blood stream, respectively (Fuqua, Vulpe, & Anderson, 2012). Even though not all the processes involved in the intestinal iron absorption are clearly understood, it is know that absorption occurs through the transport across the apical membrane, translocation across the cytosol and release to the circulation through the basolateral membrane (De Domenico et al., 2008; Han, 2011). Heme and nonheme iron are absorbed by different mechanisms in an independent and not mutually exclusive manner (Nancy C. Andrews, 1999; Han, 2011; West & Oates, 2008), with much of what is known about iron absorption being limited to nonheme iron, despite of heme iron being far more efficiently absorbed and having outmost importance from the nutritional point of view (Miret et al., 2003; Wienk, Marx, & Beynen, 1999).
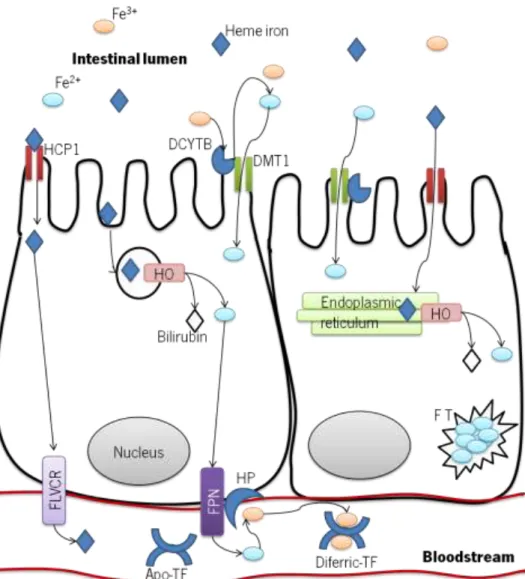
Evidence sustains two hypotheses for heme iron absorption: (i) iron binds to a receptor in the brush-border membrane of duodenal enterocytes and is translocated by endocitosys across the apical membrane, and (ii) iron is transported from the intestinal lumen to the cytoplasm of the enterocyte through the heme carrier protein 1/proton coupled folate transporter (HCP1/PCFT), whose physiological relevance is unclear (Figure 1) (Shayeghi et al., 2005; West & Oates, 2008; Zimmermann & Hurrell, 2007). Evidence also indicates that heme iron can, as well, be absorbed by receptor-mediated endocytosis, but a high-affinity receptor for heme iron has yet to be identified (Fuqua et al., 2012; West & Oates, 2008). Morphological studies using electron microscopy report the appearance of secondary lysosomes containing heme, in rats and dogs, upon administration of heme or hemoglobin close to the duodenal loops (West & Oates, 2008).
7
Absorption of dietary ferritin, a protein that binds inorganic iron, has begun to be recently more studied than all other nutritional forms of iron (E. C. Theil, 2004; Elizabeth C Theil, 2011). However, although there is some evidence that it is taken into the enterocyte by a phytate-resistent clathrin (receptor)-dependent endocytosis, mediated by a not yet identified high affinity receptor, the precise mechanism is unknown (Fuqua et al., 2012; Elizabeth C Theil, 2011). With exception for the dietary ferritin, nonheme iron is transported across the brush-border membrane via the divalent metal transporter 1 (DMT1) (Nancy C. Andrews, 1999; De Domenico et al., 2008; Miret et al., 2003; Zhang & Enns, 2009a, 2009b). The DMT1 co-transports hydrogen and
iron and, as the name indicates, iron must be in its ferrous state (Fe2+) (De Domenico et al.,
2008; Mackenzie & Garrick, 2005; Zhang & Enns, 2009b). Most of the dietary iron is present in
the intestinal lumen in the ferric form (Fe3+), so it must be reduced prior to transportion by a
brush-border ferric reductase. The duodenal cytochrome b (DCYTB) is a major reducing agent, but other reductases, such as the six transmembrane epithelial antigen of the prostate 2 (STEAP2), and ascorbic acid, also contribute (Nancy C. Andrews & Schmidt, 2007; Fuqua et al., 2012; T. Ganz, 2008; Han, 2011; Hentze et al., 2004; Zimmermann & Hurrell, 2007). Ascorbic acid can exert the effect of a reducing agent in itself or hypothetically act as a cofactor of the DCYTB (Mackenzie & Garrick, 2005; McKie et al., 2001).
Intestinal nonheme iron absorption can be affected by several factors that range from the physiologic status of the individual (discussed further ahead) to dietary factors. In fact, although it is now possible to shed light and/or explore several of the luminal aspects that affect iron absorption, the establishment of a quantitative model for it remains complex (Hallberg, 2001; Miret et al., 2003). Once iron is released from food components, ferric iron will remain soluble as long as the environment favors an acidic pH, which is not a problem in the stomach but can be at the intestinal lumen. The acidic microenvironment of the duodenal surface, along with the cell surface reductase activity from the DCYTB will maintain significant levels of soluble and ferrous iron (Miret et al., 2003). Furthermore, several luminal reactions can occur with food components or secreted molecules that will enhance or inhibit nonheme iron absorption. From the dietary components that affect iron absorption citric acid, ascorbic acid and some amino acids (e.g.: cysteine) will favor iron absorption either by maintaining iron soluble (citric acid) or by reducing ferric iron to ferrous iron (ascorbic acid and cysteine). On the contrary, the presence of phytate, polyphenols and tannic acid will result in the formation of complexes with iron (booth ferric and ferrous iron) and inhibit its absorption (Han, 2011). Calcium, copper and lead, due to absorptive
8
competition, are also involved in the inhibition of nonheme iron (Nancy C. Andrews, 1999; Pasricha et al., 2010). Furthermore, gastroferrin, a stomach glycoprotein, is probably an important iron absorption regulator by the formation of iron complexes; although, the direction of the regulation is still debatable (Miret et al., 2003). On the other hand, heme iron is far more bioavailable than nonheme iron and therefore its absorption is less affected by the external factors here addressed for nonheme iron (Han, 2011).
Figure 1 - Summary diagram of the established and putative iron absorption pathways in the intestinal enterocyte.
After entering the enterocyte, iron has two possible fates: (i) stored in ferritin (FT), or (ii) exported and reach circulation (Nancy C. Andrews, 1999). Again, there is some lack of knowledge regarding heme iron metabolism. It is known that it is absorbed, appearing in
9
membrane bound vesicles where it is degraded by heme oxigenase (HO), splitting it into bilirubin and ferrous iron. These will then enter the labile iron pool in the enterocyte, although the mechanism by which iron leaves the vesicle is unknown (Shayeghi et al., 2005; West & Oates, 2008). In support, it has been shown that 90% of the iron from radio-labeled hemoglobin administered via enteral route is recovered after 3 hours from the portal circulation as nonheme iron (West & Oates, 2008). This mechanism is plausible for the heme iron that enters the enterocyte by endocytosis. The heme iron that is thought to enter via the heme transporter HCP1/PCFT is still hypothetically considered to be exported via the feline leukemia virus subgroup C receptor (FLVCR), a cell surface protein capable of actively exporting heme. Nonetheless, no studies have yet determined the FLVCR function and localization in the enterocyte (Latunde-Dada, Simpson, & McKie, 2006; West & Oates, 2008).
With regard to nonheme iron more is known. After the uptake by the enterocyte it will either constitute, with the iron released from heme, the (i) intracellular labile iron pool (having a molecular nature that is not known but probably consists of low molecular weight chelates or chaperone proteins that bind to and transport iron) (Dunn, Suryo Rahmanto, & Richardson, 2007), or (ii) it can be stored in FT, a cytosolic iron-storage protein (De Domenico et al., 2008). Iron stored as FT will be lost with the senescent enterocytes and the iron from the enterocyte labile iron pool will be, if needed and possible, exported to the plasma through the basolateral membrane transporter ferropotin (FPN) where it will bind to plasma transferrin (TF) (De Domenico et al., 2008; R. E. Fleming & Ponka, 2012; Fuqua et al., 2012; Munoz, Garcia-Erce, & Remacha, 2011).
Ferropotin is the only iron exporter in the duodenal mucosa, macrophages and hepatocytes (De Domenico et al., 2008; Dunn et al., 2007; Zhang & Enns, 2009a). It is likely that FPN exports iron in the ferrous form; however, TF only binds ferric iron (Fuqua et al., 2012; Munoz et al., 2011). In the basolateral membrane, iron export through the FPN is dependent of hephaestin (HP), a ferroxidase that converts ferrous iron to ferric iron and allows it to bind to TF (Zhang & Enns, 2009a). While other cells rely on the circulating ferroxidase ceruloplasmin (CP) for iron oxidation, enterocyte FPN relies on the membrane-bounded paralog HP. Independently of the cell, the feroxidase activity is indispensable for the FPN, since without feroxidase activity FPN is internalized and degraded, preventing iron from being exported and leading to its accumulation in the cell, stored by the FT (De Domenico et al., 2008; Fuqua et al., 2012; Miret et al., 2003).
10
As previously mentioned, nearly all of the iron exported from the enterocyte is bound to TF, which can bind two molecules of ferric iron. This mechanism of iron chelation dampens the toxicity of the free iron and maintains iron in a soluble form. Under normal circumstances 20 to 30% of the circulating TF binds iron, which is ensured by the high binding affinity of TF to iron and the high concentration of apo-transferrin (apo-TF, iron free form of TF). TF is also responsible for delivering iron to the cells that express TF receptors (Nancy C. Andrews & Schmidt, 2007; De Domenico et al., 2008).
Several mechanisms have been identified to be involved in the cellular TF-dependent iron uptake. The ubiquitously expressed transferrin receptor 1 (TFR1) is the major vehicle for cellular iron uptake and is also the most well studied mechanism of internalization of the diferric-TF complex. Other cellular iron importers have been identified, including the transferrin receptor 2 (TFR2 – expressed in hepathocytes, erythroid cells and duodenal crypt cells) and cubilin (expressed in epithelial cells of the kidney)(Hentze et al., 2004; Hentze, Muckenthaler, Galy, & Camaschella, 2010; Sheftel, Mason, & Ponka, 2012). TFR1 is presented in the cell surface to the plasma as a dimer and binds two diferric-TF molecules. The complex formed by the differic-TF and TFR1 localizes in clathrin-coated pits that are endocytosed. A proton-pump acidifies the early endosome containing the diferric-TF/TFR1 complex, promoting conformational changes in both and releasing iron. Thereafter, the ferric iron released from the complex is reduced to ferrous iron by the ferriredutase STEAP3 and transported to the cytosol by DMT1 (Gkouvatsos, Papanikolaou, & Pantopoulos, 2012; Hentze et al., 2004; Sheftel et al., 2012; Zhang & Enns, 2009a). After the release of the ferric iron, the complex apo-TF/TFR1 returns to the cell surface, the apo-TF is released, and the cycle restarts (N. C. Andrews, 2008; Gkouvatsos et al., 2012; Mayle, Le, & Kamei, 2012).
Once iron enters the cell, the amount of iron that is not needed for immediate use is sequestered from the iron labile iron pool by FT (Hentze et al., 2004; Sheftel et al., 2012). The labile iron pool represents approximately 3 to 5 % of the cellular iron stores and is composed of iron associated to low molecular weight chelates (Gkouvatsos et al., 2012). FT is an heteropolymer of 24 subunits H (heavy or heart) and L (light or liver) types that can encapsulate up to 4500 iron atoms, solubilizing and maintaining them in a less reactive form. Iron stored in FT is readily available for cellular utilization. Thus, in addition to the storage function, FT also has enzymatic properties (oxidization of ferrous iron to ferric iron) (N. C. Andrews, 2008; Nancy C. Andrews & Schmidt, 2007; De Domenico et al., 2008; Hentze et al., 2004).
11
Intracellular iron can be directed to several sites (for example, to the nucleus, FT or the labile iron pool), but much of it is directed to the mitochondria where the synthesis of heme and iron-sulfur (Fe-S) clusters takes place. Despite of the great biological significance of this process, the mechanism responsible for the traffic of iron to the mitochondria remains unclear (Hentze et al., 2004; Napier, Ponka, & Richardson, 2005). Nonetheless, it is accepted that mitochondrial iron export requires Fe-S cluster biosynthesis. Fe-S clusters and heme are exported from the mitochondria by specific transporters; for Fe-S clusters these are postulated to be the ATP-binding cassette, subfamily B, member 7 (ABCB7) (Dunn et al., 2007; Napier et al., 2005). After being exported from the mitochondria, heme will be used for insertion in several proteins such as hemoglobin and cytochromes, although the mechanism for heme release from the mitochondria remains unclear (Dunn et al., 2007; Hentze et al., 2010; Munoz et al., 2011).
As previously mentioned, in normal conditions, 1 to 2 mg of iron are absorbed by enterocytes each day to compensate the losses, but these amounts only represent a small portion of the body iron daily needs. A total of 3000 to 5000 mg of iron can be present in a healthy adult. The erythron incorporates more than two thirds of the total body iron as hemoglobin; approximately 1800 mg of iron are incorporated in circulating erythrocytes and near 300 mg are present in the bone marrow and in erythroid precursors. Hemoglobin synthesis is responsible for nearly 80% of the iron demands in humans (20 to 25 mg/day) (Hentze et al., 2004; Zhang & Enns, 2009b). The amount of iron that is present in the erythron normally exceeds the iron that is present in iron-stores, which are mainly the hepatocytes (approximately 1000 mg) and the reticuloendothelial macrophages (estimated in nearly 600 mg). A small amount is also present in other cells and tissues, such as muscle cells (300 mg incorporated into myoglobin) and circulating bounded to TF (3 mg) (Nancy C. Andrews, 1999; T. Ganz, 2008; Hentze et al., 2004). The daily demands of iron are supported mainly by the macrophages in the liver and spleen, which phagocytize the senescent erythrocytes and recycle the iron. The iron in the hemoglobin is released, as previously mentioned, by the HO, and exported into circulation through FPN (relying on CP as a ferroxidase) or directly by the FLVCR (Donovan & Andrews, 2004; Munoz et al., 2011; Zhang & Enns, 2009a, 2009b). The circulating heme can be transported to the hepatocytes by the hemopexin and, subsequently, degraded for iron release (Zhang & Enns, 2009a).
12
Figure 2 – Adult iron distribution and daily whole body iron metabolism.
Since there is no known mechanism of iron excretion, a highly regulated mechanism of absorption and release from the stores is needed to maintain iron homeostasis at the cellular and systemic levels (Nancy C. Andrews, 1999; T. Ganz, 2008; Hentze et al., 2004). Still, the molecular basis of the complex homeostatic network has only recently been uncovered (T. Ganz, 2008; Simpson & McKie, 2009).
At a cellular level, iron homeostasis is maintained through transcriptional, translational and post-translational mechanisms. The messenger ribonucleic acid (RNA) of several iron related proteins has untranslated regions denoted as iron-responsive elements (IRE). The IREs are found in the 5’ untranslated region of the messenger RNA that encodes for FPN, TF chains, mitochondrial aconitase and erythroid 5-aminolevulinic acid synthase (enzyme of heme biosynthesis); whereas, the messenger RNA that encodes for TFR1 and DMT1 have IRE at the 3’ untranslated region. The cytosolic proteins iron-regulatory proteins (IRP) recognize and bind to IRE, exerting regulatory effects. The binding of IRP to the IRE in the 5’ untranslated regions precludes translation; while the formation of the IRP/IRE complex in 3’ untranslated regions
13
stabilizes the messenger RNA and prevents its degradation (De Domenico et al., 2008; Hentze et al., 2004). Two IRPs have been identified, IRP1 and IRP2, with share sequence homology but have different properties (N. C. Andrews, 2008). In iron-depleted cells the IRP binds to IRE, a process that does not happen in iron-replete cells (T. A. Rouault, 2006). This is possible due to the iron sensing properties of the IRPs. In the presence of high cellular iron levels, a Fe-S cluster will assemble in the IRP1 converting it to an aconitase, inhibiting the binding of IRP1 to IRE. On the contrary, in iron depleted cells the absence of the Fe-S cluster allows IRP1 to be in its RNA-binding form. The IRP2 does not contain the Fe-S cluster and seems to have lost the aconitase activity along the evolutionary process. While in depleted cells the IRP2 accumulates, in iron-replete cells it is targeted for degradation (N. C. Andrews, 2008; De Domenico et al., 2008; Hentze et al., 2004; T. A. Rouault, 2006). Iron cytosolic concentration is rapidly adjusted by the IRP/IRE regulatory system and the function of several iron-dependent components and processes is therefore optimized (T. A. Rouault, 2006).
At a systemic level several signals such as iron absorption (“mucosal block”), oxygen tension (hypoxia regulator), iron levels (stores regulator) and systemic iron needs (erythroid regulator) regulate iron absorption, storage and transfer (R. E. Fleming & Ponka, 2012; Hentze et al., 2004; Simpson & McKie, 2009). Circulating iron status is maintained at balanced levels by two main mechanisms: (i) absorption regulation, and (ii) regulation of release by the macrophages and hepatocytes (T. Ganz, 2008). In 1960, the hypothesis that a humoral substance was responsible for match iron absorption to the iron demands was put forward by Beutler et al. (Beutler & Buttenwieser, 1960). However, only in 2001 Nicolas et al. (Nicolas et al., 2001) demonstrated that hepcidin, the peptide sequenced in 1998 by Ganz and collaborators (Park, Valore, Waring, & Ganz, 2001), had an iron regulator function that made it a leading candidate for the long-sought iron-regulatory hormone (Robert E. Fleming & Sly, 2001). The small size of its gene, the lack of shared sequence motifs with other iron related genes and the rarity of mutations prevented the discovery of hepcidin by genetic methods, but several serendipitous events helped to bring hepcidin and its function to the knowledge of the scientific community (Tomas Ganz, 2011). Hepcidin, a 25 amino acid peptide hormone is the principal systemic regulator of intestinal iron absorption and iron efflux from macrophages. This hormone is primarily produced by the hepatocytes in the liver and in smaller amounts by other cell types upon cleavage of a pro-peptide hormone with 84 amino acids by the convertase furin. The biological action of hepcidin is exerted by its binding to FPN, which leads to FPN phosphorylation,
14
internalization and ubiquitin-mediated lysossomal degradation. Since FPN is the only exporter of iron from enterocytes, macrophages and hepatocytes, its degradation results in a decrease of the delivery of iron from the enterocytes and the reticulo-endothelial system to the plasma (N. C. Andrews, 2008; Fuqua et al., 2012; T. Ganz & Nemeth, 2006; Gkouvatsos et al., 2012). A similar mechanism has been recently proposed to occur at the barriers of the brain, in this case regulating iron delivery into the central nervous system (Marques et al., 2009).
Hepcidin is negatively regulated by iron (circulating and stores), erythropoietic needs, inflammation and hypoxia. (Tomas Ganz, 2011; Gkouvatsos et al., 2012). Specific conditions, such as inflammation, are potent suppressors of iron absorption by enterocytes and release by macrophages. There is evidence that this effect is mediated by hepcidin since inflammatory cytokines, with special emphasis on IL-6, activate hepcidin expression. This mechanism is the major contributor to the anemia of chronic disease (ACD – also called anemia of chronic inflammation) (T. Ganz & Nemeth, 2006; Hentze et al., 2010). Iron absorption is regulated in several different manners, being the iron from diet the first regulator. After the ingestion of a significant amount of dietary iron, the enterocyte becomes refractory to iron absorption. This phenomena, so-termed “mucosal block”, probably results from an accumulation of intracellular iron that will change the levels of DMT1 and DCYTB, which will prevent further iron uptake (Nancy C. Andrews, 1999; De Domenico et al., 2008). Iron absorption is also regulated in cases of normoxia and hypoxia by the hypoxia inducible factor (HIF), a nuclear transcription factor first described as the major oxygen regulated transcription factor through the control of erythropoietin expression and, therefore, of oxygen supply to red cell production (Simpson & McKie, 2009). HIF is also described to regulate Hepcidin expression. Recently, compelling data has indicated that DCYTB, DMT1 and possibly FPN genes, which are highly up regulated in hypoxia and iron deficiency, are also HIF-2α dependent for expression (Mastrogiannaki et al., 2009; Shah, Matsubara, Ito, Yim, & Gonzalez, 2009). (Nancy C. Andrews, 1999; Han, 2011).
In summary, iron homeostasis is a very highly regulated process for which several pathways and molecular players participate.
15
1.1.2. Assessment of iron status
Bone marrow
Bone marrow grading is the gold standard for iron deficiency assessment and provides the definitive diagnosis. The major limitations of this method are the high invasiveness, cost (expensive) and pain incurred by the assessment procedure. Therefore, bone marrow aspiration is rarely performed and alternative sensitive and less invasive tests are used (Fairweather-Tait, Wawer, Gillings, Jennings, & Myint, 2013; Gale, Torrance, & Bothwell, 1963; G. H. Guyatt et al., 1992; Raiten et al., 2011; Rimon, Levy, Sapir, & et al., 2002).
Hemoglobin
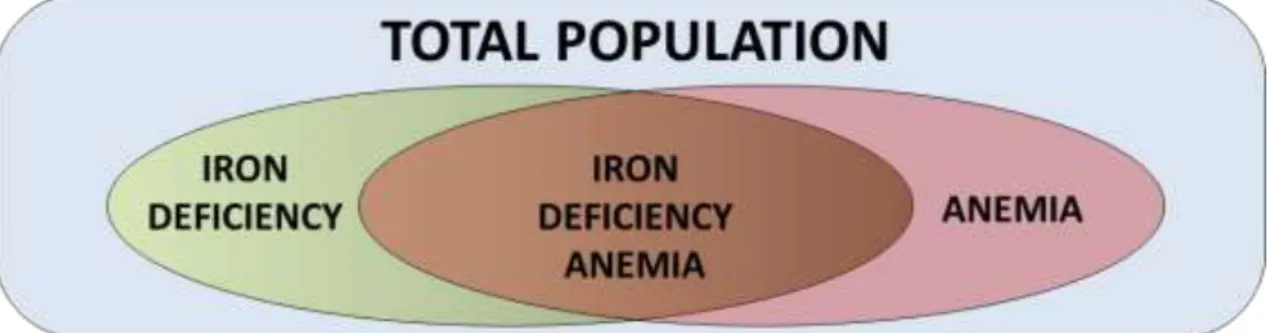
The assessment of the prevalence of ID in developed countries is commonly obtained from representative samples with specific indicators of iron status, such as serum FT, TF saturation and free erythrocyte protoporphyrin; whereas, estimates from developing countries are commonly based in hemoglobin measurements (Zimmermann & Hurrell, 2007). Iron homeostasis is a continuum that ranges from iron overload to iron depletion being ID and IDA intermediate states (Figure 3), (WHO, 2001).
Figure 3 - Conceptual diagram of the relationship between iron deficiency and/or anemia in a hypothetical population. Adapted from WHO (2001).
Despite of the low sensitivity and specificity of hemoglobin as an indicator of ID, its levels are commonly used in surveys of anemia (of all causes) (Lynch, 2010). Nevertheless, anemia (of all causes) surveys for assessment of ID are inadequate since they do not properly correlate with each other, which may justify the limited success of public health programs based on hemoglobin levels (Cook, Flowers, & Skikne, 2003; Mei et al., 2005). Underlying this may be that anemia has multiple precipitating factors in addition to iron deficiency, such as genetic disorders,
16
infectious diseases and other nutritional deficiencies (McLean et al., 2009; Pang & Schrier, 2012; Patel, 2008), which may differ between places. Therefore, anemia, IDA and ID are commonly, although not correctly, used as synonymous. Despite this, the overall prevalence of ID is estimated to be equal to the prevalence of anemia (of all causes), since it is assumed that IDA represents 50% of all anemias and the prevalence of ID alone is considered equal to that of IDA (Susan F Clark, 2009; De Benoist et al., 2008; Lynch, 2010; McLean et al., 2009). As previously mentioned, the assessment of iron status in developing countries is mainly preformed using hemoglobin measurements and anemia as a proxy; accordingly, it is thus stated that iron deficiency is the main cause of anemia in underprivileged environments (WHO, 2001).
Inadequate supply of iron to the erythroid marrow over time will lead to an inadequate support for optimal erythropoiesis in the developing red cell mass, which will reduce hemoglobin concentrations to below-optimal levels and, consequently, cause anemia (Bainton & Finch, 1964). Specifically, the WHO classifies hemoglobin values under 12 and 13 g/dL for adult non-pregnant women and adult males, respectively, as defining anemia. These values were defined as under two standard deviations (-2SD) of the distribution mean for hemoglobin in a normal population of the same gender and age living at the sea level. As such, anemia definition is largely a statistical definition rather than a physiological definition (WHO, 2001). It also important to note that a hemoglobin value overlap can occur between persons with iron deficiency and normal non-anemic individuals. Taking into account all the limitations of hemoglobin levels (or anemia cutoff points) for ID assessment it is clear that hemoglobin should not be used as a stand-alone indicator (Gibson, 2005).
Hematocrit and red cell indices
Hematocrit (or packaged cell volume) and red cells indices are often used for differential diagnosis of anemia, which include also iron deficiency anemia. Hematocrit, along with hemoglobin, is used for anemia diagnosis. In cases of early ID a nearly normal hematocrit value can be observed; whereas, in cases of mild to severe ID, both hemoglobin and hematocrit are below the threshold of normality. Several limitations are described for hematocrit use in ID determination. Briefly, hematocrit falling only occurs in a later stage of ID, thus resulting in poor sensitivity. Furthermore, the same factors that affect hemoglobin also affect hematocrit, so lower values of hematocrit can be observed due to causes other than ID, resulting in a poor specificity, and several internal and external factors can affect its value resulting in poor precision. Cutoff
17
points for hematocrit values are also defined; however, and similarly to hemoglobin, they do not specifically identify iron deficient individuals (Gibson, 2005).
Red cell indices are calculated with the values measured for hemoglobin, hematocrit and red cells blood Count (RBC) and include mean corpuscular volume (MCV), mean cell hemoglobin (MCH), mean cell hemoglobin concentration (MCHC) and red cell distribution width (RDW). MCV
can be manually calculated as the hematocrit (volume fraction) divided by the RBC (1012/L) and
therefore is a measure of the average size of red blood cells (expressed in femtoliters – fL). In iron deficiency, red cells can be small (microcytosis). However, other nutritional disorders can
also affect MCV such as vitamin B12 and folic acid deficiencies (both causing abnormal large cells
- macrocytosis) and vitamin B6 (also causing small red blood cells). The ratio of hemoglobin (g/L)
to RBC defines the MCH and is expressed in picograms (pg). Changes in MCH occur in the same
direction as MCV either in iron deficiency or in vitamin B12 and folic acid deficiencies. MCHC can
be obtained dividing the hemoglobin by hematocrit and is a measure of the mean hemoglobin amount in each red blood cell. This is the red cell index less affected by age; nonetheless, it is also the least useful for iron deficiency identification because it is the last value to fall. RDW is a measure of the variation of size in red cells and is usually increased in iron deficiency. Again, alterations in RDW can occur in several pathologies and nutritional deficiencies, so RDW is also not a specific indicator of iron deficiency (Gibson, 2005).
Serum iron, total iron binding capacity and transferrin saturation
In the fasting state serum iron levels reflect the migration of iron to bone marrow from the reticulo-endothelial system indicating the iron supply adequacy for erythropoiesis (Fairweather-Tait et al., 2013; Gibson, 2005). Reliability of serum iron is questionable since it is affected by diurnal rhythms, ingestion of iron and inflammatory states (Fairweather-Tait et al., 2013). A useful indicator used for iron deficiency diagnosis is the total iron binding capacity (TIBC), which reflects the amount of serum iron binding sites that are not occupied. TIBC is increased early in iron deficiency (even before iron-deficient supply for erythropoiesis) as a result of the increase in TF production needed for higher iron transport and uptake. TF saturation is calculated from serum iron and TIBC [as follows: serum iron (µg/dL) / TIBC (µg/dL)] and, similarly to serum iron, is a measure of iron supply to erythropoietic tissues (Fairweather-Tait et al., 2013; Gibson, 2005).
18 Serum ferritin
Tissue ferritin is an intracellular protein involved in iron storage. Serum ferritin is slightly different than tissue ferritin and contains little or no iron (Worwood, 1990). Serum FT function in the serum is unknown, however it seems to be released from the reticulo-endothelial system (Gibson, 2005). Serum FT is the only iron status indicator that can be used to identify normal, deficient and excessive iron status because its concentration is closely related to body iron storage (1 µg/L of serum FT correspond to 8-10 mg of iron stored). Despite of this close correlation, when iron stores are depleted serum FT remain low but no longer directly reflects the severity of tissue iron deficiency (Gibson, 2005; Raiten et al., 2011; Zhu, Kaneshiro, & Kaunitz, 2010). This is also considered to be the single best laboratory test for the diagnosis of iron deficiency since its predictive value is of 0.95 (G. H. Guyatt et al., 1992; Zhu et al., 2010). Due to its high predictive value, simple cutoff points have been established for iron deficiency diagnosis: values lower than 15 µg/L define iron deficiency, while values higher than 100 µg/L rule out iron deficiency and the intermediate values need further investigation (G. H. Guyatt et al., 1992). However, serum FT is influenced by age and is also an acute phase protein and, thus, in case of inflammation serum FT should not be used as an iron status marker (Fairweather-Tait et al., 2013; Raiten et al., 2011; Zhu et al., 2010). For older individuals values lower than 45 µg/L should be used for iron deficiency diagnosis (Gordon H Guyatt et al., 1990). A cutoff point of 30 µg/L for the general population is usually used in the majority of the diagnostic studies of iron deficiency (Johnson-Wimbley & Graham, 2011).
Soluble serum transferrin receptors
As previously described, when an insufficiency of intracellular iron occurs, the expression of TFR-1 on the cell surface is up-regulated and allows for a higher iron uptake. In human serum the concentration of the soluble serum TFR (sTFR), a soluble form of the transmembrane TFR, is proportional to the expression of TFR (Gibson, 2005), rendering it possible to use sTFR as marker of iron deficiency and erythropoietic activity (Fairweather-Tait et al., 2013). Bone marrow erythroid precursors are the main source (75 to 80%) of sTFR and, unlike serum ferritin, sTFR levels are not affected by age or inflammatory conditions (Susan F Clark, 2009; R. Stewart & Hirani, 2012; Zhu et al., 2010). Despite of the usefulness and reliability of sTFR, the assay is not standardized, is expensive and not widely available, which prevents its clinical application (Choi et
19
consequently sTFR concentrations, confounding the interpretation of the assay for iron status assessment (Gibson, 2005).
Ratios and algorithms
The ratio of sTFR to the logarithmic value of ferritin (sTFR – Log(FT) ratio) is also considered a good indicator for the diagnosis of iron deficiency, especially in cases where iron deficiency occurs in combination with other morbidities that elicit an acute phase reaction (for example, elevation of C-reactive protein) (Susan F Clark, 2009; Punnonen, Irjala, & Rajamaki, 1997).
The Cook algorithm (Cook et al., 2003) for body iron calculation (body iron (mg/kg) = -[log(sTFR*1000/serum FT) – 2.8229/0.1207]) is an index for iron status alterations. It is relatively new and can be used as an epidemiological measure for monitoring populations where inflammation has been excluded or is rare, and it can also be used as a measure of effectiveness in intervention studies (Fairweather-Tait et al., 2013).
Use of multiple indicators of iron status
Indicators of iron deficiency have limitations and the use of a single measurement can lead to an erroneous classification of the iron status due to the overlap of normal and abnormal values of the measurement depending on the confounding factors (e.g.: age, inflammatory states or nutritional deficiencies). Thus, the use of multiple indices can be a more reliable alternative to identify abnormalities of iron metabolism. Usually, a combination of three indicators is used and abnormal values for at least two rules in iron deficiency (Gibson, 2005). However, due to the high predictive value, low values of ferritin have been used as a single indicator for iron deficiency in the absence of inflammation (G. H. Guyatt et al., 1992; Raiten et al., 2011; Rimon et al., 2005). Furthermore, serum ferritin concentration is the most powerful test for iron deficiency (Goddard, McIntyre, & Scott, 2000). Table 1 provides a summary of the principal indices used for iron assessment, the normal values and the cutoff points for iron deficiency.