Re latio n o f the disaccharidase s in
the sm all inte stine o f the rat to the
de gre e o f e xpe rim e ntally induce d
iro n-de ficie ncy ane m ia
Departamento de Puericultura e Pediatria, Faculdade de Medicina de Ribeirão Preto, Universidade de São Paulo, Ribeirão Preto, SP, Brasil
M.R. Vieira, L.C. Galvão and M.I.M. Fernandes
Abstract
Hypolactasia associated with severe iron-deficiency anemia has been reported in several studies. The objective of the present study was to determine whether hypolactasia is associated with the degree and duration of iron-deficiency anemia. Newly weaned male Wistar rats were divided into a control group receiving a diet supplemented with iron (C) and an experimental group (E) receiving a diet not supple-mented with iron (iron-deficiency diet). The animals were studied on the 3rd, 5th, 7th, 14th, 21st, 28th and 35th days of the experiment, when overall and iron nutritional status and disaccharidase activity in the small intestine were determined by the Dahlqvist method. A reduction in weight occurred in the anemic animals starting on the 5th day of the study. Anemia was present in the experimental animals, with a progressive worsening up to the 14th day (hemoglobin: C = 13.27 and E = 5.37) and stabilizing thereafter. Saccharase and maltase activities did not differ significantly between groups, whereas lactase showed a significant reduction in total (TA) and specific activity (SA) in the anemic animals starting on the 21st day of the study. Median lactase TA for the C and E groups was 2.27 and 1.25 U on the 21st day, 2.87 and 1.88 U on the 28th day, and 4.20 and 1.59 U on the 35th day, respectively. Median lactase SA was 0.31 and 0.20 U/g wet weight on the 21st day, 0.39 and 0.24 U/g wet weight on the 28th day, and 0.42 and 0.23 U/g wet weight on the 35th day, respectively. These findings suggest a relationship between the enzymatic alterations observed and both the degree and duration of the anemic process. Analysis of other studies on intestinal disaccharidases in anemia suggests that the mechanism of these changes may be functional, i.e., that the entero-cytes may suffer a reduction in their ability to synthesize these enzymes.
Co rre spo nde nce
L.C. Galvão
Departamento de Puericultura e Pediatria, FMRP, USP Av. Bandeirantes, 3900 14049-900 Ribeirão Preto, SP Brasil
E-mail: lcgalvao@ fmrp.usp.br
Publication supported by FAPESP.
Received July 14, 1999 Accepted February 8, 2000
Ke y wo rds
·Disaccharidases
·Lactase
·Anemia
·Iron deficiency
·Intestinal mucosa
Intro ductio n
Iron-deficiency anemia is the most com-mon nutritional deficiency in the world. One billion people are estimated to carry this deficiency (1,2). In Brazil, Monteiro and
iron-defi-ciency anemia, such as changes in physical growth and impairment of cognitive func-tions and of the immune response (4-7).
Some studies have demonstrated alter-ations in intestinal disaccharidase levels as-sociated with iron-deficiency anemia. Hoffbrand and Broitman (8), in a study of puppy dogs submitted to chronic iron defi-ciency, detected a significant reduction in lactase, maltase and saccharase in the intes-tinal mucosa of these animals.
Sriratanaban and Thayer (9) studied di-saccharidase activity in iron and protein nu-tritional deficiency in rats fed an iron-defi-cient diet, a protein-defiiron-defi-cient diet and a com-bination of the iron- and protein-deficient diets. Their results showed that the animals fed the iron-deficient diet presented a reduc-tion in disaccharidase activity without any histological changes, whereas the animals fed the protein-deficient diet alone or in association with iron did not present a defi-ciency in these enzymes.
Lanzkowsky et al. (10) also found a re-duction in disaccharidase levels in anemic rats. These investigators also studied disac-charidase levels in 10 children with severe iron-deficiency anemia. In biopsies taken from these patients, they observed that all presented a reduced disaccharidase activity (11). Although the methodology used does not permit reaching definitive conclusions, this may be an important problem in anemic children with diarrhea.
Fernandes et al. (12) studied disacchari-dase levels and cell proliferation in the small intestine of rats with iron-deficiency anemia and observed that the animals fed an iron-deficient diet presented a reduction in total and specific lactase activity. Maltase and saccharase concentrations remained un-changed and cell proliferation did not differ between the anemic and control groups.
There are no studies on disaccharidase concentrations during the course of anemia and the available reports always refer to severe anemia. Thus, the objective of the
present investigation was to study the rela-tionship between disaccharidase deficiency and the degree and duration of anemia.
Mate rial and Me tho ds
A total of 84 male Wistar rats were used immediately after weaning (21 days) and studied for a period of 35 days. On the first day of the study the animals were weighed and submitted to capillary blood collection for the determination of hematocrit and he-moglobin. The animals were then placed in individual stainless steel cages with glass feeders and drinking water containers previ-ously washed with a 10% nitric acid solution and rinsed with deionized water.
The rats were divided into two groups of 42 animals each, control and experimental, respectively receiving ration supplemented or not with iron. Basal casein ration was prepared according to the norms of the Asso-ciation of Official Chemists, modified by Fritz et al. (13). The amount of iron added to the diet for the control group was 179.2 mg ferrous sulfate per kg ration, corresponding to 36 mg of iron. No iron was added to the diet for the experimental group. Ration was changed and the cages, feeders and drinking containers were washed daily at the same time of day. Both groups had free access to ration and to deionized water.
Four to six animals in each group were sacrificed on the 3rd, 5th, 7th, 14th, 21st, 28th and 35th day of the study. The animals were weighed and anesthetized with ether and capillary blood was collected for the determination of hematocrit and hemoglo-bin, and blood was collected by cardiac punc-ture for the determination of serum iron and total iron-binding capacity (TIBC) by the method of Ramsay (14).
tissue homogenizer, with about 1.0 ml physi-ological saline. The homogenate was diluted with predetermined amounts of physiologi-cal saline according to intestinal weight and used for the determination of intestinal di-saccharidases by the method of Dahlqvist (15).
Enzymatic activity is reported as units and one unit was defined as the amount of enzyme hydrolyzing 1 µmol of the disaccha-ride in 1 min at 37oC. Total disaccharidase
activity was considered to be that obtained in the entire intestine, and specific activity was considered to be that calculated as units/g wet weight of small intestine.
Statistical analysis
Data were analyzed statistically by the nonparametric Mann-Whitney U-test, with the level of significance set at 5% (16).
Re sults
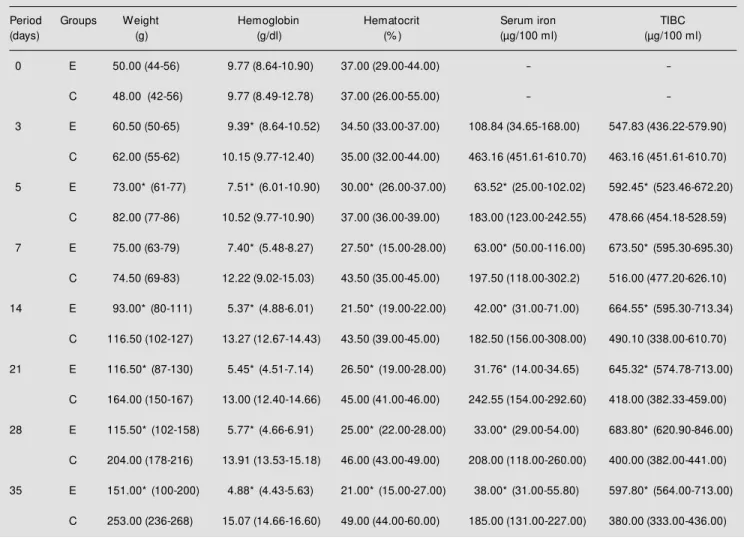
Table 1 presents the weight, hematocrit and hemoglobin determined for each group during the experiment. It can be seen that there were no differences between groups in these parameters at the beginning of the study, a fact demonstrating the homogeneity of the groups studied in terms of overall and iron nutritional status. Statistical analysis showed differences between groups on the 5th, 14th, 21st, 28th and 35th days of the study. Table 1 shows the values of hemoglo-bin, hematocrit, serum iron and TIBC for the two groups. The differences were significant for hemoglobin starting on the 3rd day and for the remaining parameters starting on the 5th day, with these values remaining un-changed thereafter.
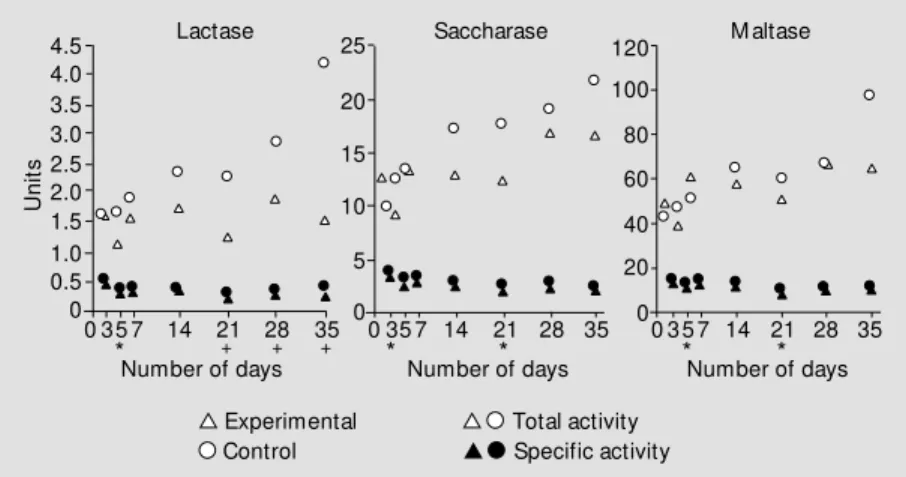
Figure 1 presents the median for the total and specific activities of lactase, saccharase and maltase. Significant differences between groups were observed only on the 5th and 21st day of the study for total saccharase activity, whereas specific activity was
simi-lar in the two groups. Although it appears from Figure 1 that the total activities of these enzymes were different on days 14 and 35, statistical analysis did not show a significant difference (P = 0.57 and P = 0.21, respec-tively).
Significant differences between groups were observed on the 3rd and 21st days of the study for total maltase activity, whereas specific activity was similar in the two groups. Again, a difference between groups appeared to be present on the 35th day but the level of significance was 0.22.
Lactase was the enzyme whose activity underwent an important and prolonged re-duction in the anemic group compared to the control. Statistical analysis showed that the differences were significant starting on the 21st day for both activities.
D iscussio n
Hemoglobin levels were significantly lower in the experimental group starting on the 3rd day of the study, whereas the other parameters (hematocrit, serum iron and TIBC) became altered on the 5th day. Since hemoglobin is known to be the most ad-equate of these parameters for the diagnosis of iron-deficiency anemia (17,18), we used this parameter to define the presence or ab-sence of anemia in the experimental group compared to control.
The differences in saccharase and mal-tase activity observed on certain days did not persist throughout the experiment, a fact that impairs the interpretation of these findings. We believe that this fact was due to the wide amplitude of variation of the results obtained. An increased sample size would be neces-sary to solve this problem. The same com-ment can be made with respect to the differ-ence in total lactase activity observed only on the 5th day.
Sriratana-ban and Thayer (9) and Lanzkowsky et al. (10) also detected a reduction in saccharase and maltase levels, a fact that did not occur in the present study. This difference may be explained by the fact that in the present study the animals were submitted to shorter peri-ods of anemia. Indeed, the first of the two cited studies used rats born to anemic dams and suckled by these dams and submitted to an iron-poor diet for 75 to 185 days. Lanzkowsky et al. (10), in turn, detected differences in the 3 disaccharidases when they studied animals from the 21st to the 84th day of life, i.e., over a period of 9 weeks. Fernandes et al. (12) studied
disac-charidase levels and cell proliferation in the small intestine of rats with iron-deficiency anemia also over a period of 5 weeks and detected a marked reduction in total and specific lactase activity and normal maltase and saccharase activity, in agreement with the present findings. The impression that there were differences in total activity be-tween saccharase and maltase on the 35th day supports the hypothesis that a longer period of study would probably show differ-ences also in the levels of these two en-zymes.
In an attempt to relate changes in lactase to anemia level we observed that indeed
Table 1 - M edian and range (betw een parentheses) of animal w eight, hemoglobin and hematocrit, serum iron and total iron-binding capacity (TIBC) for the experimental (E) and control (C) animals.
* P<0.05 compared to control (M ann-Whitney U-test).
Period Groups Weight Hemoglobin Hematocrit Serum iron TIBC
(days) (g) (g/dl) (% ) (µg/100 ml) (µg/100 ml)
0 E 50.00 (44-56) 9.77 (8.64-10.90) 37.00 (29.00-44.00) -
-C 48.00 (42-56) 9.77 (8.49-12.78) 37.00 (26.00-55.00) -
-3 E 60.50 (50-65) 9.39* (8.64-10.52) 34.50 (33.00-37.00) 108.84 (34.65-168.00) 547.83 (436.22-579.90)
C 62.00 (55-62) 10.15 (9.77-12.40) 35.00 (32.00-44.00) 463.16 (451.61-610.70) 463.16 (451.61-610.70)
5 E 73.00* (61-77) 7.51* (6.01-10.90) 30.00* (26.00-37.00) 63.52* (25.00-102.02) 592.45* (523.46-672.20)
C 82.00 (77-86) 10.52 (9.77-10.90) 37.00 (36.00-39.00) 183.00 (123.00-242.55) 478.66 (454.18-528.59)
7 E 75.00 (63-79) 7.40* (5.48-8.27) 27.50* (15.00-28.00) 63.00* (50.00-116.00) 673.50* (595.30-695.30)
C 74.50 (69-83) 12.22 (9.02-15.03) 43.50 (35.00-45.00) 197.50 (118.00-302.2) 516.00 (477.20-626.10)
14 E 93.00* (80-111) 5.37* (4.88-6.01) 21.50* (19.00-22.00) 42.00* (31.00-71.00) 664.55* (595.30-713.34)
C 116.50 (102-127) 13.27 (12.67-14.43) 43.50 (39.00-45.00) 182.50 (156.00-308.00) 490.10 (338.00-610.70)
21 E 116.50* (87-130) 5.45* (4.51-7.14) 26.50* (19.00-28.00) 31.76* (14.00-34.65) 645.32* (574.78-713.00)
C 164.00 (150-167) 13.00 (12.40-14.66) 45.00 (41.00-46.00) 242.55 (154.00-292.60) 418.00 (382.33-459.00)
28 E 115.50* (102-158) 5.77* (4.66-6.91) 25.00* (22.00-28.00) 33.00* (29.00-54.00) 683.80* (620.90-846.00)
C 204.00 (178-216) 13.91 (13.53-15.18) 46.00 (43.00-49.00) 208.00 (118.00-260.00) 400.00 (382.00-441.00)
35 E 151.00* (100-200) 4.88* (4.43-5.63) 21.00* (15.00-27.00) 38.00* (31.00-55.80) 597.80* (564.00-713.00)
there was a relationship since anemia in-creased in intensity during the experiment, with the onset of differences in lactase activ-ity, as shown in Table 1 and Figure 1. Thus, we may infer that these enzymatic changes may not be present in mild and moderate anemia. Since we know that the iron-defi-ciency anemia commonly occurring in the pediatric population manifests in most cases as mild and moderate disease, it would be precipitated to consider these children to have hypolactasia. This possibility should be considered only in cases of severe anemia. However, the duration of the process also seems to have been an important factor for this reduction since the degree of anemia was already quite marked on the 14th day (median hemoglobin <7), with little varia-tion until the end of the experiment, and the differences in lactase appeared on the 21st day, i.e., they occurred after anemia had worsened. For a better interpretation of this result it would be interesting to study ani-mals kept in a condition of mild and/or mod-erate anemia for a longer period of time.
Despite the significant difference in weight between animals on the 5th day, it was only after the 14th day that this differ-ence was clearly detectable and persistent (Figure 1). This finding of weight deficiency associated with iron-deficiency anemia co-incides with observations reported in the literature. Some investigators (19-21) have commented about the difficulty in determin-ing whether the low weight gain associated with anemia is a consequence of anorexia, of DNA disorders or of disturbances in RNA synthesis, or of the functional changes in the small intestine which cause nutrient malab-sorption. In our study, even though we did not quantify the amount of food ingested, we observed that the animals in the experimen-tal group ate less than those in the control group. This weight reduction in anemic ani-mals may reflect malnutrition as a possible cause of these differences in lactase activity. The malnutrition obtained in these animals
was of the global type since it was not ac-companied by changes in protein or albumin levels in blood (data not shown). Most stud-ies of malnutrition and anemia in rats have demonstrated the absence of changes in di-saccharidases in this type of nutritional dis-order, with increased specific activity hav-ing indeed been reported (22). Furthermore, Fernandes et al. (12), using a similar meth-odology, observed the same phenomenon of malnutrition associated with anemia. In this study, anemic animals were allowed to re-cover from anemia and their lactase levels became normal without a reduction or disap-pearance of the difference in weight be-tween the experimental and control animals. The mechanism of this enzyme deficiency observed in iron-deficiency anemia has not been fully elucidated. Fernandes et al. (12) found no differences in small intestinal cell proliferation between anemic rats and con-trols, a fact suggesting the absence of mor-phological changes associated with this defi-ciency. Dallman et al. (23) detected cyto-chrome C deficiency in the intestine of rats with iron-deficiency anemia, a fact leading to the hypothesis of functional alterations of enterocytes in these animals. Supporting this idea, Buts et al. (24), using electron micros-copy and kinetic studies of the small
intes-Figure 1 - M edian total and specific lactase, saccharase and maltase activities in experimen-tal and control animals on the 3rd, 5th, 7th, 14th, 21st, 28th and 35th days of the experiment. * P<0.05 w hen total activity w as compared (M ann-Whitney U-test); +P<0.05 w hen total and specific activities w ere compared (M ann-Whitney U-test).
U
n
it
s
4.5 4.0 3.5 3.0 2.5 2.0 1.5 1.0 0.5 0
25
20
15
10
5
0
120
100
80
60
40
20
0
0 35 7 14 21 28 35
Number of days
0 35 7 14 21 28 35
Number of days
0 3 5 7 14 21 28 35
Number of days
Experimental Control
Total activity Specific activity
Lactase Saccharase M altase
tine of anemic animals with disaccharidase deficiency, detected changes in the secretory components of enterocytes with no altera-tion of erythrocyte membrane morphology, i.e., the ability of enterocytes to synthesize these enzymes may be reduced.
Ackno wle dgm e nts
We wish to thank Ms. Aparecida Marti-nelli Gonçalves for valuable technical assis-tance throughout the experiment.
Re fe re nce s
1. Dallman PR, Simes M A & Stekel A (1980). Iron deficiency in infancy and childhood. American Journal of Clinical Nutrition, 33: 86-118.
2. Lönnerdal B & Dew ey KG (1996). Epide-miologia da deficiência de ferro no lacten-te e na criança. Anais Nestlé, 52: 11-17. 3. M onteiro CA & Szarfarc SC (1987). Estudo
das condições de saúde das crianças no município de São Paulo, SP (Brasil), 1984-1985. Revista de Saúde Pública, 21: 255-260.
4. Soemantri AG, Pollitt E & Kim I (1985). Iron deficiency anemia and educational achievement. American Journal of Clini-cal Nutrition, 42: 1221-1228.
5. Oski FA (1993). Iron deficiency in infancy and childhood. New England Journal of M edicine, 329: 190-193.
6. Chw ang L, Soemantri AG & Pollitt E (1998). Iron supplementation and physical grow th of rural Indonesian children. A-merican Journal of Clinical Nutrition, 47: 496-501.
7. Thibault H, Galan P, Selz F, Prezioli P, Badoual J & Hercberg S (1993). The im-mune response in iron-deficiency young children: effect of iron supplementation on cell-m ediated im m unity. European Journal of Pediatrics, 152: 120-124. 8. Hoffbrand AV & Broitman SA (1969).
Ef-fect of chronic nutritional iron deficiency on the small intestine disaccharidase ac-tivities of grow ing dogs. Proceedings of the Society for Experimental Biology and M edicine, 130: 595-598.
9. Sriratanaban A & Thayer WR (1971). Small intestinal disaccharidase activities in ex-perimental iron and protein deficiency. American Journal of Clinical Nutrition, 24: 411-415.
10. Lanzkow sky P, Karayalcin G & M iller F (1982). Disaccharidase levels in iron defi-cient rats at birth and during the nursing and postw eaning periods: response to iron treatment. Pediatric Research, 16: 318-323.
11. Lanzkow sky P, Karayalcin G, M iller F & Lane BP (1981). Disaccharidase values in iron deficient infants. Journal of Pediat-rics, 99: 605-608.
12. Fernandes M IM , Galvão LC, Bertolozzi M F, Oliveira WP, Zucoloto S & Bianchi M LP (1997). Disaccharidase levels in nor-mal epithelium of the snor-mall intestine of rats w ith iron deficiency anemia. Brazilian Journal of M edical and Biological Re-search, 30: 849-854.
13. Fritz JC, Pla GW, Harrison BN, Clark GA & Smith EA (1978). Vitamins and other nu-trients. Journal of the Association of Offi-cial Analytical Chemists, 61: 709-714. 14. Ramsay WNM (1957). Determination of
iron in blood plasma or serum. Clinica Chi-mica Acta, 2: 214-220.
15. Dahlqvist A (1964). M ethod for assay of intestinal disaccharidases. Analytical Bio-chemistry, 7: 18-25.
16. Siegel S (1975). Estatística Não-Paramé-trica para as Ciências do Comportamento. M cGraw -Hill do Brasil, São Paulo, 131-144.
17. Graitcer PL, Goldsby JM & Nichaman M Z (1981). Hemoglobins and hematocrits: are they equally sensitive in detecting ane-mias? American Journal of Clinical Nutri-tion, 34: 61-64.
18. Dallman PR, Refino C & Yland M J (1982). Sequence of development of iron defi-ciency in the rat. American Journal of Clini-cal Nutrition, 35: 671-677.
19. Joansson I & Fargërnas C (1994). Effect of iron-deficiency anaemia on saliva se-cretion rate and composition in the rat. Archives of Oral Biology, 39: 51-56. 20. Dhur A, Galan P & Hercberg S (1990).
Effect of decreased food consumption during iron deficiency upon grow th rate and iron status indicator in the rat. Annals of Nutrition and M etabolism, 34: 280-287. 21. Oski FA (1979). The nonhem atologic manifestations of iron deficiency. Ameri-can Journal of Diseases of Children, 133: 315-322.
22. Galvão LC, Collares EF, Soares FC & Brasil M RL (1978). Níveis das dissacaridases no intestino delgado de ratos lactentes sub-metidos à desnutrição proteico-calórica. Arquivos de Gastroenterologia, 15: 32-39. 23. Dallman PR, Sunshine P & Leonard Y (1967). Intestinal cytochrome response w ith repair of iron deficiency. Pediatrics, 39: 863-871.