Department of Information Science and Technology
Attributes of information systems design
leading to user satisfaction
– A banking case study
Bruno Padinha
A dissertation presented in partial fulfillment of the Requirements for the Degree of Master in Computer Science and Business Management
Supervisor:
Henrique O’Neill, PhD, Associate Professor, ISCTE-IUL
Abstract
With the growing, pervasive use of information systems (IS) by most organizations, particularly companies in technology-intensive businesses such as banking, questions arise as to the effective success of those systems, how to measure it and, most of all, what influences it. User satisfaction, even if not an end goal of IS organizations, is frequently used as a measure of that success and it has been empirically shown to correlate with other more direct measures. Several research lines, then, look at what influences user satisfaction, particularly what characteristics of information systems and their development processes tend to result in higher user satisfaction.
The research reported here looks at the specific case study of a Portuguese bank, for which a comprehensive survey is undertaken yearly to record the satisfaction of its thousands of IS users’ regarding its numerous information systems. Additional primary data was collected to characterize the information systems and their development processes, which, once structured and standardized alongside the user satisfaction survey results provided the basis for a quantitative analysis of the relationships between IS success, measured by user satisfaction, and its antecedents, using correlation and multiple linear regression techniques. The significant relationships are analyzed and the conceptual model’s results discussed in light of prior theory on the subject. Several implications for the practice and research communities are finally identified.
Key words: information systems; information systems success; information systems design; user satisfaction; banking information systems; multiple linear regression
Resumo
Com a crescente utilização de sistemas de informação (SI) por muitas organizações, particularmente empresas que actuam em sectores intensivos no uso de tecnologia, surgem muitas questões relacionadas com o sucesso destes sistemas, como medi-lo e, principalmente, o que o influencia. A satisfação dos utilizadores, embora não seja um fim último dos departamentos de SI, é frequentemente utilizada como medida desse sucesso, havendo evidência empírica para a sua correlação com outras medidas mais directas. Muitas linhas de investigação, consequentemente, lidam com as causas da satisfação dos utilizadores, particularmente com que características dos próprios sistemas de informação e dos seus processos de desenvolvimento levam a maiores níveis de satisfação.
A investigação aqui descrita concentrou-se no estudo do caso de um banco português, que executa anualmente um inquérito abrangente para medir a satisfação dos seus milhares de utilizadores de SI em relação aos seus diversos sistemas de informação. Outros dados primários foram recolhidos para caracterizar os sistemas de informação e os seus processos de desenvolvimento, dados esses que, uma vez estruturados e normalizados em linha com os resultados dos inquéritos de satisfação, permitiram uma análise quantitativa das relações entre o sucesso de SI, medido pela satisfação dos utilizadores, e os seus antecedentes, utilizando técnicas de correlação e regressão linear múltipla. As relações significativas são analisadas e discute-se também os resultados do modelo conceptual enquadrado no estado da arte nestes temas. Finalmente, identifica-se várias implicações para a prática e para a investigação.
Palavras-chave: sistemas de informação; sucesso de sistemas de informação; desenho de sistemas de informação; satisfação do utilizador; sistemas de informação na banca; regressão linear múltipla
Acknowledgments
I am indebted for the support to this research provided by the management team of the case study Bank’s IS department, which are not named here for confidentiality reasons. They know who they are, particularly the previous and the current CEO, as well as the always available Methods and Quality manager.
Thank you also for the invaluable support that came from my dissertation supervisor, Professor Henrique O’Neill, as well as the very insightful and demanding technical revisions of Professor Raúl Laureano.
To Professors Nuno Guimarães and Filomena Martins, I am very thankful for the insights they provided into the scientific method and what it takes to go through such an endeavor.
Some friends have also provided feedback for which I am thankful, namely Filipa de Sá Carneiro, who was patient enough to read some of my preliminary draft text and very polite when telling me everything that was wrong with it, and all the colleagues in the class of MIG ’13 who have provided an adequate balance of support and relaxing distractions that I needed.
Finally, the development and writing of this dissertation would not have been at all possible without the unwavering support of my loving wife, Xana, who in critical moments has valiantly kept at bay our attention-demanding three little devils at home. Thank you.
Table of Contents
Abstract ... I Resumo ... II Acknowledgments ... III Table of figures ... VII Table of tables ... VIII Glossary ... XI
1 Introduction ... 1
1.1 Preamble ... 1
1.2 Problem and objectives ... 4
1.3 Dissertation structure ... 5
2 Literature review ... 7
2.1 Overview ... 7
2.2 Information Systems success ... 7
2.3 Technology acceptance ... 11
2.4 User Satisfaction ... 16
2.5 Software related processes ... 18
3 Methodological approach ... 19
3.1 Research design ... 19
3.2 Object of the study ... 19
3.3 Approach to the literature review ... 20
3.4 Design of the conceptual model ... 20
3.5 Collection of data ... 23
3.7 Analysis of variable behavior and inter-relationships ... 33
4 Results ... 38
4.1 Behavior of the dependent variable – Satisfaction ... 38
4.2 Behavior of the independent variables ... 40
4.3 Preliminary correlation analysis ... 42
4.4 Relationship between User Satisfaction and its Antecedents ... 44
4.5 Summary of the results ... 49
5 Discussion ... 52
5.1 Project and organizational characteristics as antecedents of user satisfaction . 52 5.2 Technology: information and system quality measures as antecedents of user satisfaction ... 53
6 Conclusion ... 55
6.1 Implications for research ... 55
6.2 Implications for practice ... 56
6.3 Limitations ... 57
7 References ... 58
Table of figures
Figure 1 Updated D&M IS Success Model (DeLone and McLean 2003) ... 9
Figure 2 Determinants of IS success (Petter, DeLone and McLean 2013) ... 13
Figure 3 Unified Theory of Acceptance and Use of Technology (UTAUT) model (Venkatesh, Morris, Davis and Davis 2003) ... 14
Figure 4 Integrated IS success research model (Wixom and Todd 2005) ... 15
Figure 5 Collected variables shown in light of theoretical research and models ... 22
Figure 6 Conceptual model ... 22
Figure 7 Example user satisfaction survey question (translated) ... 26
Figure 8 Variable operationalization data model: Class diagram ... 31
Figure 9 Conceptual model with variables assigned ... 35
Figure 10 Classification of empirical publications in IS Success research (Urbach, Smolnik and Riempp 2009) ... 36
Figure 11 Frequencies of user satisfaction ... 38
Figure 12 Evolution of average user satisfaction ... 39
Figure 13 Central tendency and dispersion of user satisfaction measurements ... 40
Figure 14 Multiple linear regression findings for Model 1 ... 50
Figure 15 Multiple linear regression findings for Model 2b ... 50
Table of tables
Table 1 Original D&M summary of MIS Success Measures by Category (DeLone and
McLean 1992)... 10
Table 2 Factors posited as determinants of IS Success (Petter, DeLone and McLean 2013) ... 12
Table 3 Definitions of constructs in UTAUT (Venkatesh, Morris, Davis and Davis 2003) ... 14
Table 4 Collected variables classified according to theoretical research and models .... 21
Table 5 User satisfaction survey response rates ... 24
Table 6 Number of questions regarding satisfaction with each application ... 25
Table 7 Standardized satisfaction survey response codes ... 26
Table 8 Attributes in preliminary case file (up to the dependent variable) ... 27
Table 9 Applications and underlying systems ... 29
Table 10 Projects, feature requests and maintenance initiatives ... 30
Table 11 Independent variables related to application development ... 32
Table 12 Independent variables dealing with application characteristics ... 33
Table 13 Attributes in case file ... 34
Table 14 Linear regression models ... 37
Table 15 Behavior of variables related to effort spent on the Bank’s applications ... 41
Table 16 Behavior of variables related to user involvement in IS development ... 41
Table 17 Behavior of variables related to user information satisfaction ... 42
Table 18 Analysis of correlation with Satisfaction – results and decisions ... 43 Table 19 Results of Model 1 – Influence of Project and Organizational variables in
Table 20 Results of Model 2 – Influence of Information and System Quality variables in Satisfaction ... 46 Table 21 Results of Model 3 – Influence of P&O, IQ and SQ variables in Satisfaction ... 47
Glossary
Term Definition
End-user satisfaction
Same as User satisfaction.
Information system An electronic system or collection of systems designed to collect, process and/or analyze information, here used in the context of a business organization.
Information systems (or IS) organization
The department or division charged with planning, designing, developing and running the information systems of an
organization. Information
technology
Computer-based hardware and software used to collect, process and analyze information, here in the context of a business or organization. Sometimes used as a synonym for Information systems, although the later usually has a stricter sense that is limited to the software components.
IS Cf. Information system.
IT Cf. Information technology.
User satisfaction The degree of satisfaction reported by the user towards an information system, an application or one of its underlying systems
1 Introduction
1.1 Preamble
It is quite common nowadays for companies and governmental organizations to use information systems (IS)1 to automate activities and generally support their business activities. These systems enable organizations to become more effective and efficient in delivering their products and services to their customers and have become, in many cases, intrinsic to the businesses themselves, as is the case of many high-tech enabled industries like banking and telecommunications, among others, which could not exist in their modern form without extensive use of information systems. Banks and other financial services institutions are a case in point, spending between 5% and 9% of their operating income in information technology (IT) (Gopalan et al. 2012). A direct contribution of IT assets and capabilities to the increase of productivity and general performance of businesses across many sectors of the economy has been reported (Bharadwaj 2000; Farrell et al. 2002). For example, a study of public banks in the US concluded that “a firm’s IT capability is crucial for its competitive advantage” (Lin 2007).
As a result, bank employees have become frequent users of information systems, which give them access to information related to the bank’s customers, products and services and allow them to register and process transactions of all kinds. The systems are usually heterogeneous, based on different technologies, with various user interfaces and
1
The expression Information System, in this dissertation, means a specific application of Information Technology to some strict set of functional needs of a company or organization such as the Bank, for a certain business process or function. Throughout the text, groups of these information systems are sometimes referred to as an Application, which is the term that the (studied) Bank’s IT management employs when communicating to the users to measure their satisfaction. Other authors deal with the ambiguity of the expression with a broader definition of Information System, such as “[…] either some
aspect of an application of information technology (IT), one individual application, a group of applications (including those of an entire organization), or an application of one type of IT” (Seddon
functionalities, and differing levels of integration of the information that is captured and processed (Heidmann 2010).
Because users do not usually have a choice regarding which system, if any at all, they shall use for each business process (i.e., system use is compulsory), it happens that they exhibit varying levels of satisfaction regarding each system, according to how they perceive it or not as an efficient, effective tool for accomplishing their tasks and responsibilities. In general, this user satisfaction is derived both from how each information system supports them in the fulfillment of their day-to-day activities, as well as, in a broader sense, from how easy the system is to learn and use, how quickly and responsively it performs the needed calculations and other information processing tasks and how effective the information systems department is at developing, operating and maintaining the organizations’ information systems, among other factors (Al‐ Maskari and Sanderson 2010).
For the information systems department of such a large and complex organization as the typical bank, the user satisfaction is very important to measure and monitor, not only because users are their immediate, internal customers, but also because it has been shown that it is usually an acceptable and objectively-measurable proxy for the success of the IS organization. For example, a study of “88 IS success measures and 192 User Satisfaction measures [in] 27 organizations […] identified three broad User Satisfaction measures that may be treated as overarching measures of IS success.” (Sedera and Tan 2005).
If user satisfaction measures the success of the information systems of an organization, a natural question arises, then, of what can management do to increase it in a significant and sustainable way?
It is immediately apparent that for the most part, user satisfaction cannot be changed directly, since it is based on a subjective perception, but rather it has to be influenced
via the more objective characteristics of the information systems and the IS organization that provides them, such as the following:
Technical characteristics of the systems (e.g. technologies employed, hardware and software architectures, functional footprint, among others);
Processes employed for the development of the information systems (such as the methods followed for analyzing, designing, coding, testing and exploring information systems);
Models of organization and governance of the entities that are in charge of managing and evolving the information systems of an organization (e.g. organizational structure of the information systems department, assignment of responsibilities between it and the business community, technical competencies of the involved staff, etc.).
Many of the decisions in these areas are, understandably, also not trivial. For example, theory and practice related to the benefits of thin- vs. fat-client architectures have come full circle, from the dumb terminal used to access a time-sharing server of the 1970’s through the DOS/CPM Personal Computer of the 80’s and 90’s all the way back to the web browser client, cloud computing and virtual desktop trends of the latest decades, then to the more recent mobile client “fat” applications architecture once again, just to cite a few examples of technologies.
Management has to analyze and decide upon information systems’ topics such as those and hope to make the right decisions regarding their influence on the ultimate success of the information systems, which will be patent in user satisfaction as well as in actual benefits accrued from their usage.
The research reported here comprised the study of a specific case, that of a Portuguese bank, which has numerous information systems and whose management is keen on conducting a yearly appraisal of the satisfaction of its users. Throughout this
dissertation, the actual bank is not identified, in order to preserve its confidentiality, but rather just referred to as “the Bank.”
1.2 Problem and objectives
Throughout the years, questions have arisen as the organization observes the ups and downs of user satisfaction with each of the Bank’s main systems and attempts to identify their root causes, in the hope of reinforcing the positive ones and eliminating or at least minimizing the negative ones. While the Bank’s Information Systems’ management attempts to identify and isolate the reasons that lead to the evolution of user satisfaction, there had never been a systematic and objective search for its antecedents.
That was an important factor driving the execution of this study, since the increasing challenges of providing more IT and IS services, with a budget that is regularly expected to decrease, require a comprehensive understanding of what leads to users satisfaction and therefore, ultimately, to IS success.
This research looked at the case study of this bank in light of the existing knowledge in the field of Information Systems Research, in particular the findings regarding user satisfaction, information systems adoption and success and its antecedents.
The analysis of the relationship between variables upon which management makes objective decisions (such as, but not limited to, the aforementioned technological architecture decisions) and user satisfaction, here taken as a proxy of IS success, is prone to be very relevant for the management of the Bank and possibly provide food for thought for other organizations of a similar nature.
In addition, the methodology, described in chapter 3, can be applied to similar studies in the future, either of the same organization or of comparable ones, which would provide
further inform the Bank’s management in making decisions regarding the information systems and their development processes, with a somewhat clearer understanding of what outcomes of those decisions in terms of user satisfaction and, ultimately, IS success, could be expected.
The main objective of this study was, in summary, to increase the understanding of the relationship between satisfaction and the characteristics of information systems and their development processes in the specific case of this Bank. With that in mind, the problem was formulated as follows:
Problem statement: Which characteristics of Information Systems and their development processes influence user satisfaction?
The above-mentioned organizational aspects of the IS function could not be included in the problem to be addressed by this study, since the unit of analysis of the satisfaction data – each of the bank’s main applications / information systems – were not easily connected individually to the characteristics of the organization. It is possible that such objective could better be achieved by analyzing the satisfaction of end-users with the processes and services of the IS organization, instead of with its actual software products. That research path is therefore suggested in the conclusions of this dissertation.
1.3 Dissertation structure
After this introductory chapter, focused in presenting an overview of the research background, stating the problem and research objectives and explaining the motivation for the work, this dissertation proceeds in chapter 2 – Literature review – to review the relevant existing literature in the fields of Information System Research and to present its main findings, upon which stands the remainder of the work.
An explanation of the research design follows in chapter 3 – Methodological approach – as well as an introduction to the object of study (the Portuguese bank) and a description of the steps that were taken to collect, standardize and analyze the data. The results are subsequently presented in chapter 4 – starting with the overview of the analyzed variables, including the univariate behavior of the dependent and independent variables, as well as the results of the application of bivariate analysis techniques. In chapter 5 – Discussion – those results are related to the prior analysis of the state of the art and existing research models, and possible explanations are laid out for the relationships identified between user satisfaction and its antecedents.
The dissertation closes with chapter 6 – Conclusion – in which the implications of this study to the research community and the practitioners are identified, as well as its limitations are pointed out and suggestions for further research are made.
2 Literature review
2.1 Overview
The literature review started with the identification of seminal works in the relevant fields for the scope of this research and then proceeded to review their references as well as subsequent applications and further research which could contribute to the research objectives.
Each section in this chapter presents the key conclusions of the review for each of the main fields, starting with Information Systems Success, given its role as one of the ultimate goals of IS Research, then moving on to Technology Acceptance, a parallel research stream which also deals with the final goals of information systems, followed by a review of the state of the art on User Satisfaction, which has a central role in the studied case as well as in the chosen scope for this research and finally, by an overview of the literature dealing with Software Development processes, which was also an important foundation for this research, which deals with the study of the many different approaches to the creation and operation of information systems in an organizational context.
The results of this review were ultimately used to design the research scope and methodology as well as to ensure that the data to be collected allowed as much as possible for comparison of the results with other published studies.
2.2 Information Systems success
As information systems become more prevalent in organizations today and developing and running them becomes a sizeable portion of the budget (Gopalan, Jain, Kalani and Tan 2012), the question of the benefits that organizations get in return for that investment rises in importance. The definition and measures of what constitutes success in the context of Information Systems have long been a focus of IS Research,
recognized as a complex subject, essentially because (i) there are multiple perspectives in which IS success can be evaluated, (ii) there are different environments in which the analysis is made and (iii) there are very distinct practical implications of IS success. A recent structured literature review (Urbach et al. 2009) focused on the state of the art on IS success has identified and classified some of the more prominent alternative measurement models that have emerged, notable examples of which are the Delone & McLean (D&M) model, first published in 1992, then subsequently refined and improved a decade later (DeLone and McLean 1992; DeLone and McLean 2003), which is further explored below; a re-specification of that model by Seddon (Seddon 1997), which attempts to eliminate the process interpretation of the original model and to isolate the behavioral variance model related to IS use; the IS Effectiveness model (Grover et al. 1996); and the Enterprise System Benefit Framework (Shang and Seddon 2002), which focuses on enterprise-wide, package-based systems and proposes a taxonomy rooted in five main categories of benefits (operational, managerial, strategic, IT infrastructure and organizational) for those kinds of systems.
Among those, the D&M model emerges as the most cited and widely used theory and the “dominant basis of IS success measurement” (Urbach, Smolnik and Riempp 2009). The updated version of the model is summarized in the diagram in Figure 1.
The authors of the D&M model started with a revision of the many definitions of IS success at the time and classified their measures into seven interdependent variables, recognizing the multidimensional and interdependent nature of IS success: Information Quality, System Quality, (Intention to) Use, User Satisfaction, Net Benefits and Service Quality (this last one was not part of the original model, but was added by the authors in the 2003 revision, arguing that it is a useful complement to Information Quality and System Quality specially when the overall success of an IS department is being analyzed, as opposed to when the focus is in a single information system).
Figure 1 Updated D&M IS Success Model (DeLone and McLean 2003)
A high-level interpretation of the model, in a process perspective, emphasized by its authors, is that the intrinsic characteristics of a system can evaluated in terms of the three left-most variables in the diagram – System Quality, Information Quality and Service Quality – which affect the actual Use of the system (or, in compulsory use contexts, their Intention to Use) and the User Satisfaction derived from that use. These two intermediate variables interdependently reinforce each other and, in turn, lead to Net Benefits, i.e., a measure of the individual and organizational impacts of the information system.
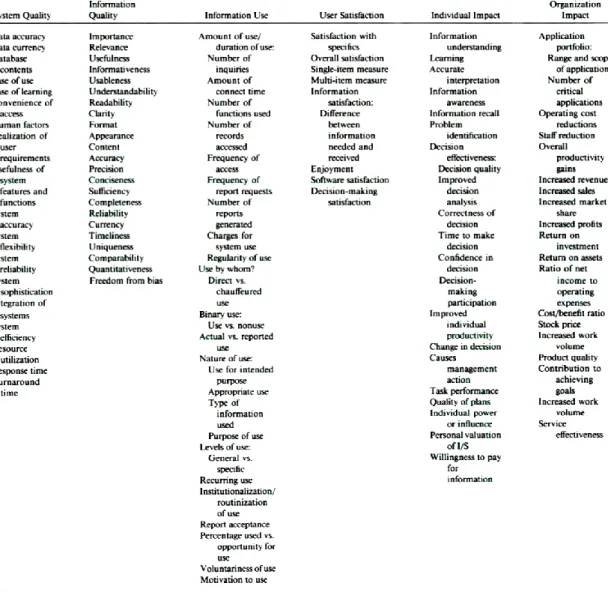
The authors of the D&M model did not explicitly specify measures for each of those aspects, since the measurements and variables they found in the literature, both for field and lab application, were quite numerous and, in many cases, contingent on the scope of the empirical investigation to be undertaken (cf. Table 1). Nevertheless, it is advised that in the careful process of selecting variables, all efforts should be made to considerably reduce the number of measures applied to IS Success research, in the interest of comparability and validation of results.
Table 1 Original D&M summary of MIS Success Measures by Category (DeLone and McLean 1992)
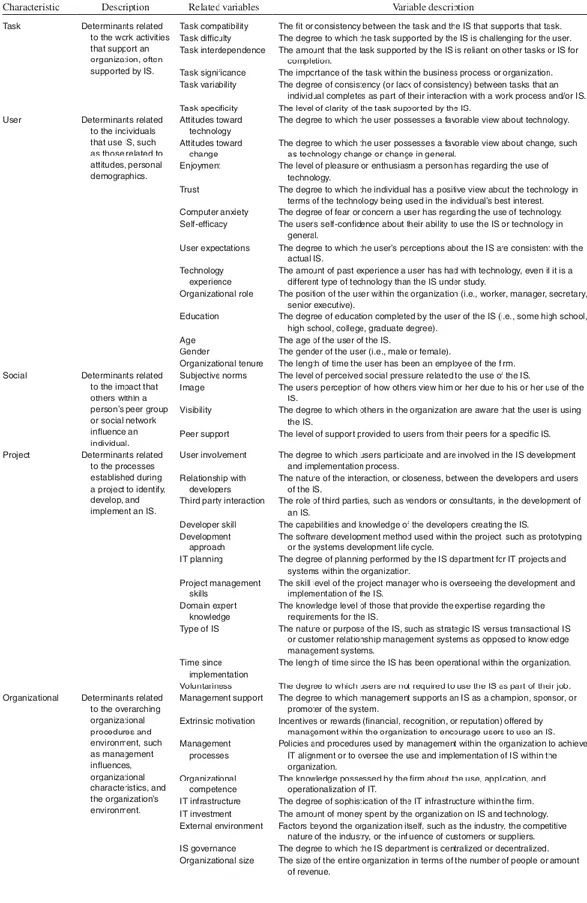
Upon publishing of the original model, as well as following its update in 2003, a considerable amount of research work ensued, looking to validate and advance the theory, a good summary of which is provided in a recent qualitative literature review of more than 600 articles published between 1992 and 2007 (Petter et al. 2013). Recognizing that there is a lack of research that systematizes and integrates the variables that influence IS success, Petter and the original authors propose the 43
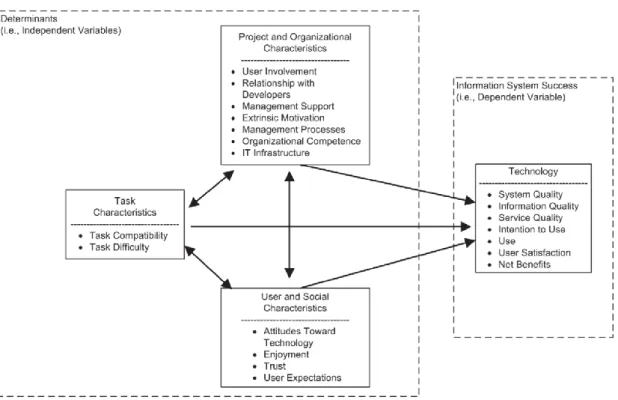
dimensions of IS Success present in the D&M model. These variables were then organized into the IS success determinants categories – task, user, social, project and organizational characteristics – as per three of the dimensions of Leavitt’s Diamond of Organizational Change (Leavitt and March 1962), from which, finally, 15 IS success factors emerged as the ones that were most consistently demonstrated to influence IS success across types of information systems and contexts, which are summarized in Figure 2.
2.3 Technology acceptance
In addition to the IS Success front, another research stream from which insight has been derived that is directly relevant to the present study is the investigation of technology acceptance, whose seminal work proposes a Unified Theory of Acceptance and Use of Technology (UTAUT) (Venkatesh et al. 2003), which posits that attitudes such as user satisfaction influence behaviors like actual system use (for non-compulsory systems), which furthers the case for satisfaction being a driver of real benefits from information systems.
UTAUT was derived from eight prior prominent models of IT user acceptance, starting with the application of those models in a longitudinal study which collected data from four organizations at three points in time across a six-month period. The individual models explained between 17 and 53 percent of the variance in user intention to use a system. Then a unified model was specified, proposing a small set of core determinants and up to four moderators. This model outperformed all the original eight when applied to the same data, explaining up to 69 percent of the variance. Finally, using data from two additional organizations, the authors confirmed the validity of the model (adjusted R2 of 70%). The model is summarized in Figure 3 and definitions of its main constructs are presented in Table 3.
Figure 2 Determinants of IS success (Petter, DeLone and McLean 2013)
The UTAUT proponents also purport in prior research that satisfaction and other such attitudes evolve over time, in line with other antecedent or moderating variables, such as system use and user experience, which suggests that longitudinal studies, by analyzing the relationships between these variables over time, should be able to provide a richer understanding and deeper insight than simpler cross-sectional ones.:
“We found that as individuals gained direct experience with a system over time, they relied less on social information in forming perceived usefulness and intention but continued to judge a system’s usefulness on the basis of potential status benefits resulting from use.” (Venkatesh and Davis 2000)
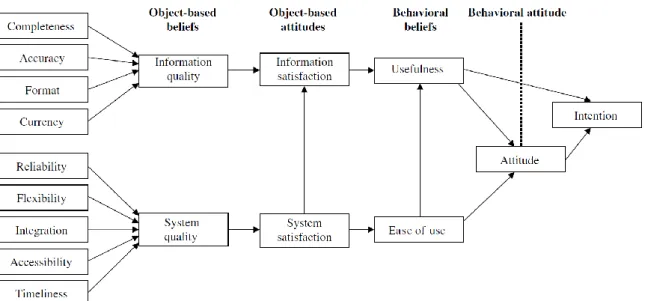
Even though these acceptance models, such as UTAUT, emerged from a stream of research that is essentially parallel to the IS Success and User Satisfaction ones, some authors have successfully combined them, allowing for an overall perspective on the entire information systems life-cycle, from design and development to the realization of business benefits and the resulting economic value. One such model (Wixom and Todd
2005) is shown in Figure 4, once again highlighting the central role of satisfaction, both that related to the information managed within the system (“Information satisfaction”) as well as that with the system itself (“System satisfaction”).
Figure 3 Unified Theory of Acceptance and Use of Technology (UTAUT) model (Venkatesh, Morris, Davis and Davis 2003)
Table 3 Definitions of constructs in UTAUT (Venkatesh, Morris, Davis and Davis 2003)
Construct Definition
Performance Expectancy
“[…] the degree to which an individual believes that using the system will help him or her to attain gains in job performance.”
Effort Expectancy “[…] the degree of ease associated with the use of the system.”
Social Influence “[…] the degree to which an individual perceives that important others believe he or she should use the new system.”
Facilitating Conditions
“[…] the degree to which an individual believes that an organizational and technical infrastructure exists to support use of the system.”
In fact, it is understood that the usefulness of satisfaction as a measure of IS Success, due to its significant relationship to antecedents related to system characteristics and associated processes, is hindered if it cannot be shown that satisfaction itself is a relevant antecedent of actual system use.
Figure 4 Integrated IS success research model (Wixom and Todd 2005)
This model and associated empirical research provides evidence for that link, hence addressing important criticisms of the use of satisfaction as a measure of IS Success (Melone 1990), namely that:
1. It did not establish a link between the attitudes towards the system (satisfaction) and actual behaviors (such as system use); and
2. It did not account for variations of satisfaction throughout the user learning curve for the information system.
This key role of satisfaction is emphasized by those authors, which explain that the user perceptions of quality are based on their beliefs and attitudes related to the information systems. For example, information satisfaction positively influences the perception of usefulness. Likewise, system satisfaction “represents a degree of favorableness with
respect to the system and the mechanics of interaction. The more satisfied one is with the system itself, the more likely one is to find the system to be easy to use.” (Wixom and Todd 2005). Therefore, the model adds related hypothesis which is that the easier to use a system is deemed, the more useful it becomes in the eyes of the users, since it is a pre-requirement to obtaining useful information from a system that one is able to use it at all, and as easily as possible. “Thus, an individual’s level of satisfaction with the system is likely to influence his or her sense of satisfaction with the information it produces”, the authors add (Wixom and Todd 2005).
2.4 User Satisfaction
Definitions of user satisfaction in the literature tend to start from the psychology literature’s broad definition of satisfaction as “[…] in a given situation […] the sum of one's feelings or attitudes toward a variety of factors affecting that situation.” (Bailey and Pearson 1983), then apply it to the realm of Information System users with a focus on the information in those systems:
“User information satisfaction [UIS] […] is defined as the extent to which users believe the information system available to them meets their information requirements. […]” (Ives et al. 1983)
The same authors then go on to praise the use of user satisfaction as a measure of IS success:
Although ideally one would like to evaluate the effectiveness of an information system based on its degree of use in decision making and the resultant productivity benefits, this "decision analysis" approach is generally not feasible. Satisfaction of users with their information systems is [therefore] a potentially measurable, and generally acceptable, surrogate for utility in decision making. […] UIS is a perceptual or subjective
determinants of information system effectiveness which are frequently not available” (Ives, Olson and Baroudi 1983).
Subsequent research has confirmed the usefulness and validity of user satisfaction as either one dimension of or an overarching construct for information systems success. For example, the authors of the D&M IS success model, referred to before (DeLone and McLean 1992), advance three reasons for this, particularly for contexts in which use of the information system is compulsory, and therefore other measures, such as actual usage, become less relevant: first of all, its face value, i.e., the fact that a system whose users are satisfied is undeniably successful, at least up to a certain degree; second the availability of reliable tools for measuring it (such as Bailey and Pearson’s one (1983), among others); finally, due to the conceptual weaknesses or empirical obstacles of other proposed measures of IS success.
In fact, user satisfaction features prominently in the D&M model, being among the most widely studied components of IS Success, for which popular measurement instruments have long since been proposed, refined and extensively applied (Bailey and Pearson 1983; Doll and Torkzadeh 1988; Doll and Torkzadeh 1991; Galletta and Lederer 1989; Ives, Olson and Baroudi 1983). There has been empirical confirmation of user satisfaction’s validity as a measure of IS Success (Doll et al. 1994; Thong and Yap 1996) and it is even proposed as a potential single measure of IS success by some authors more recently (Sedera and Tan 2005).
Finally, another key insight regarding user satisfaction’s relevance is that the multivariate nature of the IS success models supports the idea that there is a direct relationship between satisfaction and some of the success determinants such as user involvement (Baroudi et al. 1986; Doll and Torkzadeh 1989; Tait and Vessey 1988), namely through training (Guimaraes et al. 1996), and quality of information (Saarinen 1996; Shirani et al. 1994).
2.5 Software related processes
The vast literature on software development processes and other information systems related processes (CMMI Product Team 2010; Wohlwend and Rosenbaum 1993) shows that the research so far yielded only a few conclusions regarding their influence on user satisfaction and IS success in general.
One such conclusion is that the involvement of users throughout the development of the system (for example on the design of the system, testing it, training and other such activities) has a significant influence on the ulterior user satisfaction (Baroudi, Olson and Ives 1986; Doll and Torkzadeh 1989; Guimaraes, Yoon and Clevenson 1996). Another relevant conclusion is that the maturity of the overall software development and maintenance organizational processes, of which a widely accepted measure is the CMMI-DEV model, from the Carnegie-Mellon Software Engineering Institute (CMMI Product Team 2010), has a relevant influence in overall IS success (Jiang et al. 2004).
3 Methodological approach
3.1 Research design
Given the stated problem and research objectives already presented (cf. section 1.2), the approach chosen was that of a case study, which has benefited from the long-term relationship of the author as a consultant with the Portuguese bank that was the object of the study.
Focusing on a specific case study allowed for a deep analysis of the details of the Bank’s information systems, eliciting rich information on their characteristics, the Bank’s development processes and the ultimate user satisfaction with the applications, as well as ensuring that information was interpreted in the correct context, a key tenet of the case study method (Yin 2002).
From the possible alternative designs that could be applied (Creswell 2002), this research was conceived as descriptive, leaning essentially on the collection and analysis of quantitative data.
3.2 Object of the study
The Bank is a medium-sized financial institution operating in the Portuguese Market since the early 20th century, with net assets over 13 billion euros and more than 600 branches at the end of 2012.
The group includes the core banking operating units as well as specialized companies operating in related businesses such as insurance and asset management.
In addition, there are a number of corporate and shared service centers providing centralized functions such as marketing, legal support and information systems.
In particular, the Information Systems and Information Technology shared service center effectively fulfills the role of an IS department of the Bank and other group companies, providing the hardware, software and services that enable the use of information technology by the business units. That center was therefore the main source for this study, and is henceforth referred to as “the Bank’s IS Department” or simply “the IS Department”.
3.3 Approach to the literature review
The literature review (presented in chapter 2) started with the seminal papers on the key topics of information systems success, user satisfaction, technology acceptance and software development, then proceeded to include their references and subsequent references, as well as other research and documentation found via keyword search for specific topics. Several important theoretical and conceptual constructs emerged from this review, which informed the subsequent field work.
3.4 Design of the conceptual model
The idea for this research came from the practice of the Bank’s IS Department to measure the users’ satisfaction every year with a comprehensive survey. This prompted the question of what can management do to increase that satisfaction, which could be informed by an analysis of processual determinants that could likely be having a positive or negative influence in the user’s satisfaction. Satisfaction, therefore, took the place of dependent variable and a quest to identify suitable independent variables to test ensued. Even though user satisfaction is a perception, therefore a subjective measure, the research strived to collect and analyze real, objective measures as well, such as training and testing approach, among others.
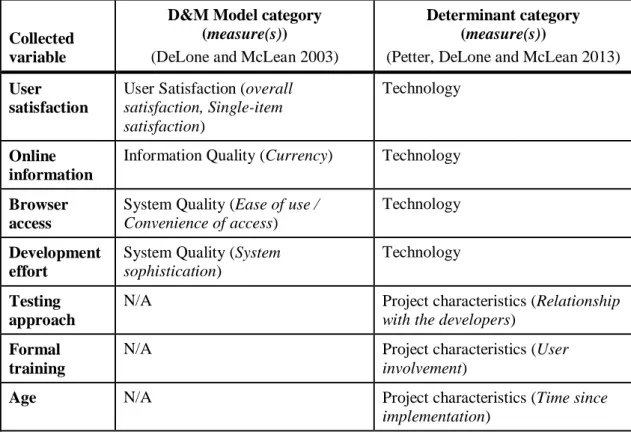
with the Bank’s IS Department leadership for identifying which data was available to operationalize variables that corresponded to the concepts and constructs in the literature, particularly the D&M model and its more recent taxonomy of IS success determinants (cf. Table 1 and Table 2). This lead to the identification and subsequent collection and standardization of data related to the variables presented in Table 4, which are grouped according to those models and associated research, as shown in Figure 5.
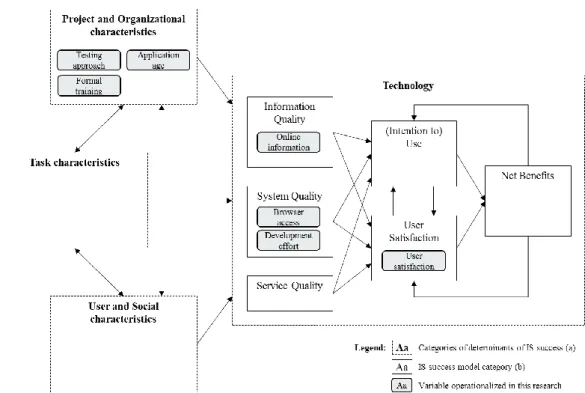
Based on the collected data, the simpler conceptual model for this study was then designed and is presented in Figure 6.
Table 4 Collected variables classified according to theoretical research and models
Collected variable
D&M Model category (measure(s))
(DeLone and McLean 2003)
Determinant category (measure(s))
(Petter, DeLone and McLean 2013)
User satisfaction
User Satisfaction (overall satisfaction, Single-item satisfaction)
Technology
Online information
Information Quality (Currency) Technology
Browser access
System Quality (Ease of use / Convenience of access)
Technology
Development effort
System Quality (System sophistication)
Technology
Testing approach
N/A Project characteristics (Relationship
with the developers)
Formal training
N/A Project characteristics (User
involvement)
Age N/A Project characteristics (Time since
Figure 5 Collected variables shown in light of theoretical research and models
Sources: (a) (Petter, DeLone and McLean 2013), (b) (DeLone and McLean 2003) Figure 6 Conceptual model
3.5 Collection of data
3.5.1 Main concepts and variables
Once the conceptual basis was established, research then proceeded with the collection of data related with the user satisfaction as well as the characteristics of the Bank’s information systems and their development processes for which information was available for collection and which could serve to operationalize the concepts identified in Table 4. This data was subsequently used to operationalize the dependent and independent variables.
The collected data covers a time span of five years, from 2008 to 2012, which existed thanks to the Bank’s commitment to regularly monitor its IS business processes and yearly measure the corresponding user satisfaction. This provided the opportunity to analyze the dynamics of the relationships between IS success and its antecedents, which is relatively uncommon due to the cross-sectional nature of the approach followed by many of the research works in the literature in these fields (Melone 1990; Wixom and Todd 2005).
While the dependent variable data came directly from the yearly user satisfaction surveys, the operationalization of the independent variables required the collection of and manipulation of data from many sources in order for it to be in a format that was compatible with the user satisfaction data. The approach that was followed for that data collection is explained in detail in the following sections of this chapter.
3.5.2 User Satisfaction
The Bank’s IS Department conducts three yearly satisfaction surveys: an IS user satisfaction survey, a management IS satisfaction survey and an internal IS employee satisfaction survey. All of these are issued electronically to the Bank’s employees, with the responses being collected anonymously and analyzed by an external entity. The first
of those surveys was used as the source of information for operationalizing the dependent variable in this research. It usually has considerably high response rates, as shown in Table 5.
Table 5 User satisfaction survey response rates
Year 2008 2009 2010 2011 2012
Total number of users (u) 3,836 4,289 3,779 4,063 4,119
Number of valid survey responses (n) 1,618 2,246 1,850 1,752 2,095
Rate (n/u) 42% 52% 49% 43% 51%
The set of responses to those surveys over a five year period (2008 through 2012) was used as data for the dependent variable, The user satisfaction surveys considerably resemble some of the most widely used instruments for measuring satisfaction found in the literature review (Bailey and Pearson 1983; Doll and Torkzadeh 1988) and which have been empirically validated (Melone 1990). They have three main sections, covering (i) the user’s satisfaction with the Bank’s Information Systems, (ii) the IS Department’s provision of services and (iii) the importance of those systems and services to the user. The data collection for the Satisfaction variable focused on the first of these sections.
Although some changes are made every year to the surveys, mainly to add questions related to newly introduced systems or services and to remove those which are no longer in use, the majority of the items related to the main banking applications have been regularly included in the surveys for at least a majority of the years included in the research.
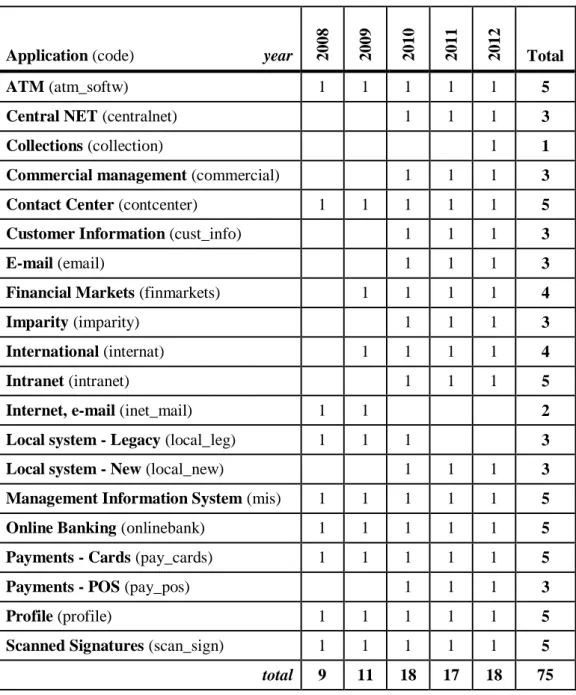
Each question in each questionnaire was associated, whenever possible, to a main application in the information systems inventory already collected, and coded as shown in Table 6.
Table 6 Number of questions regarding satisfaction with each application
Application (code) year 2008 2009 2010 2011 2012 Total
ATM (atm_softw) 1 1 1 1 1 5
Central NET (centralnet) 1 1 1 3
Collections (collection) 1 1
Commercial management (commercial) 1 1 1 3
Contact Center (contcenter) 1 1 1 1 1 5
Customer Information (cust_info) 1 1 1 3
E-mail (email) 1 1 1 3
Financial Markets (finmarkets) 1 1 1 1 4
Imparity (imparity) 1 1 1 3
International (internat) 1 1 1 1 4
Intranet (intranet) 1 1 1 5
Internet, e-mail (inet_mail) 1 1 2
Local system - Legacy (local_leg) 1 1 1 3
Local system - New (local_new) 1 1 1 3
Management Information System (mis) 1 1 1 1 1 5
Online Banking (onlinebank) 1 1 1 1 1 5
Payments - Cards (pay_cards) 1 1 1 1 1 5
Payments - POS (pay_pos) 1 1 1 3
Profile (profile) 1 1 1 1 1 5
Scanned Signatures (scan_sign) 1 1 1 1 1 5
total 9 11 18 17 18 75
The user satisfaction survey questions ask the respondents’ to rate their satisfaction with each main application developed and operated by the Bank’s IS department. The responses are recorded in the form of a 4-point Likert item, which is a commonly used approach for measuring satisfaction (Bailey and Pearson 1983; Carifio and Perla 2007; Melone 1990), following the template in Figure 7 (translated from the 2012 survey,
originally in Portuguese). The scale has an even number of points (four) which prevents indecisive responses, for which the users are asked to select the “Don’t know” option instead.
Figure 7 Example user satisfaction survey question (translated)
“Overall, I am satisfied with the [Application Name] application provided by the IS department.” Fully disagree Partially disagree Partially agree Fully agree Don’t know
Although the same Likert-type scale was used in all the questionnaires (see Figure 7), the coding of the responses was not exactly the same in each year. Therefore, carefully recoding of the survey responses was undertaken in a spreadsheet program, using the codes shown in Table 7, and then all the responses were consolidated in a single satisfaction variable source file, being careful to map each question to the appropriate Application column.
Table 7 Standardized satisfaction survey response codes
Response Code
Fully disagree 1 Partially disagree 2 Partially agree 3
Fully agree 4
Don’t know . (blank)
While Likert-type scales comprised of multiple items are commonly used for measuring user satisfaction, the use of single-item Likert-scales has also been reported in published
widely used in many of the instruments to measure user satisfaction (Hayes 1998), and several authors back their use, if carefully applied, as continuous or, at least, ordinal variables (Botelho et al. 2011; Göb et al. 2007).
The operationalization of the variable for user satisfaction regarding each application in each year was achieved by averaging the valid responses from all users to the relevant question in the year’s questionnaire. The median was also calculated as an additional measure of satisfaction, but later discarded since it proved to be too limited in range for many analyses and did not yield significantly different results for the remaining ones. This yielded a preliminary case file consisting of the attributes per line presented in Table 8.
Table 8 Attributes in preliminary case file (up to the dependent variable)
Variable Description
c_APPV Main application: code
c_APPN Main application: name
c_APPD Main application: description
c_YEAR Year to which the case applies
d_SAT Average user satisfaction regarding the application in that year
3.5.3 Applications and systems
An obstacle that had to be overcome in the data collection process was the level of detail at which the information systems in the Bank are analyzed and recorded: each of the Bank’s main Applications is comprised of one or more underlying Systems, each of them fulfilling a specific role. The Bank’s IS Department management provided an exhaustive inventory of these underlying systems, including key characteristics such as their names and short descriptions of their functions, the vendors that provided them,
the types of technologies used, the initial production years, how they were developed, namely whether the users were formally involved in activities such as acceptance testing and training, and to which main application each one belongs to.
While in the user satisfaction surveys’ questions, global Application names are referred to, many other sources of information record the data at the underlying System level of detail. Since satisfaction was the driver for this research, it was decided that in the cases in which data was collected at the System level of detail, it would be aggregated in some way for all the Systems which are associated with a specific Application. The relationship between Applications and Systems is shown in Table 9. The Applications listed in that table are not an exhaustive inventory of all of the Bank’s information systems, since collected information was discarded if it applied to Applications for which satisfaction was not measured in the surveys.
3.5.4 Projects, requests and maintenance
The IS Department regularly executes large-scale projects (designated “projects” below), which develop new features or even replace existing entire systems and applications altogether, as well as smaller-scale initiatives dealing with features requested by the end-users (“user feature requests”), and other smaller application maintenance activities (“maintenance activities”).
Information was gathered on the projects and requests that were executed throughout the period in analysis, namely which ones contributed to the development of each system and application, how many person-days were employed, when the activities took place and some of the methodological approaches undertaken.
Although some effort was spent trying to elicit additional information regarding these projects, sadly no other structured data could be obtained about the software development life-cycle, since the main change that was introduced at the Bank in this
achieved precisely in 2007, prior to the projects under analysis taking place, which means that all of the projects for which data has been collected were implemented already following the new processes.
Table 9 Applications and underlying systems
Application Codename Underlying systems
ATM ATM_SOFTW Expand Server
Central NET CENTRALNET Central NET
Collections COLLECTION CollectionsBox, Jvris
Commercial management
COMMERCIAL Análise Desempenho Comercial, Gestão Comercial, SAS
Contact Center CONTCENTER Altitude
Customer Information
CUST_INFO Cliente Grupo
Financial Markets FINMARKETS Futuros, Voyager, Calypso, Central Online, Focus
ALM, GESTPROC, Globus (Histórico), OPICS (Histórico), Sifox, Sifox (Histórico)
Imparity IMPARITY Imparidade, MOAI
International INTERNAT Eximbills CS, Eximbills EE, Smart
Intranet INTRANET Logger, CAFT, CS, CSAPP, CSAPP (IMCA),
RSAdmin, Simuladores Intranet
Local system - New LOCAL_NEW CATS, Balcões
Management Information System
MIS ODS, SIG
Online Banking ONLINEBANK Backoffice Canais WEB, Mobile, Online
Empresas, Online Gestão, Online Particulares, Publicação de Contas, Relatórios, Loja ABC, SAGE BE, Site Institucional, sms.SE
Profile PROFILE Profile FMS, Profile IBS
In total, 96 main projects, 142 user requests and 2,020 maintenance initiatives that took place from 2008 to 2012 were analyzed and either associated with the systems and applications that they deal with or discarded if they did not directly affect the applications being studied.
Table 10 shows the number of relevant projects, requests and maintenance initiatives that took place in each year.
Table 10 Projects, feature requests and maintenance initiatives
Year 2008 2009 2010 2011 2012
Projects 16 16 12 5 12
User feature requests 8 7 33 59 44
Maintenance initiatives 329 300 353 333 966
Each project was individually mapped to each of the Bank’s applications’ underlying systems and then finally aggregated for each of the main applications presented in Table 9. The detailed mapping between the projects and the applications is presented in appendix A, on page 63.
After all the information was collected and processed, tables summarizing and relating the various items were prepared and submitted for validation by the management of the IS Department of the Bank, in order to have an additional measure of confidence on the collected and processed data.
The final tables were then setup in a database layout in order for their contents to be cross-referenced and combined into the final case file, as per the data model in Figure 8.
Figure 8 Variable operationalization data model: Class diagram
3.6 Operationalization of independent variables
By combining the information on the applications and systems, on one hand, and projects, requests and initiatives, on the other, the independent variables where operationalized, presented in the following tables grouped according to their ability to measure key concepts from the literature:
Application development, including effort and user involvement (Table 11);
Application characteristics (Table 12).
In some cases, dummy variables were coded to represent the presence or absence in an Application of certain characteristics in its underlying systems. For example, the i_BrowserA and i_BrowserB variables are both dummy codings related to the execution (or not) of formal acceptance tests for each underlying system associated with a certain application, the first one following a more conservative approach (1 only if formal
acceptance tests took place for all underlying systems) and the second one a more lax approach (1 if any underlying system went through acceptance testing). As described later, a correlation significance test was conducted to select the stronger of these two approaches.
Another data modelling step consisted in the conversion of hours to person-years, which assumed one year has 12 months of 21 days, each corresponding to 8 hours of work, which was introduced for convenience in some calculations and analysis. The final case file was then built, by combining the independent variables with the appropriate lines in the application satisfaction case file (described in section 3.5.2 above), resulting in the complete list of attributes presented in Table 13.
Table 11 Independent variables related to application development
Concept Concept description Variable description
Variable code2 Total develop-ment Application development effort (large scale projects, medium- and small-sized maintenance requests)
Total person-hours spent i_TotH
Total person-years spent i_TotY
Accept-ance Tests
User involvement in application development through formal acceptance tests
Percentage of underlying systems of the application for which formal acceptance tests were undertaken
i_Tests
Training User involvement in application development through formal classroom training
Dummy variable (1 if training took place for most underlying systems, 0 otherwise)
Table 12 Independent variables dealing with application characteristics
Concept Concept description Variable description
Variable
code3
Browser-based access
Access to the application by the users takes place through a web browser interface (i.e., not through a terminal nor dedicated client software)
Dummy variable (1 if access is browser-based for all underlying systems, 0 otherwise)
i_BrowserA
Dummy variable (1 if access is browser-based for any
underlying system, 0 otherwise)
i_BrowserB
Online information update
The information residing in the application is updated online (i.e., not only in daily batches)
Percentage of underlying systems of the application for which information is online
i_Online
Application maturity
How long has the application been in production use
Since how many years has the earliest underlying system been introduced
i_Age
3.7 Analysis of variable behavior and inter-relationships
After all the information was collected, validated, standardized and consolidated into a single case file, analysis started with descriptive measures of the dependent and independent variables: central tendency measures (mean and median, where applicable) and dispersion measures (range and standard deviation). The evolution of satisfaction and of the independent variables over time was thus analyzed, as a whole, as well as per main application. This allowed for the checking of potential outliers and whether there was any missing or incomplete information that needed to be dealt with or discarded. The next step focused on evaluating the correlation between the candidate independent variables and the dependent variable, User Satisfaction, upon which some variables were considered for discarding and others were selected to be applied for operationalizing the conceptual model (previously presented as Figure 6). This was particularly required due to the already mentioned fact that there were several possible
3
approaches to coding some of the literature concepts from the collected data, particularly in those cases of variables for which information was aggregated for each application based on more detailed information collected at the underlying system level. The final variables used to operationalize the conceptual model are shown in Figure 9.
Table 13 Attributes in case file
Variable Description
c_APPV Main application: code
c_APPN Main application: name
c_APPD Main application: description
c_YEAR Year to which the case applies
d_SAT Average user satisfaction regarding the application in that year
i_TotH Grand-total of person-hours spent on projects of all types
i_TotY Person-years spent on projects of all types (i_TotH / 2,016)
i_Tests Percentage of underlying systems of the application for which formal
acceptance tests were undertaken
i_Train Dummy variable, coded as 1 if training took place for most underlying systems
and as 0 otherwise
i_BrowserA Dummy variable, coded as 1 if access is browser-based for all underlying
systems, and as 0 otherwise
i_BrowserB Dummy variable, coded as 1 if access is browser-based for any underlying
system, and as 0 otherwise
i_Online Percentage of underlying systems of the application for which information is
online
i_Age Since how many years has the earliest underlying system been introduced
Finally, in order to test the influence of the antecedent variables in satisfaction, the multiple linear regression technique was selected as the main approach, due to its applicability to the data, as well as it being among the main analysis techniques
(Urbach, Smolnik and Riempp 2009) which analyzed articles published in the previous decade, the results of which are shown in Figure 10.
Figure 9 Conceptual model with variables assigned
The linear regression models were evaluated taking into account the following requirements on the data (Laureano 2011; Pestana and Gageiro 2008):
The relationship between the dependent variable (Y) and the independent variable or variables (X) has to be linear in the β parameters.
The errors can assume values above or below zero (their average, therefore, is assumed to be zero).
The errors are homoscedastic (i.e., their variance is constant for any value).
The errors are independently distributed in relation to one another.
Figure 10 Classification of empirical publications in IS Success research (Urbach, Smolnik and Riempp 2009)
Several regression models were evaluated, each focusing on testing the relationship between User Satisfaction and one or more of the groups of variables in the conceptual model. Due to the number of cases containing all the relevant variables, in some instances only a few variables from each group could be tested, since regression analysis requires at least 10 cases per dependent variable, with some authors even advocating a minimum of 15 (Stevens 1996).
The actually calculated models are listed in Table 14. Model #1 was created to test the influence in User Satisfaction of variables from the Project and Organizational (P&O) characteristics group, model #2 analyzed the influence in User Satisfaction of Information Quality (IQ) and System Quality (SQ) and model #3 looked after the influence in User Satisfaction of all three variable groups (P&O, IQ and SQ). If any
that model was also created by removing that variable (these additional models are denoted by a ‘b’ appended to their number, i.e. #2b and #3b).
Table 14 Linear regression models
Model # Dependent variable Independent variable(s)
#1 Satisfaction (d_SAT) Testing approach (i_Tests) Formal training (i_Train) Application age (i_Age) #2 Satisfaction (d_SAT) Online information (i_Online)
Browser access (i_BrowserB) Development effort (i_TotY) #2b Satisfaction (d_SAT) Online information (i_Online)
Browser access (i_BrowserB) #3 Satisfaction (d_SAT) Application age (i_Age)
Online information (i_Online) Browser access (i_BrowserB) Development effort (i_TotY) #3b Satisfaction (d_SAT) Application age (i_Age)
Online information (i_Online) Development effort (i_TotY)
After running each model, its significance was checked, as well as the strength of its explanatory ability, then each variable’s significance was checked as well and only then were the variables coefficients analyzed, in order to understand the strength and direction of the influence of each independent variable in the dependent variable (User Satisfaction).
4 Results
4.1 Behavior of the dependent variable – Satisfaction
Looking at the overall user satisfaction measures, for all assessed applications and all years being analyzed, the dispersion is small (st.dev./mean = 5%), but there are considerable differences between the assessed applications under analysis, ranging from the low 2’s to the high 3’s (in the 1 to 4 scale presented in Table 7, on page 26), as shown by the histogram and table in Figure 11.
Figure 11 Frequencies of user satisfaction
User satisfaction (d_SAT) Histogram
Mean 3.349 Median 3.353 Std. deviation 0.161 Range 0.718 Minimum 2.921 25th percentile 3.265 50th percentile 3.353 75th percentile 3.464 Maximum 3.639 Count (n) 73
Looking at the evolution of the average user satisfaction for each application throughout the years (Figure 12), it can be seen that not all applications vary in the same direction from one year to the other, suggesting that there are more variables at play here than just a mere change in the overall perception of the users regarding the Bank’s information systems in general.