UNIVERSITY OF ALGARVE
FACULTY OF ECONOMICS
EVALUATION OF THE ECONOMIC IMPACT OF TOURISM EXPENDITURES IN PORTUGAL
ISA MÓNICA RODRIGUES FIGUEIRAS
Dissertation to obtain the Master Degree in
TOURISM ECONOMICS AND REGIONAL DEVELOPMENT
Dissertation made under the supervision of:
Professor Doutor Rui José da Cunha de Sousa Nunes
iii
Authorship Statement
EVALUATION OF THE ECONOMIC IMPACT OF TOURISM EXPENDITURES IN PORTUGAL
Work Authorship Declaration
I declare to be the author of this work, which is unique and unprecedented. Authors and works consulted are properly cited in the text and are in the listing of references included.
ISA MÓNICA RODRIGUES FIGUEIRAS
……….…… (signature)
Copyright
© Copyright: Isa Mónica Rodrigues Figueiras
The University of Algarve has the right, perpetual and without geographical boundaries, to archive and make public this work through printed copies reproduced in paper or digital form, or by any other means known or to be invented, to broadcast it though scientific repositories and allow its copy and distribution with educational or research purposes, non-commercial purposes, provided that credit is given to the author and Publisher.
iv
v
ACKNOWLEDGMENT
In this section devoted to an acknowledgment that certainly does not allow me to thank all the people along my journey at the Faculty of Economics during the initial degree in Economics and now the Masters in Tourism Economics and Regional Development directly or indirectly contributed for academic achievement and completion of this step. The coordinator of the Master Professor Pedro Pintassilgo, was a privilege to attend the Masters that has enriched my academic and personal training.
The great support of my advisor Director of the Faculty of Economics Professor Rui Nunes, I want to thank you for the time you spent, patience, motivation, dedication and for his suggestions that contribute to enrich this work.
To thank Professor Elisabeth Valle awakened in me a curiosity for the thematic Input-Output matrix.
I want to thank my family, for the opportunity and great support they gave me to be able to reach this very important step in my academic life.
Finally, I want to thank Hugo for their unconditional support throughout this academic stage and in my life, principally for their understanding and motivation, without him would have been quite difficult.
vi
SUMMARY
O turismo é uma atividade que desde o início do século XX tem vindo a crescer e a ganhar uma grande importância a nível mundial, pela crescente relevância que o sector turístico tem vindo a exibir comparativamente à maioria dos agregados macroeconómicos, como o PIB (Produto Interno Bruto), a produção, o emprego, as importações e as receitas do governo. Como consequência, a análise do turismo tem atraído muito a atenção da comunidade científica.
A área do turismo tem recebido uma atenção especial por parte dos investigadores e profissionais de turismo, principalmente na análise do impacto económico das despesas dos turistas, que tem contribuído para o debate sobre o impacto dos turistas para a criação de riqueza económica e de emprego, bem como a melhoria dos desequilíbrios estruturais de toda a economia. O principal problema do sector turístico deve-se à complexidade na definição do produto turístico, uma vez que não existe um padrão, e que pode variar consoante a nacionalidade, idade e com os gostos individuais dos turistas.
Este trabalho pretende avaliar o impacto económico das despesas turísticas em Portugal, que realizadas ao longo do ano de 2008. A técnica utilizada é a análise input-output, ou de entradas e saídas, que tem como base a utilização da matriz input-output de Portugal para o ano de 2008, a mais recente disponibilizada pelo INE (Instituto Nacional de Estatística), contando também com a matriz disponibilizada pelo DPP (Departamento de Prospetiva e Planeamento e Relações Internacionais), juntamente com a criação de um vetor de procura final que contém as despesas turísticas, que permite efetuar o cálculo de vários multiplicadores e, deste modo, avaliar os efeitos diretos, indiretos e induzidos dos gastos turísticos na economia portuguesa.
Este trabalho surge no âmbito de Portugal contar com uma atividade turística que ao longo dos anos tem vindo a crescer e a ganhar algum destaque ao nível mundial, nomeadamente desde os anos 60 do século XX.
De acordo com os dados obtidos para o ano 2008, no Relatório de Competitividade e relativamente do setor “Viagens e Turismo” num ranking de competitividade do turismo que abrange 130 países, surge Portugal a ocupar o 15º lugar.
vii De acordo com a informação fornecida pelo World Travel & Tourism Council (WTTC) para o ano de 2008, relativamente a “Travel & Tourism” e a Portugal, a atividade representa 5% do PIB contabilizando os efeitos diretos, sendo de 14% o seu contributo se considerados os efeitos totais. Quanto ao peso que o “Travel & Tourism” apresenta como efeito direto para o emprego é de 6,1%, sendo de 16,3% o seu efeito total. De acordo com os valores apresentados, o turismo tem dado uma contribuição substancialmente positiva para a economia Portuguesa e para o crescimento económico de Portugal.
O turismo em Portugal é denominado pelo produto “Sol e Praia”. Dada a sua natureza sazonal, seria importante diversificar o produto turístico, introduzindo novos produtos não sazonais de modo a suavizar as oscilações que ocorrem na procura turística ao longo do ciclo anual.
De acordo com a informação disponibilizada pelo INE, através da Conta Satélite do Turismo (CST), existem duas variantes importantes das atividades turísticas sobre o território económico: o turismo recetor e o turismo interno. No ano de 2008, a estrutura de consumo de ambas as categorias foi direcionada maioritariamente para os produtos caracterizados como “produto turístico” como sejam o “alojamento”, a “alimentação” e o “transporte”. A existência de um maior impacto do turismo recetor na economia portuguesa deverá ser salientado. Tal discrepância decorre do maior volume de receitas turísticas provenientes dos turistas não residentes em comparação com as que têm origem nos turistas residentes.
A técnica utilizada neste trabalho, o modelo input-output, foi criado por Wassily Leontief em 1930. Apesar de ser um método com algumas décadas, é um modelo bastante atual e que tem vindo a ser aplicado em diversas áreas inclusive na medição dos impactos económicos do turismo, através da aplicação de multiplicadores, que permitem quantificar os seus efeitos: diretos, indiretos e induzidos. Uma matriz de input-output descreve a economia de uma determinada região, num determinado período de tempo, representando as trocas de bens e serviços que existem entre os diversos sectores de atividade. O facto de se trabalhar com uma matriz input-output pode ser condicionado pelo seu gap temporal visto a sua produção ser feita de cinco em cinco anos, devido à sua complexidade de construção e em reunir toda a informação necessária e ainda pela estrutura económica de uma determinada região não se alterar significativamente, durante esse período temporal.
viii Do ponto de vista metodológico, a implementação do modelo inicia-se pela construção da matriz de coeficientes de input intermédio, tarefa que é realizada cruzando a informação da matriz de produção nacional com o vetor dos outputs setoriais. Em seguida, obtém-se a chamada matriz inversa de Leontief que contém os chamados multiplicadores parciais de produção e que permitem medir os efeitos das despesas turísticas sobre os níveis dos outputs setoriais. Finalmente, usam-se os coeficientes diretos de rendimento (valor acrescentado líquido), de emprego e de importações intermédias, de modo a estender-se a medição dos efeitos das despesas turísticas daqueles agregados macroeconómicos.
A implementação da metodologia supradescrita permitiu apurar um conjunto de resultados que apontam para a preponderância dos setores da Restauração e do Alojamento, não apenas como as duas rubricas principais do vetor da procura final turística, como ainda como os setores de atividade de maior influência na determinação dos efeitos totais de output, de rendimento, de emprego. Por outra parte, resulta igualmente claro que as estruturas produtivas daqueles setores de atividade possuem um conteúdo de importações que têm como efeito a redução da sua eficácia como instrumentos de criação de rendimento e de emprego em benefício da economia portuguesa. Tal fenómeno deve-se, sobretudo, aos inputs intermédios provenientes do setor industrial e, em menor grau, aos que têm origem no setor da Energia. Estes dois setores, conjuntamente com o setor do Transporte aéreo, representam cerca de 70% do efeito total sobre as importações.
As implicações dos resultados apurados são claras: de modo a contribuir para a redução do efeito de drenagem financeira das despesas turísticas efetuadas no território económico português e simultaneamente a reforçar o seu potencial de criação de emprego e de rendimento, é necessário encetar uma política seletiva de substituição de importações focada nos inputs intermédios industriais e energéticos que mais peso exercem na estrutura produtiva das principais atividades específicas do Turismo, designadamente a Restauração e o Alojamento.
ix
ABSTRACT
Tourism activities have been gaining importance all over the world, an expression of this being the growing share of the tourist sector regarding most macroeconomic aggregates, such as GDP, output, employment, imports and government revenue. As a consequence, tourism analysis has been attracting much attention from the scientific community.
One field receiving special attention from both tourism scholars and practitioners is that of economic impact analysis of tourism expenditures, as there is still a debate over the contribution of tourism spending to the promotion of economic wealth and employment as well as the improvement of the structural unbalances of the whole economy.
This work intends to evaluate the economic impact of tourist expenditures in Portugal, in the year 2008. The technique used is output analysis. The use of the input-output matrix of Portugal for the year of 2008, coupled with the generation of a final demand vector containing tourist expenditures, allows the calculation of various multipliers and the assessment of direct, indirect and induced effects of tourist expenditures on the Portuguese economy.
Keywords: Tourism, Economic Impacts, Input-Output Analysis
x
GENERAL INDEX
Page
GRAPHS INDEX ... xi
TABLES INDEX ... xi
ABBREVIATIONS LIST ... xii
LATIN ABBREVIATIONS ... xii
LIST OF VARIABLES AND ARRAYS ... xiii
CHAPTER I – INTRODUCTION ... 1
CHAPTER II – LITERATURE REVIEW ... 6
2.1. - The input-output model ... 6
2.2. - The input-output model applied in tourism economic impact ... 10
2.3. - Economic tourism impact: The Portuguese experience ... 13
CHAPTER III – METHODOLOGY ... 15
3.1. - The input-output model ... 15
3.2. - Introduction to the input-output table ... 16
3.3. - Data sources ... 22
CHAPTER IV – DISCUSSION OF THE EMPIRICAL RESULTS AND CONCLUSIONS ... 26
4.1. - Income and employment impacts ... 26
4.2. - The leakage effect of Tourism ... 29
BIBLIOGRAPHY ... 31
xi
GRAPHS INDEX
Page Graph 1.1. – Tourism consumption, in 2008 ... 2 Graph 1.2. – Inbound tourism consumption by specific and non-specific products, in 2008 ... 2 Graph 1.3. – Inbound tourism consumptions by specific products, in 2008 ... 3
TABLES INDEX
Page Table 2.1. – Comparing the Characteristics of the Tourism Satellite Account, Input-Output Model, Social Accounting Matrices, and Computable General Equilibrium ... 9 Table 3.2.1. – The four quadrants of an input-output table ... 16 Table 3.2.2. – The national input-output table ... 18
xii
ABBREVIATIONS LIST
CGE Computable General Equilibrium
DPP Department of Foresight and Planning and International Affairs
DT Domestic Tourism
GDP Gross Domestic Product GEE Office Studies and Strategy GVA Gross Value Added
INE National Institute of Statistics
IT Inbound Tourism
PENT National Strategic Plan for Tourism SAM Social Accounting Matrix
TSA Tourism Satellite Account WTO World Trade Organization WTTC Word Travel & Tourism Council
LATIN ABBREVIATION
e.g. (exempli gratia) for example
et al. (et alia) and other
xiii
LIST OF VARIABLES AND ARRAYS
Input coefficients matrix Exports vector
Final demand matrix Final demand vector
ℎ Number of value added categories Identity matrix
Index used to denote a vector Index used to denote a sector Leontief inverse matrix Imports vector
Total imports of a country Number of sectors
Number of final demand categories or items Index used to denote a value added category Gross output vector
1
CHAPTER I – INTRODUCTION
The problem to be investigated with this dissertation is the evaluation of the Economic Impact of Tourism Expenditures in Portugal, in 2008. Tourism expenditures refer to as the amount paid for the purchase of consumption goods and services, as well as valuables, for own use or to give away, for and during tourism trips (Frechtling, 2011). The aim of this dissertation is to evaluate the effects of tourist expenditures on the Portuguese economy. The year chosen to do the analysis is 2008 to coincide with the latest available input-output matrix provided by the National Institute of Statistics in Portugal (INE) and constructed by Department of Foresight and Planning and International Affairs (DPP).
Why Tourism is a matter of interest for Portugal? And why rigorous studies designed to evaluate its impact on the Portuguese economy should be undertaken?
Portugal has a tourist activity that over the years has been growing and gaining some prominence worldwide, particularly since the 60s of the twentieth century.
Tourism is nowadays an important economic activity in Portugal. According to the Competitiveness Report of the 2008 “Travel & Tourism” sector, Portugal occupied the 15th place in a list of 130 countries in the ranking of competitiveness of the tourism sector. In a similar fashion, Amador and Cabral (2009) presented a detailed analysis concerning the evolution of the service sector in Portugal, showing a comparative advantage of the ‘Travel & Tourism’ sector. Moreover, according to WTTC (Word Travel & Tourism Council, 2014), in 2013 the total contribution of tourism to Gross Domestic Product (GDP) in Portugal was about 25,6 billion Euros, corresponding to 15.6% of GDP1.
In 2008, according to preliminary data from INE, tourism generated approximately 5% of the Gross Value Added (GVA) representing about 7,3 billion Euros.
The major issuing countries of tourists to Portugal are: Germany, Spain, France, Netherlands and the United Kingdom. Curiously, Spain accounts for almost half of foreign tourists entering the Portuguese border and, on the whole, these five countries account for over four-fifths of these entries. In 2008, these countries taken together,
2 Inbound tourism 59% Domestic tourism 41% Tourism consumption - 2008
accounted for more than 65% of total tourism revenue, also indicate the figure regarding the inbound tourism only. Spain, Germany and the Netherlands occupy the third, fourth and fifth place, respectively, as generating revenue countries. In addition to inbound tourism demand, emphasis should also be attached to internal tourism demand. The interest in domestic tourism demand has been increasing, so it is unsurprising that one of the main goals of the National Strategic Plan for Tourism (PENT) (2006-2015) is precisely to "accelerate the growth of domestic tourism" (see graph 1):
Graph 1.1. – Tourism consumption, in 2008
Source: Tourism Satellite Account, INE
Graph 1.1. shows the importance of both inbound and internal tourism, despite the fact that the former is clearly dominant over the latter. Graph 1.2. shows the structure of inbound tourists consumption (excluding excursionists) per type of product. It is quite apparent that specific products of tourism represent the lion’s share of consumption vis
3 Graph 1.2. – Inbound tourism consumption by specific and non-specific products, in
2008
Source: Tourism Satellite Account, INE
Graph 1.3. – Inbound tourism consumption by specific products, in 2008
Source: Tourism Satellite Account, INE
89% 11%
Inbound tourism consumption by specific and non-specific products - 2008
(Un.: 103Euros)
A. Specific products B. Non-specific products
2.107.155 2.120.163 2.093.966 63.847 29.240 162.495 21.714 795.069 0 500.000 1.000.000 1.500.000 2.000.000 2.500.000
Inbound tourism consumption by specific products - 2008 (Un.: 103Euros)
4 Further disaggregation of specific products, provides additional insight on the structure of inbound tourism consumption (see Graph 1.3.). It can be seen that three items taken together (accommodation, restaurants and transports) account for about 86% of total inbound tourism consumption on specific products.
Seasonality is an important feature as much as a major limitation of tourism at large. In the specific case of Portugal, the seasonal peak of tourism activities occurs during the warmer months of the year, notably July and August. This is because the Portuguese tourist model is mostly based upon the ‘sun and beach’ formula. Recently, there has been a serious effort, both from tourism authorities and private entrepreneurs, in order to smooth the seasonal cycle of tourism. Despite the occurrence of such efforts, it is commonly accepted that, given the peculiarities of the country, namely the characteristics of the natural capital stock of tourism, seasonality will remain a distinctive feature of tourism in Portugal and, therefore, should still be taken into account in the design and the implementation of development studies in the area (Daniel and Rodrigues, 2010).
It is very well established in the literature that tourism can be an effective instrument to increase the product, employment and welfare levels [Stabler, Papatheodorou and Sinclair (2010); Andereck, Valentine, Knopf and Vogt (2005); Balaguer and Cantavella-Jordá (2002)].
Papatheodorou (1999) refers to tourism as an industry of high importance for the world economy and for many countries as one of the largest single employers and exporting services sector. Yet, applied economists have paid little attention to the empirical examination of possible contributions of this sector to national economies, some authors refers that “Tourism provides a lot of opportunities for sustainable economic
development” (Zaman, Vasile, Surugiu and Surugiu, 2010).
As regards the use of input-output based modelling techniques for Tourism Analysis purposes, Polo, Ramos, Rey-Maquieira, Tugores and Valle (2008) explain that the first applications took place back in the early 1960s and analysed the leisure phenomenon in general (Archer, 1976; Bryden, 1973). Since then, numerous applications of input-output analysis have been taken place either at the national and regional levels or even in the context of large tourist resorts. A frequent purpose associated with such applications is to calculating effects on output, income, employment and other macroeconomic variables as a result of tourist activities.
5 Notwithstanding the relevance of the subject, the number and quality of academic studies in this scientific area relating to the Portuguese context remain fairly limited. This dissertation intends to contribute to fill this gap by shedding light upon a number of practical questions, not least the assessment of the effectiveness of tourism to promote both economic growth and employment levels as well as having a positive effect on the equilibrium of the economy as a whole (e.g., the external trade balance). The remainder of this dissertation is organized as follows. Chapter I introduces the topic that will be addressed in this work. A brief review of the literature deemed relevant for the purpose of this dissertation is provided in Chapter II. The methodology of input-output in carrying out the assessment of the economic impacts of tourism activities, its advantages and limitations, as well as a brief description of some alternative methodologies, is the central concern of this chapter.
Chapter III presents the methodology used throughout this study. The adjustment of the total flows national matrix into a national production matrix is described in detail along with the explicit incorporation in the matrix of some of the most relevant tourism specific products. Such modifications are intended to generate the conditions for the calculation of a wide range of tourism multipliers for Portugal and the year of 2008. Chapter IV is devoted to present and discuss the empirical results and conclusions following the application of the adopted methodology.
6
CHAPTER II – LITERATURE REVIEW
2.1. - The input-output model
Input-output analysis became a well-known analytical technique in the field of tourism economic impact. In fact, it has been extensively used in the course of at least the last five decades. Some examples of such applications are provided by Los and Steenge (2010), Lee and Taylor (2005), Dwyer, Forsyth and Spurr (2004), Blake and Sinclair (2003), Tyrrell and Johnston (2001), Dwyer, Forsyth, Madden and Spurr (2000), Lin, Halbrendt, Liang & Wood (1999), Horváth and Frechtling (1999), Zhou, Yanagida, ChaKravority and Leung (1997), Archer and Fletcher (1996), Adams and Parmenter (1995), Johnson and Moore (1993) and Fletcher (1989), among many others.
The input-output model was originally developed in 1930 by the reputed economist Wassily Leontief. In 1953 Leontief proposed a dynamic version of the model. In recognizance of his contribution for the field of economic science, Leontief was awarded the Nobel Prize in the year of 1973. Since the 1970s, input-output models have been extensively employed to assess tourism impacts.
Input-output is seen as a useful framework to analysing various types of economic issues. Namely, it allows the calculation of multipliers of the economic activity. In particular, it is used to evaluate economic impacts of tourism (Surugiu 2009, Zhou et al. 1997).
Surugiu (2009) also emphasizes the idea of using input-output analysis as a methodological tool to measuring the economic impact of tourism, particularly at the local level. Multipliers calculated within an input-output framework are able to capture all sorts of effects sometimes expressed as a ratio of total to direct effects (Miller and Blair 2009; Cooper, Fletcher, Gilbert, Shepherd and Wanhill 1998).
Archer (1995) states that impact analysis is an economic approach used to measure inter
7 an economy by the direct and secondary (indirect and induced) effects of tourist expenditure.
The distinction between direct and indirect effects is a crucial one. According to Archer (1995), the direct effect is the initial impact on business establishments resulting from the purchasing activity by visitors. In a similar fashion, Lin et al. (1999) defines direct effect as the production change associated with a change in the visitor’s demand for local goods and services; For example, meals purchasing by visitors in local restaurants. The income generated in the context of the restaurant’s activity, as much as job´s creation, additional imports and tax revenue, all represent examples of the direct effect. Also according to Archer (1995), the indirect effect is defined as the additional effects created by the trading which takes place between the various sectors of the economy as a consequence of the initial export receipts. This effect refers to a secondary impact caused by new input requirements concerning those businesses which are directly affected by visitor’s expenditures. Returning to the case of the local restaurant, an increase of the restaurant’s production will require additional purchases of inputs of the restaurant to their suppliers (e.g., food & beverage, water, electricity, among other consumables) which in turn will translate into additional production, income, employment and so forth. However, this is not the end of the story as the restaurant’s suppliers must also increase their demand for inputs from their own suppliers, creating the opportunity for further increases in production, income and so forth. The total indirect effect is simply the result of aggregating over all secondary effects as described above.
Finally, induced effects result, according to Archer (1995), from further substantial effects generated by the re-spending of household incomes created as a direct or secondary consequence of the initial export earnings; for example, a fraction of the income generated in the context of the activities of both tourism entrepreneurs and their suppliers is paid to households in the form of salaries and wages. Households will then spend a large proportion of such additional income on all sorts of consumer goods which, in turn, will represent a further boost to production, income and so on. These changes represent the induced effects.
Even though input-output analysis has proved to be a suitable framework to calculating tourism multipliers, it can also be combined with other methodological approaches for
8 policy analysis such as optimization and scenario modelling. In the particular case of tourism economic impact, Social Accounting Matrices (SAM) and Computable General Equilibrium Models (CGE) are also popular analytical settings along with that provided by input-output. Depending on the specific purposes of each study and the data which is actually available, researchers often use SAM or CGE as alternative methods, or even a combination of methods to obtain multiplier values. Typically, the information contained in input-output tables is combined with that of Tourism Satellite Account (TSA) so a proper informational environment is set up to perform tourism economic impact analysis.
SAM can be seen as an extension of the input-output table. Because it provides more detail as compared to the input-output table, SAM shows an increased potential for policy analysis. Wei, Shuib, Ramachandran, and Herman (2013), Polo and Valle (2012) and Zhou et al. (1997) define SAM as a framework designed to capture income and expenditure flows of the economic actors/units over a specified accounting period. For Wei et al. (2013), SAM extends the intersectoral links of input-output tables by showing the links between production sectors and all institutions operating within the economy. According to Zhou et al. (1997), SAM is also the primary data for CGE models. For Wei et al. (2013), SAM is an extension of input-output tables and TSA.
TSA allows one to obtain the size of the tourism sector, as well as its contribution to some of the main macroeconomic aggregates. This is accomplished in a manner which is fully consistent with the national systems of accounts (Dwyer et al. 2004). The World Tourism Organization (WTO) has developed a framework designed for the construction of TSAs and a number of governments are now seeking to put them in place. A TSA is essentially a form of static “snapshot” of the tourism sector with the rest of the economy as a scenario (WTO 1999).
Indeed, TSA just accounts for the direct effects of tourism while the indirect and induced effects are ignored altogether. In this way, an extension of this methodology with the incorporation of elements available in the input-output table could represent a potential solution (Smeral, 2006). Nevertheless, according to Pao (2005), TSA represents a major step forward in the measurement of the economic impact of tourism. On the other hand, CGE can be seen as an extension of input-output in the sense that it fully incorporates and takes advantage of the inter-industry relations displayed in
input-9 output tables. In addition, CGE modelling extends the scope of its application to areas other than production; namely, consumption of commodities and distribution and redistribution of income. This means attaching more relevance to various institutions such as households and public administrations. Zhou et al. (1997) define the CGE method as an alternative tool for regional analysis, which incorporates general links between production structures, incomes of various groups, and demand patterns.
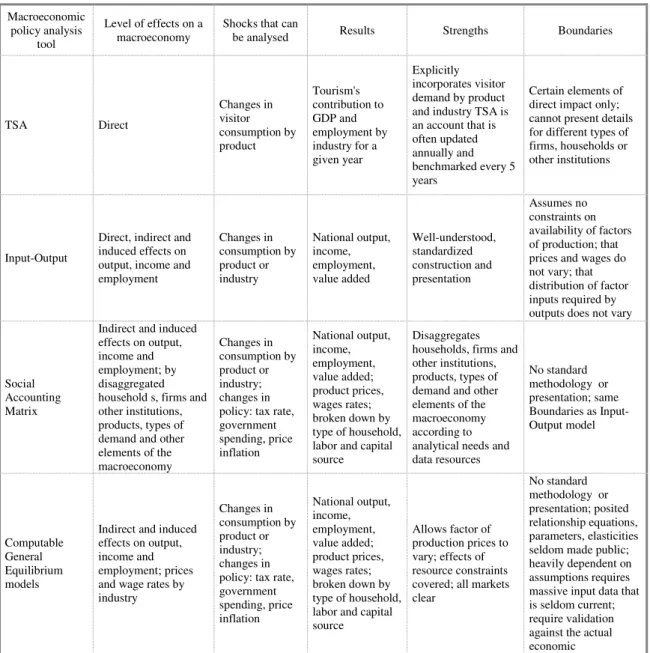
Table 2.1. provides a summarized comparison of the techniques discussed above.
Table 2.1. – Comparing the Characteristics of the Tourism Satellite Account, Input-Output Model, Social Accounting Matrices, and Computable General Equilibrium
Model Macroeconomic policy analysis tool Level of effects on a macroeconomy
Shocks that can
be analysed Results Strengths Boundaries
TSA Direct Changes in visitor consumption by product Tourism's contribution to GDP and employment by industry for a given year Explicitly incorporates visitor demand by product and industry TSA is an account that is often updated annually and benchmarked every 5 years Certain elements of direct impact only; cannot present details for different types of firms, households or other institutions
Input-Output
Direct, indirect and induced effects on output, income and employment Changes in consumption by product or industry National output, income, employment, value added Well-understood, standardized construction and presentation Assumes no constraints on availability of factors of production; that prices and wages do not vary; that distribution of factor inputs required by outputs does not vary
Social Accounting Matrix
Indirect and induced effects on output, income and employment; by disaggregated household s, firms and other institutions, products, types of demand and other elements of the macroeconomy Changes in consumption by product or industry; changes in policy: tax rate, government spending, price inflation National output, income, employment, value added; product prices, wages rates; broken down by type of household, labor and capital source
Disaggregates households, firms and other institutions, products, types of demand and other elements of the macroeconomy according to analytical needs and data resources No standard methodology or presentation; same Boundaries as Input-Output model Computable General Equilibrium models
Indirect and induced effects on output, income and employment; prices and wage rates by industry Changes in consumption by product or industry; changes in policy: tax rate, government spending, price inflation National output, income, employment, value added; product prices, wages rates; broken down by type of household, labor and capital source
Allows factor of production prices to vary; effects of resource constraints covered; all markets clear No standard methodology or presentation; posited relationship equations, parameters, elasticities seldom made public; heavily dependent on assumptions requires massive input data that is seldom current; require validation against the actual economic
10
2.2. - The input-output model applied in tourism economic impact
The interest of economists in tourism dates back to the period immediately after the World War II at which the rapid increase in per capita income in the Western economies took place along with a dramatic reduction of transport costs which in turn gave rise to mass international and domestic tourism. In the 1970s, international tourism has become a key export being responsible for significant levels of production, income, employment and tax revenues of the recipient countries (Archer 1982). At the same time, domestic tourism has also become an important source of revenue for regions, countries, cities and recreation areas (Archer 1982). Not surprisingly, input-output models (or approaches inspired by it) have been used since 1960 to quantify the impact of international tourism on national economies of large, medium and small size, as well as regions, cities and recreation areas worldwide (Polo et al. 2008).
Throughout the years, research has been conducted concerning the economic impact of tourism both at national and regional levels (Song, Dwyer, Li and Cao, 2012). At the national level one can mention the studies of Munjal (2013) for India, Atan and Arslanturk (2012) for Turkey, Zhong, Hara, Ro and Dickson (2011) for Florida, Surugiu (2009) for Romania, Filho and Guilhoto (2008) for Brazil, Pao (2005) for Macao, Arabsheibani and Labarthe (2002) for Peru, Kweka, Morrisey and Blake (2001) for Tanzania. Input-output models have also been applied to tourist oriented countries such as the Seychelles (Archer et al., 1996) and Bermuda (Archer, 1995).
Archer (1995) analysed the contribution of tourist expenditures in the Bermudian economy, across three input-output studies, regarding the years of 1985, 1987 and 1992. The author investigated the contribution of tourism to exports, income, employment, and public sector revenue in Bermuda. Despite the fact that tourism appears to represent a significant contributor to the generation of income and revenue to the country’s economy, the study also shows a diminishing contribution of tourist expenditures to employment, particularly in the most recent year (1992) as compared to 1985 and 1987. Archer et al. (1996) evaluated the contribution of tourist expenditures on income by country of origin to the Seychelles economy. They concluded that tourist flows generated at various countries are associated with different impacts on the economy of
11 the Seychelles. Therefore, this type of comparative studies can represent a powerful tool for policy-makers.
Kweka et al. (2001) investigated the importance of the tourism sector in Tanzania, through input-output analysis focusing their attention on income, output, employment and tax revenue. They used the concept of multiplier to evaluate the significance of different sectors for the purpose of measuring, the international impacts of tourism expenditure in Tanzania. The authors concluded that tourism has a significant impact on output based upon strong inter-sector and linkages. In contrast, the income impact is insignificant, a result that is explained by the very low value added direct coefficient, due to the low level of wages in the sector. In Tanzania tourism shows potential to enhance economic growth.
Arabsheibani et al. (2002) used the Peruvian 1988 input-output table to analyse the effects of tourism expenditures on output, income and employment and to obtain the corresponding direct, indirect and induced effects. They concluded that tourism shows potential to generate significant economic benefits.
Filho et al. (2003) analyse the tourism contribution to the Brazilian economy concerning the year of 1999. The authors make use of an input-output matrix distinguishing between tourist and non-tourist sectors. The linkage index of Hirschmann-Rasmussen was also applied. The authors concluded by the existence of six key-sectors: regular air transportation, non-regular air transportation, travel agents and agencies, supporting activities of air transport, hotels and other types of temporary accommodation, restaurants and others food establishments. They stress the importance of implementing policies and programs to promote the development of the tourism sector in Brazil, as this sector contribute significantly to the growth of the economy. A study carried out by Pao (2005) on the economic impact of tourism in the Chinese province of Macao, also presented methods to measuring the economic impact of tourism: Input-Output, CGE Models and TSA. The author refers to the importance that tourism multiplier effect has in other activities in the economy.
Surugiu (2009) analysed the economic impact of tourism in Romania, measuring the impact on hotels and restaurants, through input-output analysis. The main objective was to determine the role and importance of different economic aggregates such as value added, income and employment and to analyse the existing connections within the
12 economy. The author defines tourism as one of the largest, dynamic as well-developed sector of the Romanian economy. To illustrate the above statement, the author argues that tourism shows high growth rates and considerable volumes of foreign currency inflows. Furthermore, it affects various sectors of the economy, which contribute positively to the development of the tourism industry. The study concludes that tourism has a considerable contribution to GDP, a situation that is explained by the high degree of intersectoral connection of the tourism industry with non-tourist sectors, thereby rendering the indirect effect of tourism expenditures quite a significant one.
Zhong et al. (2011), based upon the activity of tourism industry of the metropolitan area of Orlando as a case study, investigated the effect on tourism as a result of the economic crisis of 2007, in the American state of Florida. The authors used an input-output model to quantify the impacts. They found large discrepancies between actual figures and those estimated by the model and concluded that the input-output model has a tendency to overstate the negative impacts of tourism.
Atan et al. (2012) used the 2002 input-output table from Turkey to analyse the tourism impact on the Turkish economy. They concluded that tourism is not a crucial sector but it has important and significant impacts on the economy.
Results show that tourist sectors like hotels, restaurants and transports, use large amounts of inputs supplied by the non-tourist sectors. The tourism sector is so viewed as a structure that, at some extent, feeds many non-tourist sectors of the economy a circumstance that, ultimately, has a considerable impact on growth.
Teigeiro and Díaz (2013) undertook a cross-country study based upon a battery of indicators, such as: tourism income multipliers, imports multipliers and Rasmussen’s output multipliers. The authors used a sample of forty countries and concluded that the variables used to explain the size of tourism multipliers, namely the volume of tourists and the level of expenditure, were not found as statistically significant.
Munjal (2013) attempted to measure the economic impact of the tourism industry in India using TSA and Input-Output analysis. The author concluded that tourism activity favoured investment in the development of the tourism industry which not only enhance tourism activity but also stimulates growth in other industries. He also stresses the importance of tourism to be viewed as an industry and to be treated as such.
13 Frechtling (2011) emphasizes the importance of TSA to facilitate a better knowledge of tourism demand and their contribution to the economy as a whole. The author something here is lacking the fact that TSA can be worked out together with Input-Output models, SAM, and CGE models, in order to provide valuable information to policy-makers.
Martin-Fuentes and Sarda (2014) studied the economic impact of tourism resulting from Summer University courses, in Spain, using input-output models. They concluded for the existence of positive results translated to more revenue, due to higher levels of consumption in the city.
It can be readily concluded that most of the papers emphasize the importance of input-output to highlight the positive impact that tourism has on several economies, and its influence in the development of many productive sectors.
2.3. - Economic tourism impact: The Portuguese experience
The number of studies discussing the economic impact of tourism in Portugal is scarce. One example of such studies is provided by Bento and Santos (2012). In a similar fashion, studies focusing at the regional and local levels are also not too many. Some examples of the latter are Pereira, Bessa and Simões (2012), Silva (2009) and Eusébio (2006). Tourism is now recognized as a key sector within the set of productive activities of the country (Cunha 1997). The author refers that, in Portugal, tourism is very concentrated in the regions of Algarve, Lisbon and Madeira. Other regions of the country with a strong potential for tourism still wait development projects to be implemented. This may be partially explained by the fact that criteria for the development of Portuguese tourism projects are still based upon the same old fashion ideas of the early sixties; notably, the old fashion ‘sun & sea’ formula.
In fact, the scope of the country's tourism potential is much wider including many factors that contribute to enhancing its attractiveness: the favourable climate, the beauty of the coastline, the culinary diversity, rich heritage, culture and diverse physical environments offering multiple motivations within a relatively small geographical setting (Albuquerque and Godinho, 2001).
14 Pereira et al. (2012) examined the cultural and religious motivations for tourism at the local level. They focused their attention on the managers of hotels and restaurants of the northern city of Braga. The motivation of this study is to evaluate the tourist product ‘culture and religion’ thereby launching the bases for the tourist development of Braga and its surrounding area.
Pinto 2010, attempted about tourists in Lisbon more concretely what affect tourist satisfaction regarding Lisbon as tourism destination. This study was carried out based upon questionnaires. She concluded that the expectation of tourists was exceeded. Barros, Butler and Correia (2010) studied the impact of golf related activities in the Algarve. This research was based on questionnaires. The authors examined the impact of this sport on the length of stay and concluded for the existence of positive results. In Portugal there are some investigations based on input-output matrices. Some examples are: Eusébio (2006), Vaz, Belbute, Caleiro, Guerreiro and Eduardo (2012a) and Vaz, Belbute, Caleiro, Guerreiro and Eduardo (2012b).
Eusébio (2006) study was about evaluating the economic benefits of tourist expenditures to a particular tourist destination located at the Central Region of Portugal, using a rectangular input-output model that has been developed for the Central Region, for the year of 2003. Based upon an analysis of the daily expenditures of visitors, the Author concluded that housing and food and beverages were responsible for 64% of the total daily expenditure, followed by the acquisition of non-specific tourism products (fuel and services repair of motor vehicles and personal) representing about 23% of the total daily expenditure, while transport services occupy the fourth position with a share of 5.6%. However, this average structure of daily visitor spending shows statistically significant differences according to socio-demographic and economic profile of visitors and visit characteristics.
Vaz et al. (2012a) analysed the recent Portuguese experience of constructing regional input-output matrices. Namely, for the regions of the North, Centre, Algarve, Azores and Beira Interior. The authors highlighted the similarities and differences between the regions. In a separate investigation, the same authors constructed an input-output table for the Alentejo, region of Portugal, describing the various procedures and methodological issues involved with such exercise.
15
CHAPTER III - Methodology
3.1. - The input-output model
Presently, the basic concepts set forth by Leontief represent key components of many types of economic analysis and, indeed, input–output analysis is one of the most widely applied method in economics (Hara, 2008 and Baumol, 2000).
The basic Leontief input–output model is generally constructed from observed economic data for a specific geographic region (nation, state, country, etc.). It is concerned with the activity of a group of industries that both produce goods to outputs and consume goods from inputs other industries in the process of producing each industry’s own output (Miller et al., 2009).
The advantage of the input-output method is concerned with the use of the input-output table which allows one to take full advantage of the sectorial detail of the table.
Input-Output analysis has been extensively used to assess the economic impact of tourism on different national and regional economies. Some examples are those of Daniels (2004), Manente (1999), Herce and Sosvilla (1998), Freedman and Sultan (1997), Archer et al. (1996), Payeras and Sastre (1994), Briguglio (1993), Fletcher (1989), Archer (1985, 1995), Song and Ahn (1983), Santos, Oritz, Huang and Secretario (1983), Lin and Sung (1983), Fletcher, Snee and Macleod (1981), cited by Capó and Valle in 2008.
The input-output analysis has remote origins in Tableau Économique of Francois Quesnay, published in 1758. Quesnay divided French economy into three distinct classes: producers - farmers; owners - landlords; and sterile-class artisans and merchants. Quesnay gave a key contribution to the development of a general equilibrium system of Léon Walras contribution.
Frechting (2011) characterises the input-output model as have a shocks that can be analysed were the changes in consumption by product or in industry, the results of this method national output, income, employment, value added. The strengths well-understood are the standard methodology; standardized construction and presentation. The boundaries assumes no constraints an availability of factors of production; that
16 prices and wages do not vary; that distribution of factor inputs required by outputs does not vary.
The use of input–output models as a tool to estimating economic impacts of tourism has increased considerably in the past decades because of their ability to provide accurate and detailed information and the ease of interpreting the results (Fletcher 1989; Matias, Nijkamp and Sarmento, 2008). In its simplest form, the input-output model incorporated quite strong assumptions such as those that establish the exogeneity of the final demand components (consumption, investment and exports). Other important assumptions of the model are: absence of price substitution effects in both intermediate and primary factors; foreign exchange rates are fixed; employment is perfectly elastic, meaning that there will be on shortages of labour, the same being applied to other resources of the Economy. Finally, the critical assumption of the model is that of constant technical coefficients meaning that the demand for inputs is a fixed proportion of the output.
3.2. - Introduction to the input-output table
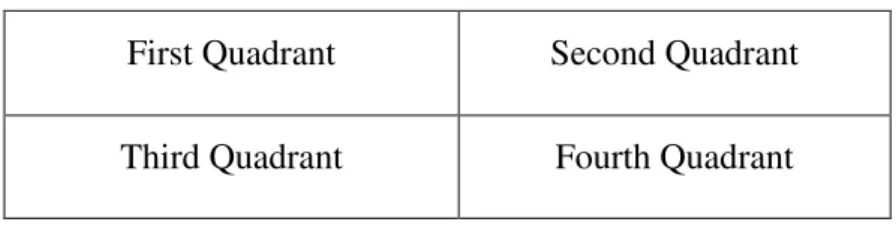
An input-output table represents economic transactions taking place in a certain geographical area during a specific period, usually one civil year (see Table 3.2.1.).
Table 3.2.1. – The four quadrants of an input-output table First Quadrant Second Quadrant Third Quadrant Fourth Quadrant
Source: Sargento, 2002
The first quadrant of the table is a crucial one, as it displays the complex of inter-industry relations taking place within the economy. In other words, cells in the first quadrant show purchases of intermediate inputs made by industry sectors. Each column of the first quadrant yields the intermediate input structure of a certain industry sector, whereas each row indicates the sectorial sales structures.
17 The second quadrant displays final demand flows occurring within the economy. Each cell shows the amount of a certain commodity (or service) to satisfy a certain component of final demand. Each column shows the structure of commodities supplied to satisfy the corresponding final demand component. For example, the column concerning household consumption shows how such aggregate is distributed across commodities and services. Analogously, each row shows how a certain commodity or service is distributed across final demand components (consumption, investment and exports).
The third quadrant records the use of the so-called primary inputs (labour, capital or land), made by industry sectors. Hence, each cell shows the payment for a certain primary input made by a certain industry sector. For example, the remuneration of labour made by agricultural companies is shown in the cell intersecting the row of wages and salaries and the column allocated to the agriculture sector. Generally speaking, the third quadrant includes information on the structure of Value Added (wages and salaries and operating surplus), intermediate imports as well as indirect taxes on production and subsidies on production.
Finally, the fourth quadrant comprises the primary factors directly consumed by final demand. For example, the cell intersecting the column of private consumption (one of the components of final demand quadrant) and the row of wages and salaries (one of the components of value added) shows payments by households by household services they use.
18 Table 3.2.2. – A national input-output table
1 2 … N 1 … K 1 Z F e X 2 … n m' 0 0 m 1 V 0 0 V … h x' y' e
Source: Adapted from Hoen (2002)
According to Hoen (2002), block Z denotes intermediate flow operations. Thus, it is the section of the matrix representing the interaction activity among productive sectors of the economy. It shows the complex of mutual dependencies within the production sphere of the economy. The generic term of the by matrix , denotes the intermediate deliveries from sector to sector .
A substantial fraction of the production is used directly for consumption or investment. The final demand blocks, and , include these deliveries. These contain flows of products used for consumption, investment, government expenditures, changes in inventories and exports. The generic element of matrix denotes the deliveries from sector to final demand category . The -vector contains flows of products to satisfy the needs of non-resident economic agents (exports).
In order to carry out their normal activities, productive sectors also require primary inputs, such as labour, capital and land. The utilization of primary inputs requires corresponding payments for labour (wages and salaries), capital (profits and interests), and land property (rents). All these operations are recorded in the third quadrant of the matrix through block which also includes net indirect taxes on production (indirect taxes less subsidies). Additionally, intermediate use of imported inputs is also included in this quadrant through vector ’. The generic term of matrix denotes the amount of the value added category used by sector . The -vector ’ contains total
19 intermediate imports per sector. Of course, if imports were known per sector of origin,
’ would become a square matrix of by size.
Summation over the elements of the rows of the input-output table yields a -vector of sectoral outputs. Summation over the elements of the columns of each category of final demands yields a vector of total macro-economic demand ’ and total exports . Summation over the rows of the input-output table yields total inputs per sector. Summation over of the elements of the rows of the – matrix yield a vector of total value added per sector . Similarly, summation over the elements imports total imports
.
The national input-output table for Portugal is actually a transactions table constructed on the principles of double-entry bookkeeping. The elements in a row of an input-output table denote the outputs of a sector. Output is measured as the sum of money paid to this sector to obtain commodities from this sector. Inputs are measured as the sum of money paid by this sector to obtain commodities from the other sectors and primary inputs. Hence, the double entries stem from the fact that the row displays where the money of sector came from (and the commodities went to) whereas the column shows where the money of a sector went to (and the inputs came from). Total inputs of a sector and total output of this sector are equal to each other.
From the input-output table one can derive several relations and coefficients.
For the sake of simplicity of notation, suppose that final demand and exports are aggregated into one -vector . Then, total output equals
= + (1)
where denotes a summation vector (every element is equal to 1) of appropriate length. In matrix form of intermediate demands can be expressed as,
= (2)
Solving equation (2) for gives,
= (3)
denotes a diagonal matrix of the elements of vector . The elements of matrix consist of input coefficients defined as the amount of product required per unit of
20 output . Mathematically, they are calculated by dividing the amount of input supplied to a certain sector to the output of that sector. In a formal manner:
= !
"! (4)
Substituting equation (2) into (1):
= + (5)
or,
= ( − ) = (6)
where is an identity matrix of appropriate dimension and is the Leontief inverse matrix derived from the input coefficient matrix . A sufficient condition for the existence of the Leontief inverse matrix is that no column sum is larger than 1 while at least one column is smaller than 1:
&* ≤ 1∀
+ and ∃ with & < 1∀
*
+ (7)
The Leontief inverse can also be expressed as a series of matrices based on the input coefficient matrix:
= .1 = + + / + 0
+2 + ⋯ (8)
In its simplest version, the input-output model assumes that matrix is constant over time, which implies that the input coefficients remain constant over time and for every level of output. The assumption of fixed inputs coefficients is associated with the so-called Leontief-type technology meaning that no substitution among inputs is possible. All inputs are required in fixed proportions implying a production process at constant returns to scale. Hence, if sector doubles its output, it must double every entry in the corresponding column of the input-output table.2 When the assumption of constant input coefficients is satisfied, it is possible to estimate total output in year 4 + 1 if final demand in 4 + 1 and the input-output table of the year 4 are known:
56 = 5 56 (9)
2 If the input-output table is expressed in money terms, this assumption will change slightly. Then, it is
assumed that if sector wants to double the value of its output, it has to double its expenses on every input.
21 Equation (9) determines output as a function of final demand. The assumed causality between final demand and total output shows how the Leontief inverse matrix handles indirect effects. Suppose, for example, that final demand of a country is known. This final demand is the direct effect: matrix times vector in equation (8). In order to satisfy the additional demand for their products, sectors buy inputs from each other, which is the first order indirect effect, matrix times vector , in equation (8). These inputs have to be produced as well, which requires additional inputs. Since this leads to another increase in demand, the process continues indefinitely, as reflected by the product of the matrices /, 0, etc., with the vector as in equation (8). These are the second and higher order indirect effects.
The process described above highlights the relationship between the input coefficients matrix (A) and the Leontief inverse (L). Matrix A contains the first order indirect effect,
i.e. an element displays the amount of commodity needed to produce one additional unit of commodity . The Leontief inverse matrix incorporates all indirect effects plus the direct effect (I). Element 8 therefore displays the total increase in the output of commodity as a result of one unit increase in the final demand for commodity .
It is possible to use equation (9) to computing the effects of an increase in final demand, assuming that 5 is fixed3. Post multiplying the Leontief inverse matrix by a vector final demand changes (∆ ) result in a vector with changes in total output caused by the shifts in final demand (∆ ). Again, the Leontief inverse matrix shows the direct and indirect effects: if the demand for agricultural commodities increases, the production of agriculture increases (direct effect), and consequently agriculture has to buy more inputs from the other sectors in order to produce the increase in demand (first order indirect effect). Hence, demand increases in other sectors as well, leading to an increase in production for all sectors. This additional production requires further additional inputs,
etc. (higher order indirect effects). Both the direct and the indirect effects of a one unit change in final demand are included in the Leontief inverse matrix. It shows the effects on total production of each sector due to a change in final demand of any sector or group of sectors.
22
3.3. - Data sources
The original aim of this dissertation is to estimate the impacts of tourism to the Portuguese economy, for the year of 2008.
In order to accomplish such a task, it was deemed useful to consult the existing database, provided by the INE. After some investigation it was decided to use the data contained in the National Accounts by activity sectors, including the input-output matrix for the year under study. The matrix used to evaluate the impacts is the national production input-output table at basic prices 2008 (P64 x P64), excluding imports. To assist this work it has become necessary to rely on a more disaggregated matrix, available on the work done by Dias and Domingos (2011), with this matrix 85x85 product-by-product, for the year 2008, in DPP. Those matrices provide detailed information on the national economy.
As far as tourism data is concerned, it was decided to use the TSA for 2008, also provided by the INE.
Input-output tables, as primary source of data, do not include an adequate classification of the tourism sector. Therefore, it was necessary to identify the tourist components of the elements composing the sectorial/product classification scheme of the Input-output matrices.
To obtain the necessary information for the measurement of the economic impacts of tourism activity on the national economy, it was necessary to combine the information of the input-output matrix with that of the TSA. Additionally, it was necessary to work out the aggregation scheme of the matrix products in order to isolate the products featured as specific to tourism, such as: accommodation, restaurants and transportation. The sectoral aggregation scheme contained in the TSA is as follows: 1. Agriculture, forestry and fishing; 2. Extractive industry; 3. Manufacturing industry: 4. Electricity, gas and water; 5. Construction; 6. Wholesale and retail trade, restaurants and hotels; 7.Transport and communications; 8. Business activities; and 9. Other service activities. The first step is looking at the information in the matrix and select the tourism products: “Water transport”; “Air transport”; “Accommodation”; “Restaurants”; “Rental services”; “Travel agency”; “Other tourism services”.
23 The second step is aggregating the remaining products in respect to their nature: for example instead of “Agriculture”, “Forestry” and “Fishing” put all together “Primary”. The same logic applies to “Extractive”. This activity is an aggregation of four products: coal, crude oil, natural gas produced and other extractive. As far as “Industry” is concerned, it is an aggregation of twenty three manufacturing products. In products “Energy” aggregate two products, the both matrices. “Construction” aggregates all construction activities: “Construction of building”, “Civil engineering works” and “Specialized construction works”. “Trade” aggregates three products. “Transport” aggregates over eight products, excluding water and air transport services, but this item aggregate the “Interurban railway transport” and “Long distance road transport” that has some importance for tourism activity. “Private services” aggregates over twenty products, representing the remaining private products. “Public services” aggregates over nine products consisting of public provisions by the Government and other public entities. Adjustment procedures lead to the generation of a 16x16 product-by-product matrix (see the aggregation in Annex A and Annex B).
Moreover, in order to attach extra realism to the analysis, it has been decided to further disaggregate the crucial sector “Accommodation and Restaurants”. To be more specific, this sector has been broken down into accommodation and restaurants, as it is well recognized that these two services are the most representative in terms of the typical tourist basket of goods. As it has done for the construction of the above matrix, it was necessary to readjust the product according to the TSA once again (see Annex B). Calculation of the Leontief inverse matrix requires some manipulation. The first step is obtaining the so-called intermediate input coefficients matrix by dividing the elements in each column of the intermediate flows matrix by its corresponding total. Then, the input coefficients matrix is subtracted from a conformable identity matrix to obtain the so-called Leontief matrix which must then be inverted, see in Annex D - Intermediate input coefficients matrix 16x16 sectors.
Annex D displays a (16x16) matrix containing the intermediate input coefficients of the Portuguese economy for the year of 2008. Interpretation of the elements of the matrix is quite straightforward. For example, the element located at the intersection of the third row with the first column (0,2371) denotes the value of “Industry” products required to produce one unit of primary products (agriculture, forestry and fishing). Similar interpretation applies to the other elements of the matrix.
24 The set of the elements pertaining to the column concerned to a certain sector yields the intermediate input structure of that sector. Hence, the set of elements at the first column of the matrix provides a representation of the input structure of the Primary activities sector.
Annex E shows the contents of the Leontief inverse matrix. Each element of this matrix provides a quantitative measure of the impact on a particular sector output resulting from a unit change in final demand for a certain type of product. Elements of the matrix are also known as simple output multipliers. For example, the element located at the intersection of the third row with the first column (0,415) denotes the impact on the output of the “Industry” as a result of a unit change in the final demand for primary products. Furthermore, the total value concerned the first row of the matrix indicates the impact on the output of the whole economy resulting from a unit change in the final demand for “Primary” products.
According to the TSA nomenclature, there is a distinction between Inbound Tourism (IT) and Domestic Tourism (DT), the former concerning to non-residents visitors and the latter to resident visitors. Data inserted in the 2008 TSA allows one to conclude that IT and DT are responsible for 59% and 41% of total Tourism Consumption on the Economic Territory, respectively. Furthermore, the structure of consumption of IT is also quite different from that of DT. In fact, 88% of IT total consumption concerns to specific products of Tourism, while for DT such figure stands about 94%. As far as the spending structure is concerned, the main distinctive features between those two segments of Tourism are: Some types of services such as those delivered by travel agencies and tour operators, recreation & leisure, transports and other tourism services, represent a relatively large share of total spending by domestic tourists. In contrast, non-resident tourists spend relatively more in accommodation (23.8% against 15.6%), connected products (11.2% against 2%) and non-specific products (12.3% against 5.8%). Also notice that the share of total spending allocated to restaurant and similar services is identical for both segments of tourists (one fourth of total spending).
To achieved the vector based on TSA in order to the matrix 16x16 was necessary aggregated the “Water transport”, “Air transport”, “Accommodation”, “Restaurants”, “Rental services”, “Travel agency” with “3.3 Water transport”, “3.4 Air transport”, “1. Accommodation services”, “2. Restaurants and similar”, “3.6 Transport equipment rental services” and “4. Travel agencies and other reservation services”, respectively.
25 For the other products the procedures was to “Industry” aggregated “Goods” (Connected and Non-specific products), “Trade” included “Distribution margins” (Connected and Non-specific products), “Transport” involved “3.1 Interurban railway transport”, “3.2 Long distance road transport”, “3.5 Transport supporting services” and “3.7 Maintenance and repair of transportation equipment”, “Private services” included “Services” (Connected and Non-specific products), and finally “Other tourism services” combined “5. Cultural Services”, “6. Sports and recreational services” and “7. Other tourism services”, see Annex F.
Setting up the appropriate matrices and vectors represents a fundamental part of this dissertation leading to measuring the impact of tourist expenditures on the Portuguese economy.
In order to obtained the tourism vector was necessary multiplied the matrix though the vector to get the vector with the tourism impact coefficients, see in Annex G.
26
CHAPTER IV – DISCUSSION OF THE EMPIRICAL RESULTS AND CINCLUSIONS
Firstly, it should be noted that, according to the results of this study, the impact of a one euro spending made by resident tourists does not seem to be much different with regard to non-resident tourists. Therefore, distinction between these two segments of tourists will be ignored throughout this study.
Total multiplier values obtained from the application of the input-output model are consistent with what would be expected for a relatively open and weakly integrated economy such as that of Portugal. Although the estimated value of the income multiplier (0,64) stands substantially below as compared to those reported in scientific journals for other countries, such discrepancy is actually explained by the fact that induced effects are not included within the estimate provided by the present study. For most cases, the induced effect account for a highly significant fraction of tourism multiplier estimates. The aforementioned income multiplier estimate means that, on average, for every euro spent by tourists in the Portuguese economic territory 64 cents of primary income are generated in the form of remuneration to production factors, such as wages and profits.
Looking at the results in more detail, it can be concluded that two major tourism characteristic activities (“accommodation” and “restaurant” services) represent the two most important items of tourist expenditure. Together, they account for 45.6% of total tourist expenditure (see Annex H). Also, in terms of their joint contribution to the main national macroeconomic aggregates such as gross output, income and employment, sectors producing the aforementioned services account for 4.1%, 5.4% and 5.8% of the respective national totals4.
4.1. - Income and employment impacts
Accommodation and restaurant services stand among the most important contributors to the Tourism wealth generation process, as they account for about one-third of the total