Orientador: Doutor João Paulo Miranda Ribeiro Borges, Professor Auxiliar, Faculdade de Ciências e Tecnologia da Universidade Nova de Lisboa
Co-orientadora: Doutora Coro Echeverria Zabala, Investigadora em Pós-Doutoramento, CENIMAT-I3N Departamento de Ciências de Materiais, Faculdade de Ciências e
Tecnolo-gia da Universidade Nova de Lisboa
Susana Cristina Silva Gil Marques
Licenciatura em Ciências de Engenharia de Materiais
Production and Characterization of Electrospun
Composite Fibers:
Confinement of Thermosensitive Microgels
Dissertação para obtenção do Grau de Mestre em Engenharia de Materiais
Setembro, 2015
Júri:
Presidente: Professor João Pedro Botelho Veiga
Arguente: Professora Ana Isabel Nobre Martins Aguiar de Oliveira Ricardo
iii Production and Characterization of Electrospun Composite Fibers: Confinement of Thermosensitive
Microgels
Copyright © Susana Cristina Silva Gil Marques, 2015.
v
‘You never know what is enough
unless you know what is more than enough
’
William Blake
vii
Acknowledgements/Agradecimentos
Antes de mais, expresso um enorme agradecimento ao meu orientador, Doutor João Paulo Borges por todo o apoio dado no decorrer deste trabalho, pelas sugestões e conhecimentos transmitidos, pelas palavras de incentivo, como também por me ter confiado esta tarefa. Um enorme agradecimento ao Doutor João Pedro Veiga pelo apoio incondicional e, pelas palavras que relativizam o maior dos dilemas na vida de qualquer aluno. Ao Doutor Rodrigo Martins, pelos desafios, oportunidades e incentivos à investigação, ao longo des-tes cinco anos.
Agradeço à minha co-orientadora, Doutora Coro Echeverria Zabala, não só por toda a ajuda na parte ex-perimental, mas também pelas correções na componente escrita. À parte de uma excelente co-orientadora és um exemplo, admiro-te como pessoa e como investigadora. Um enorme agradecimento por todos os bons momentos passados, pela paciência, compreensão e amizade. Por me teres transmitido a confiança em mim, que nem eu própria tenho. Se ultrapassei grande parte dos obstáculos foi graças ao teu apoio e aos teus conhecimentos. Aliás, se não fosse essa mente brilhante esta tese nem existiria, nem conheceria o meu atual melhor amigo (mais conhecido por PNIPAAm).
À Mestre Paula Soares, que devido a questões meramente burocráticas não consta também como co-orientadora desta tese, agradeço todo apoio e carinho demonstrado nesta fase final do teu doutoramento. Obrigada por todo o esforço, presença na fase laboratorial e pelas análises de FTIR, mas também pelas correções na componente escrita, formatações do documento e apreciações finais. Este tema também é teu. Fico à espera da tua magnífica apresentação para saber como “brilhar”.
Ao Doutor César Laia, expresso aqui a minha gratificação pelos conhecimentos transmitidos na preparação das amostras na técnica de DLS, pela disponibilidade e pelas palavras.
Ao Mestre Carlos João, obrigada por me ensinares a ver a escala numa micropipeta, mas mais que tudo um grande agradecimento pelo apoio e pelas conversas. Não ocupes as sessões de SEM dos outros e, arrasa na tese de doutoramento (“Já demos, obrigado!!”)
À Doutora Ana Baptista, expresso aqui a minha enorme gratificação por todo o tempo e apoio disponibili-zados, pela passagem de conhecimentos e pelas palavras sábias (caso contrário ainda odiaria o electros-pinning).
À Rita Pontes, do “isso está um grego” e “essa cara”, agradeço todo apoio nas fases mais complicadas. Obrigada pelas palavras de compreensão e de orientação durante as minhas crises existenciais, pelos cafés no “Cantinho da Lua” ou mais, recentemente “Na Cerca” mas sobretudo pela amizade.
À Tété, a única pessoa à face da Terra capaz de evitar que eu seja sistematicamente vítima de bullying, obrigada pelo apoio e pela capacidade que tens de transmitir calma. Aquela baba de camelo de comer e chorar por mais, como também os momentos de café sem álcool tiveram sem dúvida alguma um grande impacto na minha vida académica.
Ao Tiago Rio, o meu padrinho “académico”, por estares sempre presente nos momentos mais dramáticos da minha vida e, por toda a amizade e apoio. Mas, mais que tudo, obrigada pela paciência de me aturares mesmo quando já não tenho paciência para mim. Aqui só há frascos (os micro-ondas ainda estão em bom estado) se quiseres vir ajudar a limpar, estás à vontade.
À Mariana Castanheira (Marilu), por todos os momentos de pânico e alegrias divididas ao longo destes cinco anos e por nunca desistires de mim. Por nunca questionares a nossa amizade. Mas, também, por todas as longas e construtivas conversas partilhadas. Só porque a amizade não é espacial nem temporal, para o ano voltamos a limpar a casa.
Ao André Milho (o “migo do mau feitio”) por teres a proeza de ter um feitio pior do que o meu, mas mais que tudo pelas conversas, apoio e disponibilidade facultados. Mas, também, por me entenderes quando pouca gente consegue fazê-lo.
Ao Zé Rui, o meu migo lindo mais conhecido como “O Mágico”, obrigada por me teres apresentado o
software JMP e por me teres ajudado em todo a análise do desenho de experiência. Mas, acima de tudo, obrigada pelas conversas, pela amizade e por todo o carinho. Vai-te preparando, para o ano és tu. À Susana Oliveira, a minha “sósia”, amiga obrigada pela companhia nas horas de almoço na praia e nos turnos noturnos no lab 211. Quero, também, agradecer todo o apoio e amizade estupidamente importantes nesta fase da nossa vida. Agora está na hora de brilhares e, seguramente, estarei para te aplaudir. Ao Tomás Correia, do mau feitio mas com jeito para fazer tudo, obrigada por me ensinares a não ter medo de máquinas, pelo apoio e pelas palavras. Sobretudo agradeço teres escolhido o departamento de materi-ais para fazer a tese e, assim conhecer o amigo e pessoa que és.
ix À Ana Figueiredo (“A Fofi do coça-coça!!”), por partilhar o entusiasmo e alegria nas fases mais complicadas do lab 211. Adoro ter a imagem da tua barriga gravada no meu cérebro. Para o ano és tu e, espero que tomes a decisão que te faz mais feliz.
À turma (David, Ana, Micaela, Fernando, Mariana, Catarina, Paulo) obrigada pelas conversas, desabafos, risadas e apoio.
À Catarina Bianchi, a mais recente noiva, por todo o apoio, almoços, cafés e desabafos ao longo desta odisseia. Mais que tudo, um grande obrigada por todos os momentos e amizade. Daqui a uns anos temos de recordar estes momentos!
À Inês Ropio, obrigada pelas conversas e momentos, mas também por toda a disponibilidade na troca de turnos de electrospinning e pela ajuda disponibilizada. Agora temos de fazer uma jantarada.
Ao Ricardo Marreiros, por toda a delicadeza no trato e preocupação apresentada mesmo quando me revolto contra o mundo.
À Diana Paiva e à Tânia, por terem contribuído para o meu bem-estar na fase inicial da tese, pelos desa-bafos e troca de conhecimentos.
Aos meus meninos por todos os momentos que fizeram esquecer a tese e, por todo o apoio. Sem vocês não era a mesma pessoa.
Ao Tiago Infante, obrigada por escolheres MCP e apareceres no laboratório nos momentos em que preci-sava de desabafar ou do ombro amigo para chorar.
À Duda, à Yasmin e ao Bruno quero expressar um enorme agradecimento por mostrarem que a vida não é só trabalho.
Ao Mário Noras, pela disponibilidade de sempre, pelas palavras e pelas múltiplas tentativas de soldar um alvo para o setup de electrospinning.
Por último, mas mais importante, quero expressar o meu enorme agradecimento à minha família que sem-pre me apoiou e comsem-preendeu as crises de mau-humor. Por todo o carinho e consideração dados. Por acreditarem sempre em mim e, graças a vocês tornei-me na pessoa que sou atualmente.
xi
Abstract
Materials engineering focuses on the assembly of materials´ properties to design new products with the best performance. By using sub-micrometer size materials in the production of composites, it is possible to obtain objects with properties that none of their compounds show individually. Once three-dimensional materials can be easily customized to obtain desired properties, much interest has been paid to nanostructured poly-mers in order to build biocompatible devices.
Over the past years, the thermosensitive microgels have become more common in the framework of bio-materials with potential applicability in therapy and/or diagnostics. In addition, high aspect ratio biopolymers fibers have been produced using the cost-effective method called electrospinning. Taking advantage of both microgels and electrospun fibers, surfaces with enhanced functionalities can be obtained and, therefore employed in a wide range of applications.
This dissertation reports on the confinement of stimuli-responsive microgels through the colloidal electro-spinning process. The process mainly depends on the composition, properties and patterning of the precur-sor materials within the polymer jet. Microgels as well as the electrospun non-woven mats were investigated to correlate the starting materials with the final morphology of the composite fibers. PNIPAAm and PNIPAAm/Chitosan thermosensitive microgels with different compositions were obtained via surfactant free emulsion polymerization (SFEP) and characterized in terms of chemical structure, morphology, thermal sta-bility, swelling properties and thermosensitivity. Finally, the colloidal electrospinning method was carried out from spinning solutions composed of the stable microgel dispersions (up to a concentration of about 35 wt. % microgels) and a polymer solution of PEO/water/ethanol mixture acting as fiber template solution. The confinement of microgels was confirmed by Scanning Electron Microscopy (SEM). The electrospinning process was statistically analysed providing the optimum set of parameters aimed to minimize the fiber diameter, which give rise to electrospun nanofibers of PNIPAAm microgels/PEO with a mean fiber diameter of 63 ± 25 nm.
xiii
Resumo
A engenharia de materiais foca-se no aperfeiçoamento das propriedades dos materiais para a obtenção de novos produtos com desempenho melhorado. Mediante a utilização de materiais micrométricos para a pro-dução de compósitos é possível obter objetos com propriedades que nenhum dos seus componentes con-segue demonstrar individualmente. Muito interesse tem sido dado aos polímeros nanoestruturados para dispositivos biomédicos, uma vez que os materiais tridimensionais podem ser facilmente adaptados para obter as propriedades desejadas.
Ao longos dos últimos anos, os microgéis termossensíveis tornaram-se mais comuns no âmbito dos bio-materiais com aplicabilidade em terapia e/ou diagnósticos. Como também, as fibras biopoliméricas com elevado fator de forma (ou, coeficiente de esbeltez) têm sido produzidas usando o método de electrofiação. Tirando proveito tanto dos microgéis como das fibras electrofiadas, é possível obter superfícies com funci-onalidades aprimoradas e que podem ser empregues em uma ampla gama de aplicações.
A presente dissertação relata o confinamento de microgéis termossensíveis mediante o processo de elec-trofiação de colóides. O processo depende principalmente da composição, propriedades e padronização dos materiais percursores no interior do jato polimérico. De forma a correlacionar os materiais de partida e as membranas fibrilares electrofiadas, tanto os microgéis, como também as fibras compósitas foram inves-tigadas. Para tal, primeiramente, foram produzidos os microgéis termossensíveis de PNIPAAm e de PNI-PAAm-Cs através da polimerização por emulsão sem tensioativo. Neste seguimento, os microgéis foram caracterizados química, estrutural e morfologicamente, tendo-se também procedido à avaliação da estabi-lidade térmica, propriedades de inchamento e da termossensibiestabi-lidade. Finalmente, o processo foi realizado através de soluções de fiação compostas por dispersões estáveis de microgéis (com uma concentração máxima de 35% de microgéis em solução) e, uma solução de polietileno óxido/água/etanol atuando como matriz para a produção de fibras. Posteriormente, foi confirmado o confinamento dos microgéis através da análise de microscopia eletrónica de varrimento.
O processo de electrofiação foi analisado estatisticamente de forma a obter-se o conjunto ótimo de parâ-metros que visava minimizar o diâmetro das fibras. Deste modo, fibras de microgéis de PNIPAAm dispersos em fibras de PEO com diâmetro médio de 63 ± 25 nm foram obtidas.
xv
Contents
Acknowledgements/Agradecimentos ... vii
Abstract ... xi
Resumo ... xiii
Contents ... xv
List of Figures ... xviii
List of Tables ... xxii
Abbreviations ... xxiv
Symbols ... xxvi
Objectives ... xxix
1. Introduction ... 1
1.1. BRIEF INTRODUCTION:FROM POLYMER PHYSICS TO COLLOIDAL STATE ... 1
1.2. THERMOSENSITIVE MICROGELS ... 1
1.3. COLLOIDAL ELECTROSPINNING ... 3
1.4. DESIGN OF EXPERIMENTS AND SURFACE RESPONSE METHODOLOGY ... 6
2. Materials and Methods ... 7
2.1. MATERIALS ... 7
2.2. DEPOLYMERIZATION OF CHITOSAN ... 7
2.3. SYNTHESIS OF COLLOIDAL MICROGELS ... 7
2.4. DESIGN OF EXPERIMENTS IN ELECTROSPINNING RESEARCH ... 8
2.4.1. Design of experiments generation ... 8
2.4.2. Preparation of solutions for electrospinning ... 9
2.4.3. Colloidal electrospinning experiments ... 9
2.5. CHARACTERIZATION ... 10
3.1. THERMOSENSITIVE MICROGELS ... 13
3.2. CHEMICAL STRUCTURE OF CROSS-LINKING PNIPAAM AND PNIPAAM-CS MICROGELS ... 13
3.2.1. Swelling properties of PNIPAM-Cs microgels ... 15
3.2.2. Analysis of the autocorrelation function (cumulant method) ... 16
3.3. COLLOIDAL ELECTROSPINNING ... 18
3.3.1. Spinning solution and jet forming concentrations ... 18
3.3.2. Planning and analysis: surface response methodology ... 20
3.4. SURFACE MORPHOLOGY ANALYSIS ... 28
3.4.1. Effect of the concentration of microgels in spinning solution ... 29
3.4.2. Effect of the chitosan in microgels structure on fibers morphology ... 30
3.4.3. Effect of the molecular weight of chitosan in electrospun beads structures ... 31
3.4.4. Effect of the concentration of chitosan on topography of the fibers ... 32
4. Conclusions and Future Perspectives ... 35
5. References ... 38
6. Supporting Information ... 45
6.1. RESPONSE SURFACE METHODOLOGY ... 45
6.1.1. Planning the design of experiments ... 45
6.1.2. Regression analysis ... 48
6.2. DIMENSIONAL REPRESENTATION OF THE ADAPTED GROUNDED COLLECTOR ... 53
6.3. MOLECULAR WEIGHT OF CHITOSAN ... 54
6.4. COLLOIDAL STABILITY SYNTHESIS ... 55
6.5. FITR ANALYSIS ... 57
6.6. MICROGELS DISPERSIONS MORPHOLOGY ... 58
6.7. THERMOGRAVIMETRIC ANALYSIS ... 59
6.8. ANALYSIS OF THE AUTOCORRELATION FUNCTIONS ... 61
List of Figures
FIGURE 1.1-CHEMICAL STRUCTURE OF NIPAAM MONOMER (ADAPTED FROM [14]). ... 2
FIGURE 1.2–REPRESENTATIVE VOLUME PHASE TRANSITION TEMPERATURE MECHANISM OF PNIPAAM MICROGELS
TRIGGERED BY THE TEMPERATURE STIMULI IN AQUEOUS MEDIUM... 2
FIGURE 2.1–ADAPTED GROUND COLLECTOR USED IN THE ELECTROSPINNING EXPERIMENTS. ... 10
FIGURE 3.1-ATR-FTIR SPECTRUM OF DEPOLYMERIZED CHITOSAN (GREEN), SPECTRA OF PNIPAAM MICROGELS (BLUE) AND
REPRESENTATIVE PNIPAAM-CS MICROGELS SPECTRA (WINE). ... 14
FIGURE 3.2-DEPENDENCE OF HYDRODYNAMIC DIAMETER (DH) OF MICROGELS (A); EVOLUTION OF THE RELATIVE SWELLING
(D/DO);(B) WITH TEMPERATURE FOR SAMPLES PNIPAAM (CYAN),PNIPAAM-30%CS (1:50)(ORANGE),PNIPAAM -30%CS (1:33)(GREEN),PNIPAAM-40%CS (1:50)(MAGENTA), AND PNIPAAM-40%CS (1:33)(WINE). ... 16
FIGURE 3.3-DLS CURVES AS A FUNCTION OF TEMPERATURE FOR SAMPLES PNIPAAM-20%CS (1:50)(OLIVE) AND
PNIPAAM-40%CS (1:25)(BLUE)(A),EVALUATION OF THE MEASURED AND CALCULATED (RED) HYDRODYNAMIC
DIAMETERS FOR SAMPLES PNIPAAM-20%CS (1:50)(B), AND PNIPAAM-40%CS (1:50)(C) WITH THE TEMPERATURE TESTED RANGE... 17
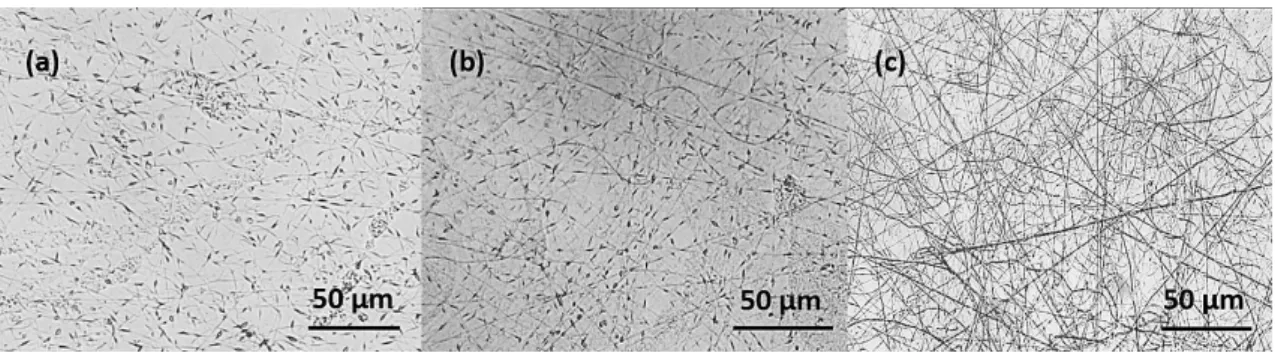
FIGURE 3.4-OPTICAL IMAGES OF THE REPRESENTATIVE SAMPLES WITH COMPOSITE COLLOIDS/PEO BEADS USING 0.4 WT. %PEO(A); SHORT PEO FIBERS AND MICROGELS BEADS USING 1 WT.%PEO(B), AND MICROGEL BEADS CONFINED IN
PEO MEDIUM AND LONG FIBERS USING A CONCENTRATION OF 2% WT.PEO(C)... 19
FIGURE 3.5-OPTICAL IMAGES OF THE REPRESENTATIVE SAMPLES WITH COMPOSITE COLLOIDS/PEO USING A CONCENTRATION
OF 2 WT.%PEO WITH 10%(V/V) ETHANOL (A)15%(V/V) ETHANOL (B),20%(V/V) ETHANOL (C). ... 20
FIGURE 3.6–RESPONSE SURFACES FOR THE MEAN FIBER DIAMETER IN TERMS OF:(A) APPLIED VOLTAGE AND WORKING
DISTANCE,(B) FLOW RATE AND APPLIED VOLTAGE,(C) WORKING DISTANCE AND SAMPLE CODE,(D) SAMPLE CODE AND FLOW RATE,(E) FLOW RATE AND SAMPLE CODE AND (F) WORKING DISTANCE AND FLOW RATE... 26
FIGURE 3.7-SEM IMAGES OF COMPOSITE PNIPAAM MICROGELS/PEO ELECTROSPUN NANOFIBERS USING THE OPTIMUM SET
OF PARAMETERS (15 KV,20 CM AND 0.6 ML/H) FOR A BEAD-ON-A-STRING MORPHOLOGY (A), FOR ULTRAFINE PEO
FIBERS WITH FEW PNIPAAM MICROGELS CONFINED (B), AND FOR PETAL BEADS STRUCTURES (C). ... 27
FIGURE 3.8-FIBER DIAMETER FOR THE ELECTROSPUN PNIPAAM MICROGELS/PEO NON-WOVEN MAT OBTAINED FROM THE
OPTIMUM SET OF PARAMETERS IN THE FRAMEWORK OF THE RSM WITH A MEAN FIBER DIAMETER OF 63 NM... 27
FIGURE 3.9-SEM MICROGRAPH OF PNIPAAM-20%CS (1:50) MICROGELS/PEO COMPOSITE FIBER USED IN DOE STUDY
xix
FIGURE 3.10-SEM MICROGRAPHS OF COMPOSITE FIBERS (A)PNIPAAM-20%CS (1:50) MICROGELS/PEO USED IN DOE
STUDY EXPERIMENT #25;(B)PNIPAAM-30%CS (1:50) MICROGELS/PEO USED IN DOE STUDY EXPERIMENT #3 AND
(C)PNIPAAM-40%CS (1:50) MICROGELS/PEO USED IN DOE STUDY EXPERIMENT #16... 30
FIGURE 3.11-SEM MICROGRAPHS OF COMPOSITE FIBERS (A)PNIPAAM-40%CS (1:25) MICROGELS/PEO USED IN DOE
STUDY EXPERIMENT #9;(B)PNIPAAM-40%CS (1:33) MICROGELS/PEO USED IN DOE STUDY EXPERIMENT #15 AND
(C)PNIPAAM-40%CS (1:50) MICROGELS/PEO USED IN DOE STUDY EXPERIMENT #21... 31
FIGURE 3.12-SEM MICROGRAPHS OF COMPOSITE FIBERS (A)PNIPAAM MICROGELS/PEO USED IN DOE STUDY EXPERIMENT
#1 AND (B)PNIPAAM-40%CS (1:50) MICROGELS/PEO USED IN DOE STUDY EXPERIMENT #24. ... 32
FIGURE 3.13-SEM MICROGRAPH OF THE REPRESENTATIVE COMPOSITE FIBERS WITH DEFECTS (A) PHASE SEPARATION
BETWEEN THE PNIPAAM-40%CS (1:25) MICROGELS AND THE PEO MATRIX OBSERVED IN DOE STUDY EXPERIMENT
#4,(B) WITH BURST-BEADS SHOWED BY PNIPAAM-40%CS (1:33) MICROGELS/PEO FIBERS IN THE DOE STUDY
EXPERIMENT #5, AND (C) RIBBON-LIKE STRUCTURES FOR PNIPAAM-40%CS (1:50) MICROGELS/PEO FIBERS WITH PRODUCED IN DOE STUDY EXPERIMENT #9. ... 33
FIGURE 6.1-OPTICAL IMAGES OF THE REPRESENTATIVE ELECTROSPUN FIBERS OF MICROGELS/PEO USING AN APPLIED
VOLTAGE OF 10 KV(A);15 KV(B) AND 20 KV(C). ... 46
FIGURE 6.2-OPTICAL IMAGES OF THE REPRESENTATIVE ELECTROSPUN FIBERS OF MICROGELS/PEO WITH A WORKING
DISTANCE OF 13 CM (A);20 CM (B) AND 27 CM (C). ... 46
FIGURE 6.3-OPTICAL IMAGES OF THE REPRESENTATIVE ELECTROSPUN FIBERS OF MICROGELS/PEO USING A FLOW RATE OF
0.1 ML/H (A) AND 0.5 ML/H (B). ... 47
FIGURE 6.4-DIMENSIONAL CHARACTERIZATION IN MILLIMETERS OF THE GROUND COLLECTOR USED IN ELECTROSPINNING
SETUP. ... 54
FIGURE 6.5-MACROSCOPIC PHOTOGRAPHS OF THE AS-PREPARED MICROGELS DISPERSIONS: STABLE (A) AND NON
-STABLE/PRECIPITATES (B). ... 56
FIGURE 6.6-INFRARED SPECTRA OF PNIPAAM MICROGELS (BLUE) AND NIPAAM MONOMER (GREEN). ... 57
FIGURE 6.7-INFRARED SPECTRA OF THE REPRESENTATIVE PNIPAAM-40%CS (1:50) MICROGELS (BLUE),PNIPAAM-30%CS
(1:50) MICROGELS (RED) AND PNIPAAM-20%CS (1:50) MICROGELS (GREEN). ... 58
FIGURE 6.8-REPRESENTATIVE SEM MICROGRAPHS FOR (A)PNIPAAM MICROGELS,(B)PNIPAAM-20%CS MICROGELS, AND
(C)PNIPAAM-40%CS MICROGELS. ... 59
FIGURE 6.9-THERMAL DEGRADATION FOR THE SAMPLES DEPOLYMERIZED CHITOSAN (GREY),PNIPAAM (RED),PNIPAAM
-20%CS(1:50)(BLUE),PNIPAAM-30%CS(1:50)(GREEN), AND PNIPAAM-40%CS(1:50)(PURPLE) IN TGA CURVES
(A) AND DTG CURVES (B). ... 60
FIGURE 6.10-REPRESENTATIVE AUTOCORRELATION FUNCTION CURVES CORRESPONDING TO PNIPAAM MICROGELS
FIGURE 6.11-SEM MICROGRAPH OF COMPOSITE FIBERS USED IN DOE STUDY EXPERIMENT #1(A1),#2(A2),#3(A3),#4
(A4),#5(A5), AND #6(A6).INSET OF FIGURE A6 CORRESPOND TO SEM SCALE. ... 63
FIGURE 6.12-SEM MICROGRAPH OF COMPOSITE FIBERS USED IN DOE STUDY EXPERIMENT #7(B1),#8(B2),#9(B3),#10 (B4),#11(B5), AND #12(B6).INSET OF FIGURE B6 CORRESPOND TO SEM SCALE. ... 63
FIGURE 6.13-SEM MICROGRAPH OF COMPOSITE FIBERS USED IN DOE STUDY EXPERIMENT #13(C1),#14(C2),#15(AC), #16(C4),#17(C5), AND #19(C6).INSET OF FIGURE C6 CORRESPOND TO SEM SCALE ... 64
FIGURE 6.14-SEM MICROGRAPH OF COMPOSITE FIBERS USED IN DOE STUDY EXPERIMENT #20(D1),#21(D2),#22(D3), #23(D4),#24(D5), AND #25(D6).INSET OF FIGURE D6 CORRESPOND TO SEM SCALE. ... 64
List of Tables
TABLE 2.1-AMOUNT OF NIPAAM,CS,MBA,APS AND SBS USED IN THE EMULSIONS REACTION BY SURFACTANT FREE
EMULSION POLYMERIZATION. ... 8
TABLE 2.2-RATIO OF MASS MICROGELS-TO-MASS PEO POLYMER FIBER MATRIX. ... 9
TABLE 3.1-STABLE MICROGELS DISPERSIONS AND THEIR LCST IN AQUEOUS MEDIUM. ... 16
TABLE 3.2-SUMMARY OF THE RESULTS FROM THE STATISTICAL ANALYSIS OF THE MODEL OF THE MEAN FIBER DIAMETER. .... 21
TABLE 3.3-TEST ON INDIVIDUAL COEFFICIENTS FOR THE MODEL OF MEAN FIBER DIAMETER. ... 22
TABLE 3.4-SPINNING SOLUTION CODE, STATISTICAL TERM AND RESPECTIVE CONCENTRATION OF MICROGELS. ... 23
TABLE 3.5-DIAMETER AND STANDARD MEAN DEVIATION OF THE ELECTROSPUN COLLOIDAL PARTICLES BY DLS AND SEM
ANALYSIS. ... 29
TABLE 6.1-RANDOM MATRIX OF DESIGN OF EXPERIMENTS PROVIDE BY JMP SOFTWARE. ... 47
TABLE 6.2-CONSTANT VALUES OF THE SOLUTION CONCENTRATION LEVELS. ... 50
TABLE 6.3-INDICATOR PARAMETRIZATION ESTIMATES (TERMS) AND P-VALUES. ... 51
TABLE 6.4-MOLECULAR WEIGHT AND VISCOSITY OF THE DEPOLYMERIZED CHITOSAN SAMPLES. ... 55
TABLE 6.5-STABLE AND NON-STABLE AS-PREPARED MICROGELS DISPERSIONS. ... 56
TABLE 6.6-WEIGHT LOSS RELATED TO EACH AS-PREPARED MICROGELS DISPERSIONS. ... 61
TABLE 6.7-MEAN FIBER DIAMETER AND MEAN MICROGELS DIAMETER RELATED TO EACH RUN IN DOE ELECTROSPUN
Abbreviations
APS Ammonium Persulfate
ATR Attenuated Total Reflectance ACF Autocorrelation Function
Cs Chitosan
ES Electrospinning
DD Deacetylation Degree
DoE Design of Experiments DTG Derivative Thermogravimetric
DMF Dimethylformamide
FTIR Fourier transform infrared FIB Focus Ion Bean
LCST Lower Critical Solution Temperature LSM Least Square Method
MBA N, N-methylene bis-acrylamide MFD Mean Fiber Diameter
MNPs Magnetic Nanoparticles
MSH Mark-Houwink-Sakurada
OM Optical Microscopy
PCL Polycaprolactone
PEO Poly(ethylene oxide) PLLA Poly (L-lactic acid)
PNIPAAm Poly (N-isopropylacrylamide) PS Polystyrene
xxv PVP Polyvinylpyrrolidone
RSM Response Surface Methodology RSV Relative Swelling Volume
SBS Sodium Persulfate
SEM Scanning Electron Microscopy
SFEP Surfactant Free Emulsion Polymerization TGA Thermogravimetric Analysis
Symbols
V Applied Voltage
Dh Hydrodynamic Diameter
µ Ionic strength
d Working distance
Q Flow Rate
w/w Mass fraction
wt. Mass Total
w/v Mass to volume fraction
Mw Molecular weight
C1 PNIPAAm-40%Cs(1:25) microgels/PEO spinning solution C2 PNIPAAm-40%Cs(1:33) microgels/PEO spinning solution C3 PNIPAAm-40%Cs(1:50) microgels/PEO spinning solution C4 PNIPAAm-30%Cs(1:50) microgels/PEO spinning solution C5 PNIPAAm-20%Cs(1:50) microgels/PEO spinning solution C6 PNIPAAm microgels spinning solution
R2 Root mean square NaOH Sodium Hydroxide
ϕ Viscometer capillary diameter
η Viscosity
xxix
Objectives
The main objective of this work is to confine thermosensitive microgels in a fibrous matrix by means of the electrospinning process to obtain multifunctional nanostructured non-woven mats with high aspect ratio, which could have potential applications in materials science and biomedical engineering.
The encapsulation of stimuli-responsive PNIPAAm microgels through the electrospinning process gives rise to composite systems that combine the microgels swelling ability with the interesting features of the ultrafine surrounding fiber matrix. Additionally, it promotes a structural configuration able to build tailored roughness surfaces which can be progressively activated and further used to produce fast thermoresponsive devices. To understand how electrospinning process parameters affect the outcome of the composite colloids/poly-mer nanofibers production, PNIPAAm and PNIPAAm/chitosan microgels were previously prepared by rang-ing the concentration and molecular weight of chitosan polymer. By alterrang-ing the processrang-ing parameters and microgels’ composition, electrospun composite nanofibers were found to be differently patterned by the thermosensitive microgels.
1
1.
Introduction
1.1.
Brief Introduction: From Polymer Physics to Colloidal State
Pierre-Gilles de Gennes, in his Nobel lecture in 1991, described the colloidal systems with the expression “ultra divided matter” [1]. These fascinating materials are related to an intermediate particle size between solutions of low molecular weight and suspensions [2]. In general, colloidal materials consists of an ensem-ble of microscopic particles dispersed (1-100 nm) in a continuous phase [3]. Among all colloidal systems the sub micrometer-sized hydrogel (microgels) particles should be highlighted. Microgels are intra-molecu-larly cross-linked polymer particles of colloidal size (between 0.1 and 100 µm size) that swell in suitable solvents [4–6]. Depending on their composition, the solvent-particles interactions can be controlled via ex-ternal stimuli such as temperature, pH, electric field, magnetic field, ionic strength, chemical or biological impulses and light [7–9]. The presence of hydrophilic groups results in solvent retention, whereas the swella-bility is limited by the cross-linking density and solvent quality [9].
Over the past decades, these smart materials have received much attention owing to their environmentally tunable sizes and potential applications, such as chemical separation, catalysis, sensors, enzyme immobi-lization and drug delivery systems [10–12].
1.2.
Thermosensitive Microgels
Thermosensitive microgels are colloidal particles that can switch their size under a specific range of tem-perature by interacting with suitable solvents. Since first reported by Pelton and Chibante in 1986 [13], much attention have been paid to poly(N-isopropylacrylamide) (PNIPAAm) microparticles and its negative thermo-reversible behavior close to body temperature. This polymer possess a Lower Critical Solution Temperature (LCST) below which the polymeric chain remains hydrated (“coil” form) and evolves toward a more cohesive state (recognized as a “globule” form) above this critical temperature [14]. The LCST of linear PNIPAAm was found to be close to 32ºC in aqueous medium [15].
has acrylamide (hydrophilic) and isopropyl (hydrophobic) groups. Below the LCST, water forms intermolec-ular hydrogen bonds with the acrylamide groups. However, as the temperature increases, above LCST, these hydrogen bonds become weaker [12].
Figure 1.1 - Chemical structure of NIPAAm monomer (adapted from [14]).
This “coil-to-globule” transition is also reflected in the behaviour of cross-linked PNIPAAm microgels. At room temperature, the hydrophilicity of PNIPAAm microgels leads to a highly swollen state. When heated above the critical temperature, the responsivity appears as a volume collapse arising from the expulsion of the solvent (water). This critical temperature is thus referred to as the Volume Phase Transition Tempera-ture (VPTT), which may or may not be same as the LCST [17]. That balance could be affected by the naTempera-ture of the substituent groups, molecular weight, co-solvents, surfactants and salts [18, 19]. The swelling/de-swelling mechanism is driven by the free energy competition related to polymer-solvent systems upon heat-ing. The nitrogen and oxygen rich domains of PNIPAAm are hydrophilic (which mainly contribute for the enthalpy term) above and below the LCST. Nevertheless, at high temperatures the interactions between the domains of isopropyl groups within the backbone of PNIPAAm are energetically more favourable (high con-tribution of the entropy term) compared to the solvent-isopropyl interactions that leads to the phase separa-tion between the microgels dispersions and the surrounding medium (Figure 1.2) [20, 21].
3 PNIPAAm microgels can be produced by surfactant-free emulsion polymerization (SFEP) in which a radical polymerization of the NIPAAm monomer takes place in the presence of a water soluble cross-linker [11]. This radical polymerization is started by a thermal initiator, with a decomposition temperature well above the LCST of NIPAAm. Due to the hydrophobic character of the growing PNIPAAm chains, they collapse into aggregates up to a critical size (known as precipitation stage) that exceeds the solubility limit of the solvent (water). At this point the so-called precursor particles tend to form colloidal stable particles. Finally, the reaction ends up by decreasing the temperature or by inhibition with oxygen.
PNIPAAm microgel surfaces have been conjugated with specific polymers to promote desirable biodegra-dability [22] and affinity to encapsulate magnetic nanoparticles [11]. For such purpose, in the present work the chosen polymer was chitosan (Cs). This abundant biopolymer, which derives from the partial deacety-lation of chitin (major component of the exoskeleton of crustaceans), has numerous attractive properties namely, biocompatibility, biodegradability, easy assimilation/excretion and nontoxicity [22–24]. Besides, an-other remarkable characteristic is the pH sensitive behavior demonstrated by this polysaccharide due to the presence of free amines groups along the chitosan backbone [24].
This dissertation reports on the preparation of PNIPAAm and PNIPAAm/Cs thermosensitive microgels as precursor systems by means of SFEP in the presence of MBA cross-linking agent, varying the molecular weight and concentration of Cs polymer. In a forward stage we will focus on the confinement of these mi-crogels within PEO fibers through the most popular technique to customize ultrafine polymeric fibers, known as electrospinning.
1.3.
Colloidal Electrospinning
Electrospinning is an inexpensive and effective process to yield functional fibers with potential applications in materials and biomedical engineering, as it has been already proved for a variety of polymers [25]. This process becomes recognized by the simplicity in producing fibers with remarkable aspect ratio, tunable inter-fiber porosity and flexibility [26]. It involves the application of an electrostatic force to generate a polymeric jet towards a collector electrode. In spite of a simplistic setup, the theory behind this technique is not as simple since the process occurs in three stages, namely: initiation of the jet, elongation and fiber formation [25, 26]. This can be evidenced by the summarized achievements around the prevention of electrospray and beaded fibers, which is supposed to occur with spinning solutions of low-molecular weight polymers or low surface tension [27, 28]. In addition, the properties of solution also can compromise the formation of Taylor cone and even the start of the process itself [25, 29].
particles in spinning solution enables the production of continuous fibers by employing low-molecular weight polymers or even from dilute polymer solutions [29]. Furthermore, it allows the formation of core-shell fibers from a single-nozzle offering a much simpler setup than coaxial electrospinning for which two or more nee-dle-tips are needed [30, 31].
Fiber formation from colloids usually requires the presence of small amounts of a fiber template to promote additional viscosity. However, if the concentration of particles is sufficiently high, the process can occur without a polymer fiber matrix as shown by Piperno et al [30]. Since there are enough particles to encom-pass, the congregation of colloids is routed to a single fiber formation.
One of the benefits of colloidal electrospinning is to modulate the localization of particles to near or on the surface of the fibers designing a desired topography. The morphology presented by colloids/polymer fiber composites can be differentiated as either core-shell [31], bead-on-a-string [32], spindle-like [33], or a dis-persion of the separated phase within the polymer fiber matrix [34]. These morphological characteristics should be understood based on the evolution of the structures from the precursor colloids to final electrospun composite fibers. Reliable bead-on-a-string morphologies have a standard distribution along the fiber sur-face, which only can be achieved by using monodispersed colloids [35]. The spindle-like structure is con-sidered as particular form of beads, where the notable protrusions are a result of clusters. Aqueous spinning polymer solutions present more complexity since the colloids distribution along the fiber could be affected by the water-to-polymer ratio as a result of their behavior in aqueous medium [30, 36]. In case of the hydro-philic colloids is expected that the particles will be completely entrapped into fiber matrix due to their affinity to the continuous phase [37].
It is important to notice that beyond the size of particles, the concentration of cross-linked colloids disper-sions play an important role on structural features. Somehow, multi-levels of stretching and breakup of the dispersed phases could occur in the entire electrospinning process. Angeles et al. demonstrated that the
non-dispersed particles can breakup in the Taylor cone itself, whereas the smaller ones could break
down-stream in the jet [35]. Besides, Hu et al. reported the elongation of the entrapped particles as a consequence of high electrostatic forces, and found that increasing the PS particle contents results in the decrease of
average distance between adjacent spheres within PVA fibers [33].
Another attractive characteristic is the formation of hollow fibers by removing the core with a simple step such as calcination or solvent extraction. Employing this type of approach in spinning solutions with high feed of particles, fibers with a corn-type structure were produced [30]. Alternatively, a post-crosslinker treat-ment can be performed in order to obtain non-soluble shells or stable fibers [30, 38].
5 biological agents either in a mixture of drug emulsified in a polymer solution [33, 39], or as an emulsion core spinning with a polymer solution acting as the shell of the fiber [31]. Numerous authors have demonstrated the effective encapsulation of immiscible drugs inside electrospun fibers and provided further sustained release of the drug [39–46].
The fascinating reproduction of core-shell structures using the single-nozzle electrospinning has spread to several studies based on the idea of adding insoluble polymeric particles in spinning solutions [30, 35]. In this sense, the confinement of stimulus-sensitive microgels in fibers by means of colloidal electrospinning could be an interesting approach towards the production of multifunctional fibers with fast thermoresponsive behavior and super-hydrophobic tunable surfaces. That may be used in drug delivery systems, bio-sensing, chemical separation, catalysis and optics [32, 47].
Few studies reported the confinement of cross-linked PNIPAAm microgels inside nanofibers. For instance, Nieves et al. produced composite electrospun fibers of PNIPAAm microgels (up to 40% of microgels per-centage mass) using PVP (which is a hydrogel itself) as fiber template with a mean fiber diameter of 0.9 µm [47]. Tunable surfaces of electrospun non-woven mats with PNIPAAm microgels/PLLA fibers in which the production of fibers with a mean fiber diameter of 284 nm connected to bead sizes of 3.4 µm with a spindle-like structure was reported by Gu et al. [32]. It is noteworthy that in these studies, the dried microgels were dispersed in organic solvents such as DMF, chloroform and dichloromethane.
At this point we have already described the versatility of the electrospinning technique, the particularity of colloidal electrospinning and the morphologies that are acquired depending on the spinning colloidal disper-sion. However, there are important processing parameters that highly affect the morphology and topography of the electrospun fibers, namely, polymer concentration, flow rate, applied voltage, working distance and environmental conditions [25, 26]. In literature the effect of the processing parameters were widely studied for solution electrospinning, which can be similarly described for the systems involving the use of colloids and fiber polymers matrix. For instance, the reduction of the polymer concentration leads to a decrease on fiber diameter, whereas increasing the flow rate has the opposite effect [26]. Higher voltages were found to have a critical influence on the surface roughness of electrospinning non-woven mats [48], while low working distances are required to obtain interconnected melted fibers [49]. Additionally, environmental high relative humidity can be used in order to produce circular pores on the fibers [48].
1.4.
Design of Experiments and Surface Response Methodology
Design of experiments (DoE) is a useful approach for exploring the significant parameter effects and opti-mum conditions in electrospinning process. As mentioned, the optimization of the process by performing all possible combinations of factor experiments by single factor experiments, called one-variable-at-a-time, could be expansive and sluggish. Consequently, several variables and interactions between factors should be explored by a multifactorial DoE [50].
Amongst all statistical analysis, Response surface methodology (RSM) excels by the outstanding multivar-iable approach. RSM consists of a collection of mathematical and statistical techniques that are based on the fit of empirical models to the experimental data. It is widely used to maximize or minimize the measured response, which has the advantage of taking into account the main variables and their combined effects to generate numerical approximations. The empirical model implies the use of low-order polynomials instead of local approximations to the real input/output relationship [50, 51]. Another useful assessment of the model is that the main parameters and interaction between parameters can be selected from the many less im-portant ones, and therefore the optimum set of parameters is predicted in accordance with the goal re-sponse.
As a part of our study, we will produce and characterize the electrospun nanocomposites incorporating
stimuli-responsive microgels by means of colloidal electrospinning. It deals with the optimization of the pro-cessing parameters for electrospun nanofibers of PEO through RSM, and the incorporation of the microgels into fibers to examine changes in the morphology.
7
2.
Materials and Methods
2.1.
Materials
N-Isopropylacrylamide (NIPAAm, Aldrich Chemistry, 97%) was used as monomer and N, N-methylene bis-acrylamide (MBA, Sigma-Aldrich, 99%) as cross-linker, ammonium persulfate was chosen as initiator (APS, Sigma-Aldrich, 99%) and sodium persulfate (SBS, Acrös Organics) as catalyst. All the reagents were used as received without any further purification. High molecular weight chitosan (Cs, 470 kDa) was purchased from Cognis and glacial acetic acid was acquired from Panreac.
2.2.
Depolymerization of chitosan
The depolymerization of chitosan was performed using oxidative fragmentation accomplished with the de-polymerization agent sodium nitrite at room temperature to obtain low molecular weight chitosan samples. Briefly, chitosan 1% (w/v) was dissolved in 2% (v/v) acetic acid solution. When chitosan was completely dissolved, the adequate amount of 0.2 M sodium nitrite (EKA) solution was added dropwise for 1 h under mechanical stirring (at 750-1000 rpm). The reaction mixture was neutralized with 4.0 M NaOH (Merck) so-lution to precipitate the chitosan (which occurs at approximately pH = 8). The resulting suspension was recovered by centrifugation (at 10000 rpm for 20 minutes), washed several times with distilled water and dried by lyophilisation (VaCO2, Zirbus Technology).
2.3.
Synthesis of colloidal microgels
microgel dispersions were dialyzed against distilled water using a dialysis Spectra/Por molecular porous membrane. Table 2.1 contains in details the recipes followed for the prepared microgel synthesis.
For the preparation of PNIPAAm-Cs microgels, 1 wt.% of depolymerized chitosan was previously dissolved in 50 mL of acetic acid solution for 24 h. Firstly, the chitosan solution was added to the reactor before following the polymerization process methodology mentioned above.
Table 2.1 - Amount of NIPAAm, CS, MBA, APS and SBS used in the emulsions reaction by surfactant free
emulsion polymerization.
Sample Code NIPAAm (g) Cs (g) MBA (g) APS (g) SBS (g)
PNIPAAm 2.5 -- 0.25 0.25 0.125
PNIPAAm-20%Cs (1:25)
1
0.2
0.1 0.1 0.05
PNIPAAm-20%Cs (1:33)
PNIPAAm-20%Cs (1:50)
PNIPAAm-30%Cs (1:25)
0.3
PNIPAAm-30%Cs (1:33)
PNIPAAm-30%Cs (1:50)
PNIPAAm-40%Cs (1:25)
0.4
PNIPAAm-40%Cs (1:33)
PNIPAAm-40%Cs (1:50)
2.4.
Design of experiments in electrospinning research
2.4.1.
Design of experiments generation
9 working distance combinations. The acquired D-optimal design with 27 runs is shown in supplementary information (section 6.1.1).
2.4.2.
Preparation of solutions for electrospinning
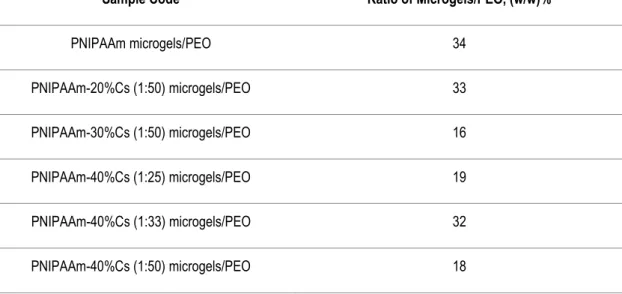
For the fiber template the biocompatible polymer PEO (Sigma Aldrich, Mw = 5.000.000) dissolved in water and ethanol (Scharlau, analytic grade) was used. Solution preparation began by dissolving 2 wt.% of PEO into mixed solvent water/ethanol at the volumetric ratio of 80:20, respectively. These mixtures were mag-netically stirred for 4 h to ensure the complete homogenization of the spinning fiber template solution. After that, the spinning colloidal solutions were prepared by adding the microgels dispersions to the as-prepared solutions of PEO in a ratio of 1:1 (v/v) under constant stirring for 2 h. Table 2.2 summarizes the ratio obtained for the mass of microgels in respect to the mass of PEO into the described spinning solutions.
Table 2.2 - Ratio of mass microgels-to-mass PEO polymer fiber matrix.
Sample Code Ratio of Microgels/PEO, (w/w)%
PNIPAAm microgels/PEO 34
PNIPAAm-20%Cs (1:50) microgels/PEO 33
PNIPAAm-30%Cs (1:50) microgels/PEO 16
PNIPAAm-40%Cs (1:25) microgels/PEO 19
PNIPAAm-40%Cs (1:33) microgels/PEO 32
PNIPAAm-40%Cs (1:50) microgels/PEO 18
2.4.3.
Colloidal electrospinning experiments
Figure 2.1 – Adapted ground collector used in the electrospinning experiments.
A set of 27 experiments were performed following the generated design of experiments (DoE), as presented in section 6.1.1 of the supplementary information. The solutions (see Table 2.2) were transferred to a 3 mL plastic syringe fitted with a 23-gauge blunt tip needle and loaded into a syringe pump programmed to deliver the polymeric solutions at 0.5, 0.6 or 0.7 mL/h, while the working distance from needle tip to collector was 13, 20 or 27 cm. A voltage of 10, 15 or 20 kV was applied to the needle tip of the syringe to perform the electrospinning experiments. The process was carried out in a climatic cabin where the temperature was controlled to be slight above of LCST of each incorporated microgels sample, while the relative humidity was adjusted between 20-40% for the rapid evaporation of solvents mixture. An aluminum sheet covered by a blue paper and overlaid by a rectangular ground electrode (covered with aluminum foil) was used to collect the nanofibers. The schematic illustration and details of dimensional collector´s features are repre-sented in supplementary information (section 6.2). Electrospinning was run for about 4.5 h and a white non-woven mat of composite nanofibers was obtained. The resulting non-non-woven mats were vacuum dried at room temperature for 24 h to remove any water residues.
2.5.
Characterization
11 fixed on conductive carbon tape, mounted on the support and then sputtered with a thin layer of gold/palla-dium (8-10 nm) using a Q300T D Quorum sputter coater. The diameter and distribution of the electrospun nanofibers were analyzed from SEM images by applying an analysis tool of ImageJ software. At least 50 dried microgels were measured for the minor axis (perpendicular to length fiber) and about 100 fibers were measured to obtain the average fiber diameter per SEM micrograph.
Dynamic light scattering (DLS) technique was used to determine the hydrodynamic diameter of microgels and their behavior with temperature in aqueous medium. The equipment used is a Horiba SZ-100 Nanopar-tica Analyzer light scattering instrument equipped with a 592 nm wavelength He-Ne laser for a fixed angle of 90º and a Peltier system (25ºC) to control the temperature. All measurements were carried out for diluted suspensions in a temperature range from 25º to 45ºC within disposable cuvette cells.
For the analysis of the chemical structure Fourier transform infrared (FTIR) transmission spectra were rec-orded at room temperature on the dried microgels using a FTIR Thermo Nicolet 6700 spectrophotometer. FTIR spectra were collected using an attenuated total reflectance (ATR) accessory equipped with a single-bounce diamond crystal with an incident angle of 45º, scanned from 4500 to 500 cm-1, a resolution of 0.4 cm-1 at 20ºC and are a result of 32 scans.
The thermal properties of the synthesized microgel samples were analyzed using the Thermogravimetric analysis technique (TGA), in a Thermogravimetric Analyzer NETZSCH STA 449F3. The tests were per-formed for previously freeze-dried microgel samples. Thermograms were recorded from 20º to 700ºC with a heating rate of 10ºC/min, under a nitrogen gas flow of 30 mL/min.
The viscosity measurements of diluted solution of chitosan were carried out using a Schott-Geräte AVS400 viscometer with a ϕ capillary of 0.53 0.01 mm (Ubbelohde capillary) in 0.2 M acetic acid/ 0.1 M sodium acetate buffer solution at 30 ºC. The individual polymer solutions were prepared by dissolving the chitosan into buffer solution under magnetically stirring for 24 h. The temperature of 30 ± 1 ºC was achieved in a water bath fitted with a thermoregulatory. The various dilutions required during viscosity measurements were done under constant stirring for 20 minutes. At least five observations of each dilution measurement were made. Data analysis were performed to calculate the average molecular weight and the intrinsic vis-cosity of each depolymerized chitosan sample.
the mathematical model that is the response surface approximation. The mathematical approximation model that fit the data experimental points was determined. This approximation was a first-order polynomial re-garding the second-order interactions, which can be described by the following equation [50, 54]:
𝑦(𝑥) = 𝛽0+ ∑ 𝛽𝑖𝑥𝑖 𝑘
𝑖=1
+ ∑ ∑ 𝛽𝑗𝑥𝑖 𝑘
𝑖=2 𝑥𝑗 𝑘
𝑗<𝑖
+ 𝜀 Equation 2.1
13
3.
Results and Discussion
3.1.
Thermosensitive microgels
PNIPAAm and PNIPAM-Cs microgels samples with different Cs concentration (from 20 to 40 wt.%) and molecular weights (of about 30 KDa (Cs (1:25)), 50 KDa (Cs (1:33)) and 85 kDa (Cs (1:50)) were prepared via surfactant-free emulsion polymerization (SFEP) in the presence of MBA crosslinking agent. We found that stable microgel dispersions can be obtained in the following cases: (i) a concentration of 40 wt.% Cs, independently of its molecular weight, and also for (ii) the highest molecular weight Cs within the range of Cs concentrations used for the synthesis. But below of 30 wt.% of chitosan, the colloidal stability depends on the molecular weight. For instance, the attempt to prepare microgels with an amount of 30 wt.% adding the lowest molecular weight depolymerized chitosan sample results in the formation of precipitates, while the chitosan samples with 50 and 85 kDa lead to stable polymerizations. Furthermore, the synthesis of microgels containing 20% of Cs was only achieved for the highest molecular weight Cs (85 KDa). These results can be explained by the zeta potential changes on the negative PNIPAAm surface by adding the positive chitosan polymer, as stated in the work by Echeverria et al. [11]. They ascribed the formation of precipitates based on literature measurements, where the commutation of PNIPAAm surface charge only occurs with high contents of chitosan [22]. They also conclude that below a certain concentration of chitosan the surface changes could be near the isoelectric point, which promotes the formation of non-stable micro-gels dispersions. The cross-check results between the emulsion polymerizations and the outcome stability of colloids synthesis are expressed in the attached section 6.7. Thereby, PNIPAAm and PNIPAAm-Cs stable obtained microgels dispersions were analyzed by the following tests: chemical analysis (appendix 6.5), mor-phological analysis SEM (appendix 6.6), thermal evaluations (appendix 6.7), and determination of the swell-ing properties as well as thermosensitivity.
3.2.
Chemical structure of cross-linking PNIPAAm and PNIPAAm-Cs
mi-crogels
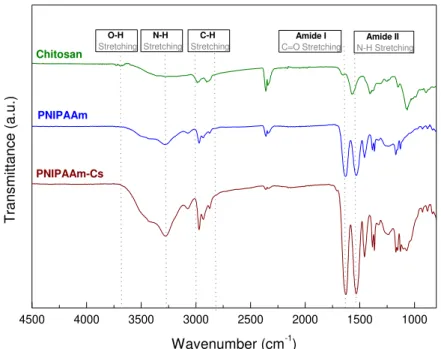
appearing at 1640 cm-1 (amide I), 1572 cm-1 (amide II) and 1395 cm-1 (amide III) are observed. The band vibration amide II is assigned to the NH deformation from NH2 group in the glucosamine residues, while amide III vibration mode corresponds to C-O stretching vibration of primary alcoholic group [44]. These bands are also presented in the PNIPAAm-Cs microgels spectrum. PNIPAAm-Cs spectrum exhibits char-acteristic bands at 1634, 1530 and 1380 cm-1, which denote amide I, amide II and methyl group, respectively. In chitosan spectrum, characteristic band associated to vibrations of carbonyl bonds (C=O) of the amide group -CONHR (amide I) at 1640 cm-1 indicates the incomplete deacetylation of chitin to its derivate chi-tosan. In addition, this characteristic band is shifted to 1635 cm-1 in the composite microgels spectra and became more intense. This effect can be attributed to the overlapping of the bands with the same functional group presented in PNIPAAm structure. The asymmetric stretching of the glyosidic linkages joining two monosaccharides is showed by the presence of the characteristic band at 1150 cm-1 associated to chitosan structure. The relative broad vibrational mode at 1070 cm-1 is assigned to symmetric stretching (C-O) of ether linkage of chitosan backbone, while the small band at 895 cm-1 is assigned to wagging vibration of the saccharide structure of chitosan. On the other hand, the bands appearing in chitosan spectrum due to the stretching vibrations of intra and intermolecular H-bonded (-OH) groups in a range from 4000 to 3500 cm-1 can be overlapped with the bands of stretching vibration of N-H groups in PNIPAAm-Cs microgels. Thus, FTIR spectral data confirmed that PNIPAAm-Cs microgels were successfully synthesized [22, 55–57].
4500 4000 3500 3000 2500 2000 1500 1000
O-H Stretching C-H Stretching Amide II N-H Stretching Amide I C=O Stretching N-H Stretching T ra n smi tt a n ce (a .u .)
Wavenumber (cm-1) PNIPAAm
Chitosan
PNIPAAm-Cs
Figure 3.1 - ATR-FTIR spectrum of depolymerized chitosan (green), spectra of PNIPAAm microgels (blue) and
15
3.2.1.
Swelling properties of PNIPAM-Cs microgels
We measured the microgel particle hydrodynamic diameter by DLS providing the assessment of their ther-mosensitivity and swelling behavior with temperature in aqueous medium. Figure 3.2 shows the evolution of hydrodynamic diameters (Dh) and the swelling ability of microgels as a function of temperature in a range from 25 to 45 ºC. As observed, all microgel hydrodynamic diameters present similar trend with the increase of temperature. At room temperature microgels are in a swollen state, however their hydrodynamic diameter decreases sharply above the critical temperature. At higher temperatures, the collapsed state of microgels takes place and their diameters remain practically constant. Therefore, this increasing in the hydrodynamic diameter followed by a sudden decrease in volume indicates the negative thermosensitivity or volume phase transition temperature of microgels.
DLS curves show that the incorporation of chitosan does not eliminate the thermosensitivity of the PNIPAAm microgels (Figure 3.2 (a)) although it could affect the swelling capacity (Figure 3.2 (b)). For instance, the incorporation of 30 wt.% Cs reduces the Dh from 940 to 477 nm in the swollen state. Regarding the effect of Cs molecular weight, it is observed that as the Mw increases the Dh slightly decreases. The PNIPAAm-Cs microgels with a concentration of 40 wt.% Cs show the smallest hydrodynamic diameter, which is consistent with other reports [11]. This behavior have been explained by the higher content of chitosan acting as sur-factant and preventing the growth of PNIPAAm-Cs microgels [22].
In Figure 3.2 (b) the evolution of the microgel relative swelling volume (RSV) with temperature is depicted. RSV is defined as the ratio between the swollen microgel with respect to the microgel diameter at 25 ºC (Dh in the collapsed state) [11]. As observed, the RSV with temperature measured for PNIPAAm-Cs is found to be disadvantaged compared to PNIPAAm microgels. For a concentration of 30 wt.% Cs, data analysis sup-ports that the RSV is widely reduced by using the high Mw chitosan. Moreover, the microgels containing a concentration of 40 wt.% Cs show a dramatic decrease in the swelling ability, giving rise to a less pro-nounced thermosensitivity (with no remarkable differences when varying chitosan’s Mw). The observed re-sults were also reported by Echeverria et al. [11]. In the work by Jaiswal et al. it was also stated that in highly cross-linked PNIPAAm microgels, the chitosan polymer could act as cross-linker, which reduces the mobility of chains [22].
Figure 3.2 - Dependence of hydrodynamic diameter (Dh) of microgels (a); evolution of the relative swelling
(D/Do); (b) with temperature for samples PNIPAAm (cyan), PNIPAAm-30%Cs (1:50) (orange), PNIPAAm-30%Cs
(1:33) (green), PNIPAAm-40%Cs (1:50) (magenta), and PNIPAAm-40%Cs (1:33) (wine).
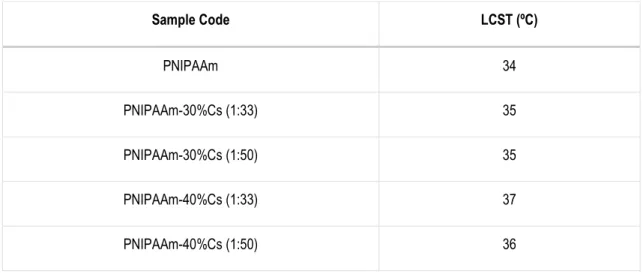
Table 3.1 - Stable microgels dispersions and their LCST in aqueous medium.
Sample Code LCST (ºC)
PNIPAAm 34
PNIPAAm-30%Cs (1:33) 35
PNIPAAm-30%Cs (1:50) 35
PNIPAAm-40%Cs (1:33) 37
PNIPAAm-40%Cs (1:50) 36
As observed the LCST of PNIPAAm-Cs microgels were independent of Mw and the percentage of chitosan, but could be changed upon shifting the hydrophilic/hydrophobic balance [59]. Since that shift reveals to be partially irrelevant we could infer that the Cs is physically, and not chemically, linked to PNIPAAm in the microgels formation, confirming the surfactant role of Cs mentioned before [22].
3.2.2.
Analysis of the autocorrelation function (cumulant method)
17 3.3 (a). A sharp rise in diameter size of the PNIPAAm-40%Cs (1:25) sample was detected from 37º to 38ºC which corresponds to 426 and 572 nm, respectively. Similarly, the plot of the sample coded with PNIPAAm-20%Cs (1:50) shows a decrease diameter from 676 to 346 nm and a significant increase up to 372 nm at 35ºC. These results may be attributed to particle agglomeration, as a consequence of the averaging com-bination of several size distributions. To confirm this fact a thorough data processing (cumulant method, explained in annex 6.8) was performed by calculating the minimum hydrodynamic diameters of these sam-ples, from the autocorrelation functions obtained from DLS experiments. Data analysis of calculated (by cumulant expansion method) and measured Dh for PNIPAAm-20%Cs (1:50) and PNIPAAm-40%Cs (1:25) microgels are shown on Figure 3.3 (b) and (c), respectively.
Figure 3.3 - DLS curves as a function of temperature for samples 20%Cs (1:50) (olive) and
PNIPAAm-40%Cs (1:25) (blue) (a), Evaluation of the measured and calculated (red) hydrodynamic diameters for samples
PNIPAAm-20%Cs (1:50) (b), and PNIPAAm-40%Cs (1:50) (c) with the temperature tested range.
nm (at 35ºC), which is well above the minimum Dh calculated at the same temperature. On the other hand, the PNIPAAm-40%Cs (1:25) curve (Figure 3.3 (c)) shows an ambiguous behavior upon heating. The col-lapsed state of these microgels confirms that the thermosensitivity still present and remains closer to the hydrodynamic diameter of microgels with 40 wt.% Cs. Nevertheless, an unexpected increasing on Dh can be seen above the LCST followed by a decreasing and a further increasing on the Dh measurements at 32º and 36ºC, respectively. From the calculated Dh points it was observed that above the LCST, there is a higher contribution of the larger “particles” that give rises to higher diameter sizes. Others authors have discussed this scattering of points (above the LCST) based on the phase separation between the chitosan and PNIPAAm at higher temperatures, which results in DLS measures performed on chain residues of chitosan [11]. Based on the cumulant method it was confirmed that the unexpected behavior observed for PNIPAAm-20%Cs (1:50) and PNIPAAm-40%Cs (1:25) microgels samples above the LCST was due to the presence of agglomerates.
3.3.
Colloidal Electrospinning
3.3.1.
Spinning solution and jet forming concentrations
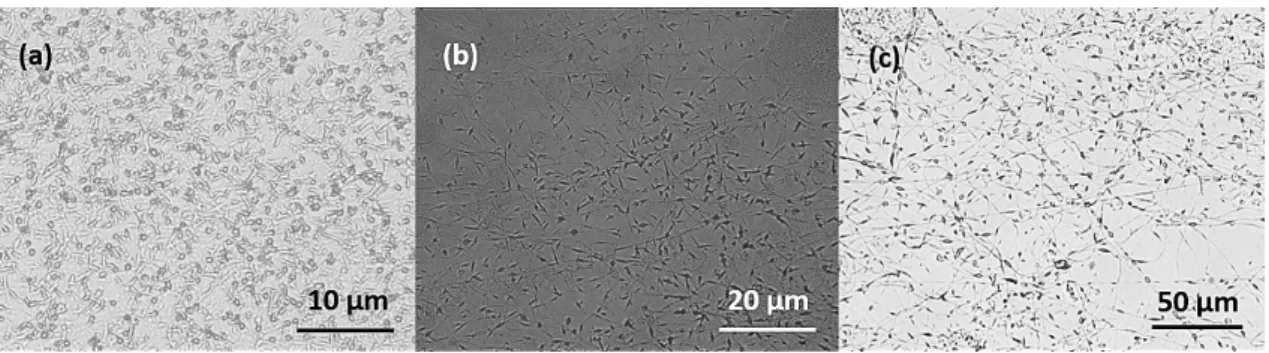
19 ensure that the microgels were confined in fibrous matrix, optical micrographs were taken and features of the research fiber structures performed during the formulations of spinning solution were analyzed. As concluded from the optical micrographs’ analysis the increase of PEO content lead to fibers formation; even the highest polymer concentration give rise to a fiber formation with a couple of beads. From Figure 3.4 (a), it is noteworthy that with the incorporation of just 0.4 wt.% PEO big microgel beads were connected by small PEO fibers, while for 1 wt.% PEO the fiber formation partially takes place (Figure 3.4 (b)). At the concentration of 2 wt.% PEO medium and long fibers without protruding beads were observed (Figure 3.4 (c)). In these circumstances, the production of non-beads fibers can be reached by reducing the surface tension with the use of appropriate solvents [60]. A widely accepted solvent system for PEO polymer in spinning solutions is the water/ethanol mixture. The use of ethanol provides fast solvent evaporation, re-duces the surface tension and increases the viscosity of the spinning solution [61].
Figure 3.4 - Optical images of the representative samples with composite colloids/PEO beads using 0.4 wt.
%PEO (a); short PEO fibers and microgels beads using 1 wt.% PEO (b), and microgel beads confined in PEO
medium and long fibers using a concentration of 2% wt. PEO (c).
Figure 3.5 - Optical images of the representative samples with composite colloids/PEO using a concentration
of 2 wt.% PEO with 10% (v/v) ethanol (a) 15% (v/v) ethanol (b), 20% (v/v) ethanol (c).
Taking into account the analysis of optical micrographs, 2 wt.% of PEO dissolved in water/ethanol 20/80 (v/v)% solvent mixture was chosen for spinning solution and further mixed with the as-obtained microgel dispersions.
3.3.2.
Planning and analysis:
surface response methodology
A novel approach involving the Design of Experiments (DoE) was performed in stimuli-responsive microgels concerning the electrospinning process. The studied composite material system can be described by a composition of dispersed PNIPAAm or PNIPAAm-Cs microgels randomly entrapped into a fiber PEO matrix. The experiments were carried out to obtain the combination of factors that will provide the minimum average electrospun fibers ensuring the maximum aspect ratio. To achieve this, the fiber diameter also should be smaller than the confined microgels diameter. The selection discussed in section 6.1 from supplementary information, represents the parameters’ space that will provide suitable and reliable calculations for the aimed minimization of the fiber diameter. DoE was used to express the experiments at the setting parame-ters of solution concentration (C), voltage (V), flow rate (Q), and working distance (d). From JMP software, a D-optimal design with 27 runs was generated (annex 6.1.1).
Among the 27 settings, the minimum fiber diameter was observed by means of SEM at the parameter set-tings of [PNIPAAm-30%Cs (1:50) microgels/PEO,10 kV, 20 cm, 0.7 mL/h] as 136 ± 72 nm and the maximum was at [PNIPAAm microgels/PEO, 10 kV, 20 cm, 0.5 mL/h] as 309 ± 107 nm.
Fit model equation
21 coefficients that need to be estimated. For more information access the supplementary information in section 6.1.2.
In the Table 3.2 statistical reports of the fit model are presented. The R2 value (0.95) indicates that the model fits the experimental data very well, which is a statistical indication of the variability of the fiber diameter. However the adjacent R2 is very low when compared to R2, indicating that there might be insignificant terms in the model which could over-fit the predictive goal response [50]. This discrepancy may be a consequence of a reduced number of runs (experiments) provided by the chosen minimum D-optimal design, instead of a standard design in order to speed-up the process.
Table 3.2 - Summary of the results from the statistical analysis of the model of the mean fiber diameter.
Mean (nm) R2 R2 adj p-value
205.5 0.95 0.59 0.2313
The indicator parameterization estimates (terms) provided by JMP software are presented in supplementary data (section 6.1.2). Since the model can be more efficient without the statistically insignificant estimates, afterwards an evaluation and elimination of these terms the Table 3.3 was built to show only the significant effects and the important interactions between parameters. The p-values also associated with coefficient estimates are measures of the statistical significance, whereas the R2 is a measure of the response being represented by the variables. It is important to note that in most of the samples the residual (difference between the experimental data and the predicted fiber diameter) is less than the standard deviation of the predicted fiber diameters.
Response surfaces for the mean fiber diameter
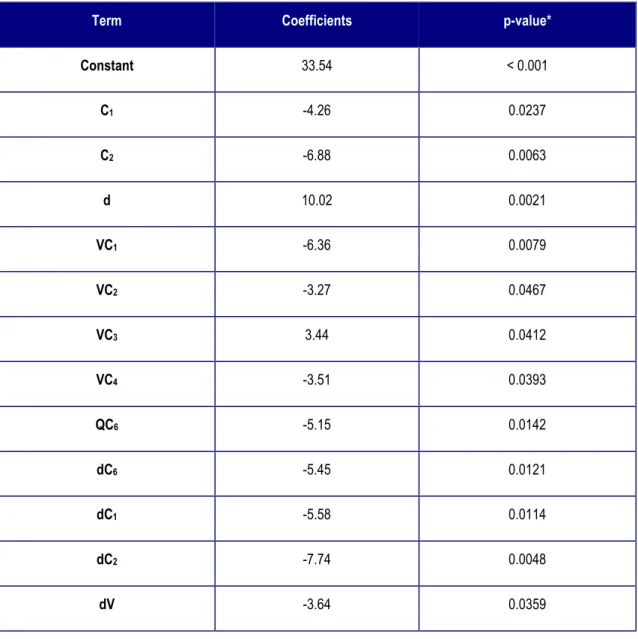
Table 3.3 - Test on individual coefficients for the model of mean fiber diameter.
Term Coefficients p-value*
Constant 33.54 < 0.001
C1 -4.26 0.0237
C2 -6.88 0.0063
d 10.02 0.0021
VC1 -6.36 0.0079
VC2 -3.27 0.0467
VC3 3.44 0.0412
VC4 -3.51 0.0393
QC6 -5.15 0.0142
dC6 -5.45 0.0121
dC1 -5.58 0.0114
dC2 -7.74 0.0048
dV -3.64 0.0359
* The p-values closer to zero are statistically more significant on the mean fiber diameter.
Effect of concentration in the fiber diameter
23 concentration levels (Cx), the respective sample code, and their contents of microgels in spinning solutions are expressed as presented in Table 3.4.
It is important to note that these spinning microgels dispersions are heterogeneous systems and, therefore, during the process a gradient of concentrations could occur. In accordance with this, the concentration of microgels in the electrospun polymer matrix might be slight different than the theoretically calculated con-centration for the loaded spinning solution. Additionally, microgels with high Dh in the swollen state and agglomerates in solution are more likely to settle on into syringe.
As reported in literature, an increase in solution concentration (likewise increases the viscosity) enhances the entanglement of polymers chains yielding fibers with larger diameters [28]. This leads to an increase in viscoelastic force, meaning that for the same electrostatic stretching force (same electrical field) higher di-ameter fibers are produced [26].
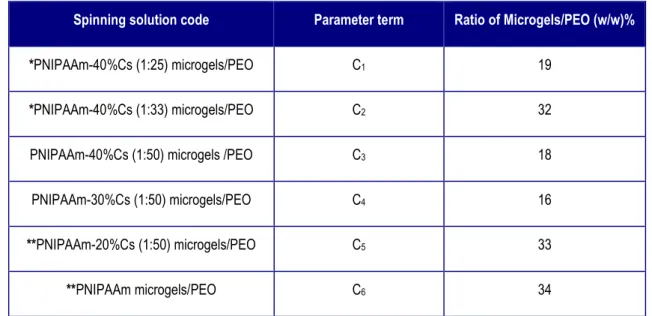
Table 3.4 - Spinning solution code, statistical term and respective concentration of microgels.
Spinning solution code Parameter term Ratio of Microgels/PEO (w/w)%
*PNIPAAm-40%Cs (1:25) microgels/PEO C1 19
*PNIPAAm-40%Cs (1:33) microgels/PEO C2 32
PNIPAAm-40%Cs (1:50) microgels /PEO C3 18
PNIPAAm-30%Cs (1:50) microgels/PEO C4 16
**PNIPAAm-20%Cs (1:50) microgels/PEO C5 33
**PNIPAAm microgels/PEO C6 34
* Solution concentration levels with a high content of microgels which can affect the MFD.
** Solution concentration levels with a high content of microgels, but do not affect the MFD.
microgels/PEO affected the MFD. By using spinning solutions with high concentration of microgels is ex-pected an increment of the solution´s viscosity leading to high fiber diameters. However, this effect is not observed in the case of the systems containing the highest concentration of microgels, namely C5 and C6 (for PNIPAAm-20%Cs (1:50) microgels/PEO and PNIPAAm microgels/PEO samples, respectively). This might be a result of a low content of chitosan in C5 microgel dispersions or could be due to the lower loading of microgels during the spinning process, as stated before. By DLS measurements it was determined that PNIPAAm microgels had the high Dh in the swollen state and the PNIPAAm-20%Cs (1:50) microgels sample had agglomerates, which could settle down on the syringe during the electrospinning process because their high size.
In this regard, the composition of the composite electrospun fibers might also be affected ending up in the unrealistic predicted response by the fit model equation and depicted in Figure 3.6 (E). The predictive re-sponse over-fit also might be a result of the use of first-order models, where the interactions (C3)2 are not considered.
The concentration effect on MFD was more pronounced at long working distances (Figure 3.6 C), as it will be later discussed in this work. In the case of high diluted solutions long distances provides more time not only to stretch the jet towards the collector but also to evaporate the solvent, thereby favoring thinner fiber formation. At higher concentration there are denotative chain entanglements resulting in higher viscoelastic forces that provide resistance to the applied voltage, resulting in higher MFDs [29].
Effect of applied voltage in fiber diameter
In general, an increase on the applied voltage causes a high stretching of the ejected solution, which results in the reduction of the fiber diameter. Although, the effect of applied voltage in fiber diameter is controversial (may increase, decrease or even not change). Interestingly, Reneker and Chun demonstrated that there is no significant effect of the applied voltage on the PEO electrospun nanofibers diameter [25].