MODELING WATER MOVEMENT IN HORIZONTAL COLUMNS
USING FRACTAL THEORY
(1)Tairone Paiva Leão(2) & Edmund Perfect(3)
SUMMARY
Fractal mathematics has been used to characterize water and solute transport in porous media and also to characterize and simulate porous media properties. The objective of this study was to evaluate the correlation between the soil infiltration parameters sorptivity (S) and time exponent (n) and the parameters dimension (D) and the Hurst exponent (H). For this purpose, ten horizontal columns with pure (either clay or loam) and heterogeneous porous media (clay and loam distributed in layers in the column) were simulated following the distribution of a deterministic Cantor Bar with fractal dimension ≈ ≈ ≈ ≈ ≈ 0.63. Horizontal water infiltration experiments were then simulated using Hydrus 2D software. The sorptivity (S) and time exponent (n) parameters of the Philip equation were
estimated for each simulation, using the nonlinear regression procedure of the statistical software package SAS®. Sorptivity increased in the columns with the
loam content, which was attributed to the relation of S with the capillary radius. The time exponent estimated by nonlinear regression was found to be less than the traditional value of 0.5. The fractal dimension estimated from the Hurst exponent was 17.5 % lower than the fractal dimension of the Cantor Bar used to generate the columns.
Index terms: numerical modeling, Hydrus 2D, fractal model, Cantor bar, sorptivity, soil physics.
(1) Received for publication in May 2009 and approved in May 2010.
(2) Faculdade de Agronomia e Medicina Veterinária, Universidade de Brasília – UnB. Campus Universitário Darcy
Ribei-ro, Asa Norte. CEP 70910-970 Brasília (DF). E-mail: [email protected]
(3) University of Tennessee, Department of Earth and Planetary Sciences, 1412 Circle Park, 306 Earth and Planetary Sciences
RESUMO: MODELAGEM DE MOVIMENTO HORIZONTAL DE ÁGUA NO SOLO UTILIZANDO A TEORIA DOS FRACTAIS
A matemática fractal tem sido utilizada para caracterizar o transporte de água e solutos em meios porosos e também para simular características físicas e geométricas de meios porosos. O objetivo deste trabalho foi avaliar a correlação entre os parâmetros de infiltração de água sortividade e expoente de tempo (n) e os parâmetros dimensão fractal (D) e expoente de Hurst (H). Para isso, dez colunas horizontais foram simuladas em computador, sendo preenchidas com material de textura franca ou argilosa, puros ou em combinações de camadas alternadas dos dois materiais, seguindo a distribuição de um Conjunto de Cantor determinístico com dimensão fractal ≈ 0,63. As simulações de movimento horizontal de água foram realizadas no modelo numérico Hydrus 2D. Os parâmetros sortividade (S) e expoente de tempo (n) da equação de Philip foram estimados para cada simulação, utilizando o módulo de regressão não linear do software SAS®. A sortividade aumentou com o aumento de material de textura
franca nas colunas, o que foi atribuído à dependência do parâmetro S no raio capilar. O parâmetro expoente de tempo estimado por regressão não linear mostrou valor menor que o valor empírico de 0,5 sugerido na literatura. A dimensão fractal estimada utilizando o expoente de Hurst foi 17,5 % menor do que a dimensão fractal do Conjunto de Cantor utilizado para gerar as colunas.
Termos de indexação: modelagem numérica, Hydrus 2D, modelos fractais, Conjunto de Cantor, sortividade, física do solo.
INTRODUCTION
Fractal mathematics has been used to characterize water and solute transport in porous media (Arya et al., 1999; Pachepsky et al., 2000) and also to characterize and simulate porous media properties (Anderson et al., 2000). From a non-fractal perspective, the position of any volumetric water content within a porous media column can be characterized by:
x = λ(θ).tn (1)
where x = Vertical distance within the column [L], λ
= Boltzmann variable [L T-n], t = Elapsed time [T], n
= Time exponent, and θ = Porous media water content [L3 L-3].
Similarly, the process of one-dimensional infiltration of water into a uniform soil as a function of time can be characterized by the Philip (1957) equation:
I = S.tn (2)
where I = Cumulative one-dimensional infiltration [L], and S = Sorptivity [L T-n].
In both (Equations 1 and 2) the time exponent (n) was fixed at 0.5 (Clothier & Scotter, 2002). However in fractal characterization of water movement processes in the soil, the time empirical coefficient was estimated statistically, along with other hydraulic properties (Guerrini & Swartzendruber, 1994; Pachepsky & Timlin, 1998).
The diffusive process in a porous medium can be interpreted as a self-affine fractal. If this assumption holds, there is experimental evidence that the
empirical coefficient n can be associated with fractal parameters such as the Hurst exponent (Guerrini & Swartzendruber, 1994). The objective of this study
was to evaluate the correspondence between n and
fractal parameters: fractal dimension (D) and the Hurst exponent (H). For this purpose, horizontal columns with heterogeneous porous media (i.e. two contrasting grain sizes) were generated following the horizontal distribution of the first four iterations of a deterministic Cantor Bar. Experiments of water transport were then simulated using Hydrus 2D software (Rassam et al., 2003) and n and S parameters were estimated for each simulation run using nonlinear regression.
MATERIALS AND METHODS
(Figure 1). The columns were defined by a combination of two materials (clay and loam) and five iterations (i = 0 to 4) resulting in 10 treatments: two materials x five iterations = 10 columns. At the zeroth
iteration, infiltration was simulated in columns filled in two ways: pure clay (CLAY0) and pure loam (LOAM0) (Figure 3a). For the subsequent iterations, the two materials were layered horizontally within the column following the distribution of the CB. In the first iteration, one loam layer was inserted in the clay column (CLAY1) and one clay layer was inserted in the loam column (LOAM1) (Figure 3b). The filling pattern following the CB distribution was used to define each treatment until the fourth iteration (Figure 3e) as follows: CLAY0; CLAY1; CLAY2; CLAY3; CLAY4; and LOAM0; LOAM1; LOAM2; LOAM3; LOAM4. With increasing iterations, the content of the interlayered material (i.e. loam in the clay column and clay in the loam column) increased until exceeding the original material in the column (Figure 3).
Each simulation represented a 10-min water infiltration experiment for each column. The initial time step was 0.1 min and the minimum and maximum were 0.01 and 0.5 min, respectively. The “cumulative water boundary fluxes” output files of Hydrus 2D (Cum_Q.out) were used for the statistical analysis of the results. The files were imported into Microsoft Excel® and converted to *.xls format. The
Materials were mixed in 10 x 10 cm columns following the iterations of a deterministic CB
Figure 2. Textural triangle for classification of soil materials according to clay, silt and sand contents.
Table 1. Clay and loam material hydraulic parameters: θθθθθr = residual water content;θθθθθs = saturated water content; ααααα = inverse of air entry value; βββββ = empirical coefficient; Ks = saturated hydraulic conductivity.
(1) Following van Genuchten (1980).
Figure 1. Cantor Bar with an initiator of 10 cm in length and fractal parameters D ≈≈≈≈≈ 0.6309 and b = 3.
time and cumulative volume infiltration were fitted to equation 2 using nonlinear regression in the “nlin” procedure of SAS®. The parameters sorptivity (S) and
time exponent (n) were estimated by nonlinear
regression procedures. Sorptivity was also estimated with the time exponent fixed at 0.5 (Clothier & Scotter, 2002). The estimated fractal dimension was calculated following Feder (1989):
D = d – H (3)
where D = Fractal dimension, d = Euclidean dimension (d = 1 for the Cantor Bar), H = Hurst exponent.
The Hurst exponent (H) was associated with the time exponent (n) following (Guerrini & Swartzendruber, 1994). The estimated fractal dimension could therefore be calculated as:
D = 1 - n (4)
where all definitions were as above.
RESULTS AND DISCUSSION
Infiltration simulations
Simulations of infiltration versus time in pure clay and clay mixed with loam following the iterations of the Cantor Bar (CB) are illustrated in figure 4. The cumulative infiltration rate increased as the loam content increased with each iteration of the CB. An inverse behavior was observed in loam simulations where the cumulative infiltration rate decreased as the amount of clay increased within the columns (Figure 5).
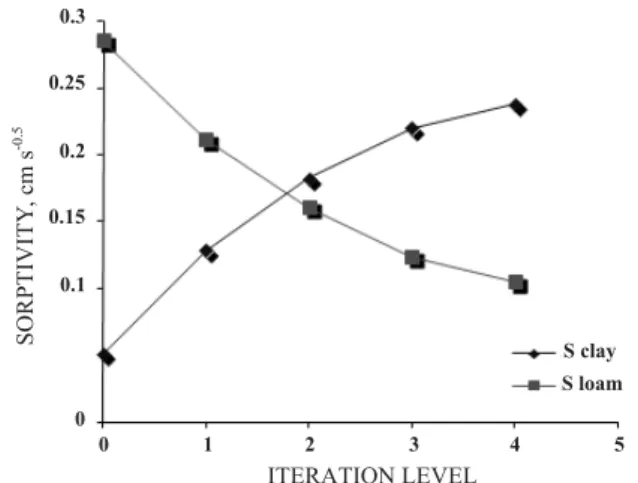
Soil sorptivity (S) was defined as the gravity-free, capillary-induced absorption (Clothier & Scotter, 2002). The greater infiltration in the columns with higher loam content is reflected in the Sorptivity (S) plots as a function of iteration level (Figure 6).
Sorptivity decreased exponentially with each iteration level in loam simulations and increased exponentially for clay. White & Sully (1987) found that S decreased in soil materials following the order: fine Brindabella fine sand > Brindabella silty clay loam > Molonglo loam > Bungendore fine Sand (70 %) > Kaolinite (30 %). The overall sorptivity for increasing water potentials was also greater for coarser material (Pilliago sand) than in finer soil material (Murrumbateman silty clay loam) in a study conducted by White & Perroux (1989). Mapa et al. (1986) found that the overall S was greater in a silty clay loam (Typic Torrox) than clay soil (Vertic Haplustox). Talsma (1969) also found a decrease of S with particle size, and that S was one order of magnitude greater in sand than in clay loam soil.
The results of the simulations in Hydrus 2D and from the literature are evidence enough that sorptivity is greater in coarser materials. However this is somewhat contrary to the sorptivity definition and also to the intuitive knowledge that pure clays would have a greater capillary absorption potential than coarser materials. Some hypotheses on why the
Figure 6. Sorptivity parameter estimated with time exponent fixed at 0.5 at each iteration level for clay and loam materials.
Figure 5. Infiltration rate as a function of time for loam material at each iteration level (clay content is zero at iteration zero and increases with each iteration).
sorptivity would be higher in a coarse than in finer media were therefore investigated.
Sorptivity is an integral soil-water property that contains information about the soil hydraulic conductivity, soil water potential and soil diffusivity (White & Perroux, 1987). In a first analysis, the dependence of S on saturated hydraulic conductivity (Ks) was investigated. S and Ks are not independent variables; Ks is roughly proportional to S2 (Clothier &
Scotter, 2002). Following this premise, and using the Ks values 3.33 x 10⁻³ and 1.72 x 10⁻² cm s-1 for clay
and loam, respectively (Table 1), the estimated sorptivities values would be around 0.06 for clay and 0.13 for loam. These values, although roughly estimated, are of the same order of magnitude as those estimated based on simulations. Therefore the behavior observed in this research is once more confirmed.
Sorptivity is also defined as a measure of the capillary removal of water, being essentially a property of the medium. It is similar to the “capillary absorption coefficient” which is proportional to the square root of the capillary radius (Philip, 1957). Therefore, the smaller the capillary radius (i.e. the finer the soil particle size), the smaller the “capillary absorption coefficient” and thus, sorptivity.
Soil sorptivity is proportional to the pore diameter of the medium. The sorptivity of clay, despite a higher capillary rise potential, was not higher than in the loam material. The early-time infiltration rates, which are directly proportional to sorptivity, were also lower in clay. From these results and also from literature it is possible to conclude that the lower porosity of pure clays does not allow a higher infiltration rate, despite a higher capillary rise potential than in coarser materials. Also, the relationship between sorptivity and saturated hydraulic conductivity is not clear enough to define the real influence of Ks and gravity on early-time infiltration. Clear quantitative and qualitative definitions on the significance of the term “early-time infiltration” are also needed to improve the interpretation of sorptivity experiments.
Fractal characterization of infiltration process
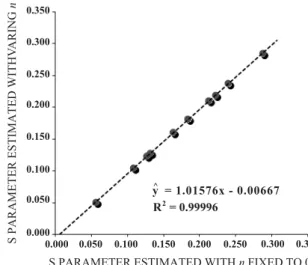
Sorptivity estimated with the time exponent
parameter (n) fixed at 0.5 was not statistically
different from sorptivity estimated with n also
estimated in the nonlinear regression procedures (Figure 7). The variation of S estimated with varying
n at each iteration level for clay and loam is illustrated in figure 8. There are no visual differences between figures 6 and 8. The use of n fixed at 0.5 or n estimated by regression procedures had no influence on the estimated sorptivity value. The estimated n values were therefore used in the fractal characterization of the infiltration process (Guerrini & Swartzendruber, 1994; Pachepsky & Timlin, 1998).
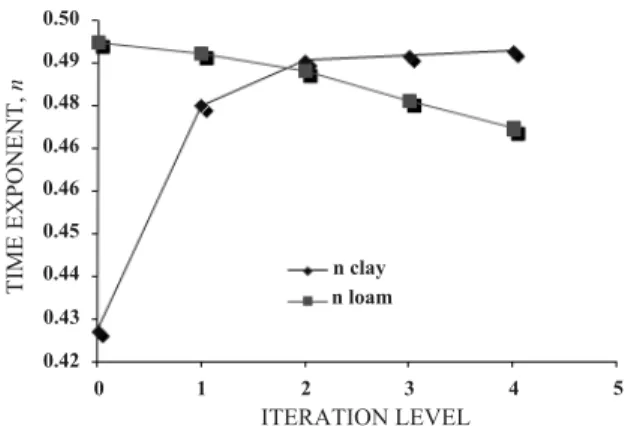
As described earlier, the estimated time exponent (n) was associated with the fractal parameter Hurst exponent (H) (Guerrini & Swartzendruber, 1994). The
n = Hvalues ranged from 0.43 to 0.49 ( = 0.48; σ = 0.028) in clay and from 0.47 to 0.49 ( = 0.49; σ = 0.008) in loam, where = average and σ = standard deviation. The variation of the time exponent at each iteration level for clay and loam is shown in figure 9. The mean fractal dimension (Dc) value calculated from
n = H values of clay and loam, using equation 4, was 0.52. The fractal dimension of the Cantor Bar used to generate the soil columns (D) was approximately 0.63. Therefore, the variation between Dc and D was relatively small (around 17.5 %).
The Hurst exponent associated with the time exponent was less than the traditional 0.5 for all materials and iteration levels. The character of a Brownian motion is expressed and classified as either regular or fractional, according to the value of the Hurst exponent. The conventional diffusion is associated with a regular Brownian motion if H ≡ 0.5 and as a fractional Brownian motion if 0 < H ≠ 0.5 < 1
Figure 8. Sorptivity parameter estimated with the time exponent also estimated by regression at each iteration level for clay and loam materials. Figure 7. 1:1 plot of Sorptivity (S) estimated with time exponent (n) fixed at 0.5 and with time
(Guerrini & Swartzendruber, 1994). According to the results of this study, the Brownian motion process in “early-time” water infiltration in soil can be classified as fractional, since H < 0.5.
CONCLUSIONS
Hydrus 2D adequately simulated the “early-time” infiltration process for pure clay and pure loam and clay and loam materials mixed in different proportions following the horizontal distribution of a Cantor Bar
with fractal dimension D ≈ 0.63. Soil sorptivity
increased as the loam content increased in the columns. This behavior was attributed to the dependence of the sorptivity parameter on capillary radius. The time exponent parameter estimated by nonlinear regression was found to be less than the traditional value of 0.5. The fractal dimension estimated from the Hurst exponent was 17.5 % lower than the fractal dimension of the Cantor Bar used to generate the columns. Since the value of H was different from 0.5, the water diffusion process within the columns was characterized as fractional Brownian motion.
ACKNOWLEDGEMENTS
The authors would like to thank the University of Brasília, Decanato de Pesquisa e Pós-Graduação for covering the publication charges.
LITERATURE CITED
ANDERSON, A.N.; CRAWFORD, J.W. & MCBRATNEY, A.B. On diffusion in fractal soil structures. Soil Sci. Soc. Am. J., 64:19-24, 2000.
ARYA, L.M.; LEIJ, F.J.; SHOUSE, P.J. & van GENUCHTEN, M.T. Relation between hydraulic conductivity function and the particle-size distribution. Soil Sci. Soc. Am. J., 63:1063-1070, 1999.
CLOTHIER, B. & SCOTTER, D. Unsaturated water transmission parameters obtained from infiltration. In: DANE, J.H. & TOPP, G.C., eds. Methods of soil analysis. Madison, Soil Science Society of America, 2002. p.879-898.
FEDER, J. Fractals. New York, Plenum Press, 1989. 283p.
GUERRINI, I.A. & SWARTZENDRUBER, D. Fractal characteristics of the horizontal movement of water in soils. Fractals, 3:465-468, 1994.
MAPA, R.B.; GREEN, R.E. & SANTO, L. Temporal variability of soil hydraulic properties with wetting and drying subsequent to tillage. Soil Sci. Soc. Am. J., 50:1113-1138, 1986.
PACHEPSKY, Y. & TIMLIN, D. Water transport in soils as in fractal media. J. Hydrol., 204:98-107, 1998.
PACHEPSKY, Y.; BENSON, D. & RAWLS, W. Simulating scale-dependent transport in soils with the fractional advective-dispersive equation. Soil Sci. Soc. Am. J., 63:1063-1070, 2000.
PHILIP, J.R. The theory of infiltration: 1. The infiltration equation and its solution. Soil Sci., 83:345-357, 1957.
RASSAM, D.; SIMUNEK, J. & van GENUCHTEN, M.T. Modeling variable saturated flow with Hydrus 2-D. Hydrus 2-D Software Manual. 2003.
TALSMA, T. In situ measurement of sorptivity. Austr. J. Soil Res., 7:269-276, 1969.
van GENUCHTEN, M.T. A closed form equation for predicting the hydraulic conductivity of unsaturated soils. Soil Sci. Soc. Am. J., 44:892-898, 1980.
WHITE, I. & SULLY, M.J. Macroscopic and microscopic capillary length and time scales from field infiltration. Water Res. Res., 23:1514-1522, 1987.
WHITE, I. & PERROUX, K.M. Use of sorptivity to determine field soil hydraulic properties. Soil Sci. Soc. Am. J., 51:1093-1101, 1987.
WHITE, I. & PERROUX, K.M. Estimation of unsaturated hydraulic conductivity from field sorptivity methods. Soil Sci. Soc. Am. J., 53:324-329, 1989.