http://dx.doi.org/10.1590/1516-635x1702219-226
Author(s)
Araújo FEI
Garcia RGI
Nääs IAI
Lima NDSI
Silva RBTRI
Caldara FRI
I Universidade Federal da Grande Dourados
Mail Address
Corresponding author e-mail address Rodrigo Garcia
Universidade Federal da Grande Dourados-FCA, Dourados, MS, Brazil Phone: +55 67 34102437
E-mail: rodrigogarcia@ufgd.edu.br
Keywords
Monochromatic light, LED, welfare, broiler activity.
Submitted: July/2014 Approved: January/2015
ABSTRACT
Light is an important environmental variable for the regulation and control of broiler behavior. Some light sources may also add heat to the rearing environment, and indirectly affect the heat exchange between the birds and the environment. This study aimed at investigation the surface temperature and behavioral response of broilers reared in an environment with monochromatic light emitted diode (LED). Broilers were reared inside commercial dark houses under two treatments: fluorescent or LED light sources. Bird surface temperature and behavior was monitoredfrom the first day of grow-out. The houses were virtually divided in four quadrants, and the variables were monitored in the geometric center of each quadrant. Surface temperature results were mapped, behavioral responses were divided as normal and abnormal, and their interaction with light source was tested. Broiler surface temperature in both houses presented lack of homogeneity, independently of the light source. No effect of the light source on any of the evaluated behavior was found in the present study. The long life and energy savings obtained with the LED light source suggest its use in broiler production.
INTRODUCTION
Broiler production has greatly developed in recent decades due to technological innovations in genetics, nutrition, and rearing environment. Ambient temperature influences broiler performance particularly during the last week of the rearing period. Exposure to heat stress reducesfeed intake, consequently impairing broiler performance (Abeyesinghe et al., 2001; Tao & Xin, 2003; Shinder et al., 2007; Amaral
et al., 2011).
Amongst the strategies to prevent productivity losses due to heat stress, lighting controlhas been successfully applied. Broilers exposed to low light (< 5 lx) produce less sensible heat in the fourth and fifth weeks of the rearing period (Lin et al., 2006).
Preference studies using several lighting intensities have shown that broilers exhibit a preference for light intensity by six week of age. Young chicks (1 to 28 d of age) preferred brighter light (~20lx) (Berk, 1995). Another preference study showed that broilers preferred blue or green light to red or white light (Prayitno et al., 1997).
Light sources, distribution, and color, as well as the duration of the lighting period can affect broiler flock performance, behavior, and welfare (Kristensen et al., 2007; Mendes et al., 2010).Behavior is an important variable used to assess animal welfare. Broilers can behave differently under the same light intensity from two different sources that look identical to observers (Prayitno et al., 1997; Kristensen et al., 2007; Gongruttananun & Guntapa, 2012).
Thermal analysis is a method for identifying variations in environment temperature and broilers heat loss. Thermal images allow mapping the birds’ surface temperature and estimating theirbody thermoregulation, and ultimately the well-being of the flock (Aerts et al., 2003). The ability of birds to dissipate heat decreases as ambient temperature and relative humidity rises above the thermal neutral zone (Yahav et al., 2005; Lin et al., 2006).
The most common types of lamps used in the Brazilian poultry industry are incandescent, fluorescent, and sodium vapor lamps (Mendes et al., 2010). Light emitting diodes (LED) allows better uniformity of brightness distribution along the house than other sources of light. In addition, as LED lamps have a longer life than fluorescent light bulbs, the need to change bulbs is reduced (Rozenboim et al., 1999).
The present study aimed at comparing dark-house lighting using fluorescent and monochromatic light (LED) sources relative to the surface temperature and the behavior of broilers.
METHODOLOGY
The study was conducted in two commercial broiler farms in Itaquiraí, state of Mato Grosso, Brazil, located at latitude 23° 28 ‘28’’ S and longitude 54 ° 11’ 06’’ W, with a subtropical climate. The broiler houses were built according to the dark-house system, with forced negative ventilation, and were150 m long, 15 m wide, and 3.80 m high. The tiles were made of fiber cement, and black polypropylene was usedas drop-ceiling
material. The sidewalls were double: the outside wall was built with cement blocks, and the inner wall was drywall coated with black matte coating. Both houses were equipped with automatic feeders and nipple drinkers.
Two broiler houses were compared: one used flu-orescent light source, and the other used LED lamps. The house with fluorescent lamps had manual control of brightness according to the age of the birds, and the house with LED light source had a light intensity automatic controller.The lighting program was applied according to the rearing phase, as follows: 23.0L:1.0D (0-7days old), 18.0L:6.0D (8-21 days old), 20.0L:4.0D (22-35 days old), and 22.0L:3.0D (36-45 days old).
A total of 31,500 Cobb®500 broilers
(straight-run flocks) were housed in both houses. The rearing environment was automatically controlled in both houses with the set points shown in Table 1.Birds were managed according to the genetic company’s manual (Cobb, 2009).
Table 1– Set points used for the control of environmental temperature, relative humidity, and light intensity of the two evaluated dark houses.
Age (days) Environmental Temperature (ºC) Relative Humidity (%) Light intensity (lx)
7 31.0 76 25
14 29.0 75 5
21 27.0 73 5
28 26.0 70 5
35 24.0 63 5
42 23.0 69 5
Temperature variation= 2ºC; relative humidity variation=2%
Data recording
The broiler houses were virtually divided into four quadrants, and data were recorded in the geometric center of each quadrant. Birds’ surface temperatures (Ts) were recorded weekly using an infrared thermography camera (Testo® 880 V1.4, Germany) with an accuracy of ± 0.1 ° C and 7.5 spectra of 13 µ. The camera was positioned at a height of 1 m above the birds in order to obtain images that included the entire targeted bird. Surface temperature was recorded in the morning at 10:00 AM. The coefficient of emissivity (ε) adopted
At the same time Ts was recorded, broiler behavior was assessed at 7, 14, 21, 28, 35 and 42 days of the grow-out period. Broiler behavior was assessed using a video camera (Sony® DCR-TRV330, USA).
The video footage was taken of the broilers grouped in approximately 2 m2 during 10 minutes in each
quadrant, totaling 40 minutes per broiler house. Data were recorded for 20 min during the morning, from 8:00 to 9:00 AM, and for 20 min in the afternoon, from 2:00 to 3:00 PM.
Individual behaviors were classified into two categories (normal or abnormal) for analyses. This classification was based on the recommendations of Bizeray et al. (2002). The movements related to comfort (MC) were eating, drinking, walking, drinking, exploring, scratching, and dust bathing (Table 2), and were classified as normal or abnormal within each category. Relative to motion discomfort (MD), time budget analysis was performed considering normal and abnormal behaviors.
Data analysis
Ten surface temperature points were selected from the thermal images of each bird, and the average was calculated. These values were tested using the Student’s t-test, assuming normality of the data. Data were processed using the online software Vassarstats®
(2014). The Ts variable was analyzed by the software Surfer® (2010) used to draw geostatistical maps.
Video recordings were performed inside the broiler houses to evaluate the birds’ behavior. Hand video cameras were used, and detailed ethogram of the behaviors displayed was built. Direct observations were also performed. The images were obtained during 40 min in each house, being 10 minutes in each quadrant and covering an area of 2m2. In total,
104 broilers were observed in the video footage taken at each poultry house.
An ethogram based on Bizeray et al. (2002) was built (Table 2). The following behaviors were recorded: sitting (BS), eating (E), drinking (D), worth exploring (WE), motion discomfort (MD), and scratching (S). Images with behaviors caused by isolated events (external noises, entry of people on the premises, among others) were not considered in the analysis.
Broiler behavior was classified according to theamount of time each behavior was performed during the observation period. The intensity scale used was: very little (1), little (2), normal (3), enough (4), too much (5). Normal (0) and abnormal (1) behaviors were recorded and analyzed. Descriptive analysis was applied to the data using the online statistic software Vassarstat (2014). The odds ratio was subsequently calculated using the online software Medcalc (2014), assuming normality of data.
Table 2 – Ethogram used to assess broiler behavior.
Behavior Description
Sitting Eating Drinking
Exploring Scratching Dust bathing
Motion Confort Normal and Abnormal
When the breast of the bird is in contact with the litter.
Eating or pecking at the feeder.
Drinking water from the drinker.
Exploring the area with the beak.
When the bird explores its territory with its feet and beak, directed to the floor.
Revolving the litter, spreading it on the body or on the floor of the rearing area.
Motion Disconfort Normal and Abnormal Movements to stretch wings and legs on the same side of the body simultaneously, shaking the feathers and/or flapping.
RESULTS AND DISCUSSION
Surface temperature during the initial grow-out phase
The spatial distribution of the broilers’ surface temperature (Ts) in both houses during the starterphase (7, 14, and 21 days of age) is shown in Figure 1. Figure 2 presents the geostatistic maps of surface temperature during the finisher phase (28, 35, and 42 days of age). When birds were 7-d-old, Ts was lower (24 °C) at the entrance end of the house with fluorescent light source (FLU – 7) compared with the house with LED. A greater variation was found in the area in themiddle towards the end of the house with LED (35 °C). The values of Ts in the LED house reached 24 °C, and, in general, temperature ranged between 33 °C and 35 °C in the house with fluorescent lighting when broilers were 7-d-old (Figure 1a). The mean value of ambient temperature inside the LED house at 7d was 31.0 ± 2 ºC.
The Ts values when broilers were 14 days old in the house with fluorescent lamps (FLU – 14) remained lower at the air inletand increased along the house. Inside the house with LED lamps (LED – 14),the lowest values Ts were observed in the middle of the house. Ts was higher in the house air inlet (36 °C) than in the outlet (34 -36 °C) (Figure 1b) in the LED house. The mean value of ambient temperature inside the house with LED on day 14 was 29.0 ± 2 ºC.
When broilers were 21 days old, Ts values in the house with fluorescent light source (FLU- 21) varied between 24 and 34 °C at the air inlet. In the remainingarea,Ts ranged between 33 and 36 °C.A greater Ts variation was determined in the house with LED light source. The highest Ts values werefound in the middle towards the air outlet (36 °C) (Figure 1c) in the LED house. The mean value of ambient temperature inside the house with LED house was 27.0 ± 2 ºC on day 21.
Surface temperature during the finisher phase
Surface temperature when broilers were 28 days old remained lower in the areas close to the air inlet (24 to 31 °C)than in other areas of the fluorescent-lighted house. The Ts values found inside the LED-lighted house was 27 to 33 °C. Broilers in the other areas of the LED-lighted house presented a homogeneous distribution of Ts. The lower Ts values were determined in thehouse with LED light source (29 to 32 °C). The Ts values found inside the house with the source of
fluorescent light (FLU - 28) was 30 to 34 °C (Figure 2a). The mean value of ambient temperature during this phase inside the house with fluorescent light was 25.0 ± 2 ºC.
Mean surface temperature of 35-d-oldbroilers reared in the house with fluorescent light source was higher than 35°C, while those reared in the house with LED light source was 32 °C. The distribution of Ts in the area near the air outlet of the housewith fluorescent light source(FLU 35) ranged between 24and 32°C. In the house with LED (32°C), the variation was 24 to 29 °C (Figure 2b). The mean value of ambient temperature inside the house with fluorescent house was 24.0 ± 2 ºC.
The variation in Ts when broilers were 42 days old was lower (27 to 33 °C) in the house with LED light source than in the house with fluorescent light source (24 to 31 °C). In the central area andthe area near the air inlet and outlet, Ts ranged between 27 and 34 °C in the house with fluorescent light source. In the house with LED light source, mean Ts values were24 to34 °C (Figure 2c). The mean value of ambient temperature inside the house with LED was 23.0 ± 2.0 ºC. Because temperature control was automatic and uniform along the house (Table 1), the Ts variation detected may have been caused by the birds’ movement inside the house.
The variation of surface temperature depends on the interaction between the body heat, body insulation, surface blood circulation, and rearing temperature (Tao & Xin, 2003; Nääs et al., 2010). As the air temperature of the evaluated houses was controlled (Table 1), the results of birds’ surface temperature were relatively similar in both houses, which were different only as to the light source applied. The homeothermy in broilers is achieved by maintaining core body temperature close to 41.7 °C (Aerts et al., 2003; Amaral et al., 2011). Studies showed that the differences in broiler surface temperatures are associated with heat loss, as there are physiological changes when homeothermy is affected (Yahav et al., 2005; Cangar et al., 2008).
Studies comparing changes in broiler surface temperature suggest that this variation is associated with room temperature or withdietary energy content (Ferreira et al., 2011). In addition, average broiler Ts is also related with the temperatures of features of the rearing environment, such as side curtains and litter surface temperature (Baracho et al., 2011; Nascimento
et al., 2014).Body surface temperature can vary in the different body parts as the broiler grows, depending on air temperature and the birds’ feathering (Nääs et al., 2010). In the present study, possibly both evaluated broiler houses (with fluorescent and LED light sources) maintained ideal environmental conditions for each phase of the grow-out period.
Caneppele et al. (2014) reported that LED lamps are more energy-efficient because of its manufacturing process allows the inclusion of sources emitting light at different wavelength. Rosa & Araújo (2010) commented that the LED is much more efficient from the point of view of energy use than other types of lamp and, therefore, are more affordable to consumers.
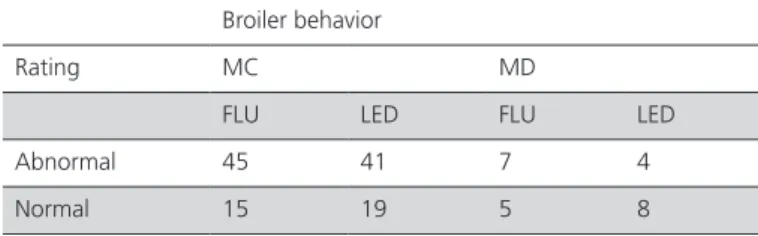
Relative to broiler behavior, there were no differences in the number of movements of comfort or discomfort, and normal or abnormal behaviors (p = 0.224) indicating that the behavior of broilers in both houses was similar (Table 3). Broilers exposed to different light intensities tend to show differences in some behaviors such as scratching; however, eating and drinking behaviors are not affected by light intensity (Kristensen et al., 2007). Alvino et al. (2009) found that groups of broilers submitted to the same light intensity showed some degree of synchrony of behaviors and similar levels of inactivity. However, no effect of the light source on any of the evaluated behaviors was found in the present study.
Table 3 – Comfort (MC) and discomfort (MD) movement behaviors classified as abnormal and normal of broilers reared in houses equipped with fluorescent (FLU) light source or with light emitting diode (LED) light source.
Broiler behavior
Rating MC MD
FLU LED FLU LED
Abnormal 45 41 7 4
Normal 15 19 5 8
n=104; significance level of 95%
The long life and energy savings obtained with the LED light source suggest its use in broiler production.
CONCLUSIONS
Broiler surface temperature in both broiler houses showed great variability, independently of the light source used. The evaluated light sources did not affect the behavior of broilers.
REFERENCES
Abeyesinghe SM, Wathes CM, Nicol CJ, Randall JM. The aversion of broiler chickens to concurrent vibrational and thermal stressors. Applied Animal Behaviour Science 2001;73:199-215.
Aerts M, Wathes CM, Berckmans D. Dynamic data-based ehavior of heat production and growth of broiler chickens: development of an integrated management system. Biosystems Engineering 2003;84:257-266.
Alvino GM, Archer GS, Mench JA. Behavioural time budgets of broiler chickens reared in varying light intensities. Applied Animal Behaviour Science 2009;118:54–61.
Amaral AG, Yanagi Junior T, Lima RR, Teixeira VH, Schiassi L, Efeito do ambiente de produção sobre frangos de corte sexados criados em galpão comercial. Arquivo Brasileiro de Medicina Veterinária e Zootecnia 2011;63:649-658.
Baracho MS, Nääs IA, Nascimento GR, Cassiano JA, Oliveira KR. Surface temperature distribution in broiler houses. Brazilian Journal of Poultry Science 2011;13:177-182.
Berk J. Light-choice by broilers. Proceedings of the 29th Intternational
Congress of the Society for Applied Ethiology; 1995; Potters Bar. UK: Universities Federation for Animal Welfare; 1995. p.S25-26
Bizeray D, Estevez I, Leterrier C, Faure JM. Effects of increasing environmental complexity on the physical activity of broiler chickens. Applied Animal Behaviour Science 2002;79:27–41.
Caneppele FL, Marquesini IA, Gabriel Filho LRA, Seraphim OJA. Sensibilidade espectral do olho das aves e a importância da composição espectral das fontes de luz artificial [cited 2014 Mar 13]. Anais do 3º Simpósio de Sustentabilidade e Ciência Animal; 2013; Pirassununga, São Paulo. Brasil. Available from: eha://sisca.com.br/resumos/SISCA_2013_064. pdf.
Cangar Ö, Aerts J-M, Buyse J, Berckmans D. Quantification of the spatial distribution of surface temperatures of broilers. Poultry Science 2008;87:2493-2499.
Cobb – Cobb Vantress Brasil. Manual de manejo de frangos de corte Cobb. Guapiaçu; 2009. p.1-65.
Ferreira VMOS, Francisco NS, Belloni M, Aguirre GMZ, Caldara FR, Nääs IA, et al. Infrared thermography applied to the evaluation of metabolic heat loss of chicks fed with different energy densities. Brazilian Journal of Poultry Science 2011;13:113-118.
Gongruttananun N, Guntapa P. Effects of red light illumination on productivity, fertility, hatchability and energy efficiency of Thai indigenous hens. Kasertsart Journal of Natural Science 2012;46:51-63.
Kristensen HH, Prescott NB, Perry GC, Ladewig J, Ersbøll AK, Overvad KC, Wathes CM. The ehavior of broiler chickens in different light sources and illuminances. Applied Animal Behaviour Science 2007;103:75–89.
Malheiros RD, Moraes VMB, Bruno LDG, Malheiros EB, Furlan RL, Macari M. Environmental temperature and cloacal and surface temperatures of broilers chicks in first weekpost hatch. Journal of Applied Poultry Research 2000;9:111-117.
Medcalc. Statistical software version 13.3 [cited 2014 Apr 20]. Available from: http://www.medcalc.org/calc/odds_ratio.php.
Mendes AS, Reffati R, Restelatto R, Paixão SJ. Visão e iluminação na avicultura moderna. Revista Brasileira de Agrociência 2010;16:05-13.
Nääs IA, Romanini CEB, Neves DP, Nascimento GR, Vercellino R. A. Broiler surface temperature distribution of 42 day old chickens. Scientia Agricola 2010;67:497-502.
Nascimento GR, Nääs IA, Baracho MS, Pereira DF, Neves DP. Termografia infravermelho na estimativa de conforto térmico de frangos de corte. Revista Brasileira de Engenharia Agrícola e Ambiental 2014;18:658-663.
Olanrewaju HA, Thaxton JP, Dozier WA, Purswell J, Roushand WB, Branton SL. A Review of lighting programs for broiler production. International Journal of Poultry Science 2006;5(4):301-308.
Prayitno DS, Phillips CJC, Stokes DK. The effects of color and intensity of light on behavior and leg disorders in broiler chickens. Poultry Science 1997;76:1674-1681.
Rosa ECA, Araujo GF. Diodo emissor de luz. 2010 [cited 2014 Feb 13]. Available from: http://www.demar.eel.usp.br/eletronica/2010/LED.pdf.
Rozenboim I, Biran I, Uni Z, Robinzon B, Halevy O. The effect of monochromatic light on broiler growth and development. Poultry Science 1999; 78: 135-138.
Shinder D, Rusal M, Tanny J, Druyan S, Yahav S. Thermoregulatory responses of chicks (Gallus domesticus) to low ambient temperatures at an early age. Poultry Science 2007;86:2200-2209.
Surfer..Contouring 3D surface mapping for scientists and engineers. 2010
[cited 2014 Mar 12]. Available from: http://www.goldensoftware.com.
Tao X, Xin H. Acute synergistic effects of air temperature, humidity, and velocity on homeostasis of market-size broilers. Transactions of the ASAE 2003;46:491-497.
Vassarstat. Website for statistical computation [cited 2014 Apr 20]. Available from: http://vassarstats.net/.
Yahav S, Straschnow A, Luger, D, Shinder D, Tanny J, Cohen S. Ventilation, sensible heat loss, broiler energy, and water balance under harsh environmental conditions. Poultry Science 2004;83:253-258.