GENOTYPE BY ENVIRONMENT INTERACTION IN COWPEA LINES USING
GGE BIPLOT METHOD
1MASSAINE BANDEIRA E SOUSA2, KAESEL JACKSON DAMASCENO-SILVA3*, MAURISRAEL DE MOURA
ROCHA3, JOSÉ ÂNGELO NOGUEIRA DE MENEZES JÚNIOR3, LAÍZE RAPHAELLE LEMOS LIMA2
ABSTRACT – The GGE Biplot method is efficien to identify favorable genotypes and ideal environments for evaluation. Therefore, the objective of this work was to evaluate the genotype by environment interaction (G×E) and select elite lines of cowpea from genotypes, which are part of the cultivation and use value tests of the Embrapa Meio-Norte Breeding Program, for regions of the Brazilian Cerrado, by the GGE-Biplot method. The grain yield of 40 cowpea genotypes, 30 lines and 10 cultivars, was evaluated during three years (2010, 2011 and 2012) in three locations: Balsas (BAL), São Raimundo das Mangabeiras (SRM) and Primavera do Leste (PRL). The data were subjected to analysis of variance, and adjusted means were obtained to perform the GGE-Biplot analysis. The graphic results showed variation in the performance of the genotypes in the locations evaluated over the years. The performance of the lines MNC02-675F-4-9 and MNC02-675F-4-10 were considered ideal, with maximum yield and good stability in the locations evaluated. There mega-environments were formed, encompassing environments correlated positively. The lines MNC02-675F-4-9, MNC02-675F-9-3 and MNC02-701F-2 had the best performance within each mega-environment. The environment PRL10 and lines near this environment, such as MNC02-677F-2, MNC02-677F-5 and the control cultivar (BRS-Marataoã) could be classified as those of greater reliability, determined basically by the genotypic effects, with reduced G×E. Most of the environments evaluated were ideal for evaluation of G×E, since the genotypes were well discriminated on them. Therefore, the selection of genotypes with adaptability and superior performance for specific environments through the GGE-Biplot analysis was possible.
Keywords: Vigna unguiculata. Grain yield. Adaptability and stability.
INTERAÇÃO GENÓTIPOS X AMBIENTES EM LINHAGENS DE FEIJÃO-CAUPI PELO MÉTODO GGE BIPLOT
RESUMO - O método GGE Biplot é eficiente em identificar genótipos favoráveis e ambientes ideais para avaliação. Portanto, o objetivo deste trabalho foi avaliar a interação genótipo por ambientes (G×A) de linhagens elite de feijão-caupi nos ensaios de valor de cultivo e uso (VCU) da Embrapa Meio-Norte, realizados nas regiões de Cerrado do Brasil, por meio de analises via GGE Biplot. Avaliou-se a produtividade de grãos em 40 genótipos de feijão-caupi, sendo 30 linhagens e 10 cultivares, durante três anos (2010, 2011 e 2012) em três locais: Balsas (BAL), São Raimundo das Mangabeiras (SRM) e Primavera do Leste (PRL). Os dados foram submetidos a análises de variância, a partir da qual foram obtidas as médias ajustadas para realizar a análise via GGE-Biplot. Os resultados gráficos revelam que houve variação no comportamento dos genótipos nos locais avaliados ao longo dos anos. As linhagens MNC02-675F-4-9 e MNC02-675F-4-10 apresentaram desempenhos de um genótipo ideal, com máxima produtividade aliada à boa estabilidade nos locais de avaliação. Houve a formação de três mega-ambientes que englobaram ambientes correlacionados positivamente. As linhagens MNC02-675F-4-9, MNC02-675F-9-3 e MNC02-701F-2 apresentaram o melhor desempenho médio dentro de cada mega-ambiente. O ambiente PRL10 e as linhagens próximas a este ambiente, como MNC02-677F-2, MNC02-677F-5 e a cultivar testemunha BRS-Marataoã, puderam ser classificados com maior confiabilidade, determinados basicamente pelos efeitos genotípicos, com G×A reduzida. A maioria dos ambientes avaliados foram ideais para avaliação da G×A, discriminando bem os genótipos. Portanto, a análise GGE-Biplot, permitiu selecionar genótipos com adaptabilidade e desempenhos superiores para ambientes específicos.
Palavras-chave: Vigna unguiculata. Produtividade de grãos. Adaptabilidade e estabilidade. ____________________
*Corresponding author
INTRODUCTION
Cowpea (Vigna unguiculata (L.) Walp.) has phenotypic plasticity and high genetic variability, thus, it is adapted to different edaphoclimatic conditions. The cowpea yield in Brazil vary depending on the region, mainly due to the different climatic conditions (FREIRE FILHO et al., 2011). In addition to environmental effects, the genotype by environment interaction (G×E) is observed when considering different environments for a group of genotypes (CRUZ, 2010). Thus, G×E is defined as the distinct performance of the genotype in different environments (RESENDE; DUARTE, 2007).
The commercial success of a cowpea cultivar depends on its agronomic performance in one or more locations. However, to identify and select lines with superior performance in different environmental conditions is necessary due to the G×E. This effect increases costs of plant breeding programs, since more evaluations are required.
Plant breeders evaluate genotypes in multi-environments, representing favorable and unfavorable growing conditions, to estimate and understand the complexity of the G×E. In this context, G×E may be classified as simple, when the classification of genotypes remains constant in various environments and the significant interaction is due to differences in the magnitude of the response; or complex, when the classification of the genotype is different from one environment to another, which is quite common and has greater importance in plant breeding (MOHAMMADI; AMRI, 2013).
Conventional methodologies that partition the total variation into components due to genotype (G), environment (E) and G×E, provide little information on predominant patterns in the interaction (KEMPTON, 1984). Thus, other methods have been used to describe the G×E, such as regression analysis (GAUCH, 1988), multivariate analysis (WESTCOFF, 1987), biplot graphs using the additive main effect and multiplicative interaction (AMMI) model (GAUCH, 1992) and GGE-Biplot analysis (Genotype main effects + Genotype environment interaction) (YAN et al., 2000). The main difference between the AMMI and GGE-Biplot models is in the first stage of the analysis. The effect of G+G×E is analyzed directly in the GGE-Biplot model and in the AMMI, G is separated from the G×E, however, in last stage of the analysis there is formation of biplot graphs in both models.
The advantages of the GGE-Biplot analysis is the easy understanding of its biplot graphs, effective contribution to identify mega-environments,
selection of representative and discriminative environments and indication of more adapted and stable cultivars to specific environments (GAUCH; PIEPHO; ANNICCHIARICO, 2008; ALWALA et al., 2010; SILVA; BENIN, 2012). Moreover, the GGE-Biplot methodology has been effective to explain G×E in cowpea (AKANDE, 2007; SANTOS et al., 2016), sugarcane (MATTOS et al., 2013), wheat (MEHARI et al., 2015; KAYA; AKÇURA, 2006) and maize (PAGLIOSA et al., 2015; HONGYU et al., 2015). However, few studies evaluated G×E and determination of mega-environments using the GGE-Biplot methodology on cowpea genotypes in regions of the Brazilian Cerrado.
Therefore, the objective of this work was to evaluate the G×E and select elite lines of cowpea from genotypes, which are part of the cultivation and use value tests of the Embrapa Meio-Norte Breeding Program, with high grain yield, adaptability and stability for regions of the Brazilian Cerrado, by the GGE-Biplot method.
MATERIAL AND METHODS
Forty cowpea genotypes (30 lines and 10 cultivars), which are part of the cultivation and use value tests of the Embrapa Meio-Norte Breeding Program, were evaluated (Table 1). The experiments were conducted during the years 2010, 2011 and 2012, in the States of Maranhão (Balsas and São Raimundo das Mangabeiras) and Mato Grosso (Primavera do Leste), under rainfed conditions (Table 2). Each combination of year and location were considered as one environment for statistical analysis, totaling nine environments, namely Balsas 2010 (BAL10), 2011 (BAL11) and 2012 (BAL12), São Raimundo das Mangabeiras 2010 (SRM10), 2011 (SRM11) and 2012 (SRM12) and Primavera do Leste 2010 (PRL10), 2011 (PRL11) and 2012 (PRL12).
Table 1. Cowpea genotypes of the Embrapa Meio-Norte evaluated in nine cultivation and use value tests, conducted in the in the States of Maranhão (Balsas and São Raimundo das Mangabeiras) and Mato Grosso (Primavera do Leste), Brazil, in the years 2010, 2011 and 2012.
SE = semi-erect; E = erect; SP = semi-prostrated; P: prostrated; Lines were represented by the codes L1 to L30; Cultivars were represented by the codes C1 to C10; Means evaluated by the Scott-Knott test (p≤0.05).
Table 2. Geographic coordinates, average annual precipitation and soil of the experimental sites, located in the States of
Maranhão (Balsas and São Raimundo das Mangabeiras) and Mato Grosso (Primavera do Leste), Brazil, in the years 2010, 2011 and 2012.
Site State Altitude (m) Latitude (S) Longitude (W) Average annual precipitation * Soil (SiBCS)
Balsas Maranhão 324 07º54’ 45º96’ 1190 mm Yellow Latosol
São Raimundo das
Mangabeiras Maranhão 511 06º53’ 45º39’ 1157 mm Yellow Latosol
Primavera do Leste Mato Grosso 636 15°33’ 54°17’ 1784 mm Yellow Latosol Code Genotype (kg haMean -1) Growth habit Commercial Subclass
L1 MNC02-675F-4-9 1622.8 a SE Smooth Brown
L2 MNC02-675F-4-10 1519.8 a SE Smooth Brown
L3 MNC02-675F-9-2 1562.1 a SE Smooth Brown
L4 MNC02-675F-9-3 1528.4 a SE Smooth Brown
L5 MNC02-676F-3 1589.7 a SE Smooth Brown
L6 MNC02-682F-2-6 1317.3 b SE Smooth White
L7 MNC02-683F-1 1454.5 a SE Smooth White
L8 MNC02-684F-5-6 1535.0 a SE Smooth White
L9 MNC03-725F-3 1310.5 b SE Smooth White
L10 MNC03-736F-7 1383.0 a SE Smooth White
L11 MNC03-737F-5-1 1322.5 b SE Smooth White
L12 MNC03-737F-5-4 1374.4 a SE Smooth White
L13 MNC03-737F-5-9 1288.2 b SE Smooth White
L14 MNC03-737F-5-10 1159.2 b SE Smooth White
L15 MNC03-737F-5-11 1402.0 a SE Smooth White
L16 MNC03-737F-11 1386.6 a SE Smooth White
L17 MNC01-649F-1-3 1298.9 b SP Brown-striped
L18 MNC01-649F-2-1 1241.4 b SP Brown-striped
L19 MNC01-649F-2-11 1282.8 b SP Brown-striped
L20 MNC02-675-4-9 1324.2 b SP Smooth Brown
L21 MNC02-675F-9-5 1243.8 b SP Smooth Brown
L22 MNC02-676F-1 1308.8 b SP Smooth Brown
L23 MNC02-677F-2 1239.0 b SP Evergreen
L24 MNC02-677F-5 1323.4 b SP Smooth Brown
L25 MNC02-680F-1-2 1131.2 b SP Evergreen
L26 MNC02-689F-2-8 1219.3 b SP Evergreen
L27 MNC02-701F-2 1439.6 a SP Smooth White
L28 MNC03-736F-2 1183.7 b SP Smooth White
L29 MNC03-736F-6 1087.5 b SP Smooth White
L30 MNC03-761F-1 1211.3 b SP Evergreen
C1 BRS Tumucumaque 1574.6 a E Smooth White
C2 BRS Cauamé 1516.1 a E Smooth White
C3 BRS Itaim 1356.7 a E Blackeye
C4 BRS Guariba 1575.8 a E Smooth White
C5 Pingo de ouro-1-2 1299.4 b P Crowder
C6 BRS Xiquexique 1451.2 a P Smooth White
C7 BRS Juruá 839.2 b P Green
C8 BRS Aracê 1031.3 b P Green
C9 BR17 Gurguéia 1142.0 b P Evergreen
C10 BRS Marataoã 1233.8 b P Evergreen
Grain yield data (kg ha-1) were subjected to
analysis of variance using the generalized linear model and subsequently, the adjusted means were estimated. In the GGE-Biplot analysis, only the main effect of genotype and G×E are important and must be considered together, and the main effect of the environment is not relevant for the selection of cultivars. GGE-Biplot is built on the first two major components of a principal component analysis (PCA) using Site Regression (SREG) model. When the first component is highly correlated with the main effect of the genotype, the proportion of the yield is considered to be due only to the characteristics of the genotype. The second component represents the part of the yield due to the G×E (YAN, 2011). The GGE-Biplot model maintains the terms G and G×E together in two multiplicative terms, which can be seen in the following equation:
where, is the expected yield of the genotype in the environment ; is the general mean of the observations; is the principal effect of the environment ; and are principal scores of the genotype and environment , respectively; and are secondary scores for the genotype
𝑌𝑖𝑗 − 𝜇 − 𝛽𝑗 =𝑔1𝑗𝑒1𝑗 +𝑔2𝑗𝑒2𝑗+𝜀𝑖𝑗,
1
𝑌𝑖𝑗 𝑖
𝑗 𝜇
𝛽𝑗
𝑗 𝑔1𝑗 𝑒1𝑗
𝑖 𝑗
𝑔2𝑗 𝑒2𝑗
𝑖
and environment , respectively; is the not explained residue of both effects.
The development of each genotype in each environment was plotted with analyzes by GGE-Biplot using the package GGEGGE-BiplotGUI (FRUTOS; GALINDO; LEIVA, 2014) implemented in the software R (R CORE TEAM, 2015).
RESULTS AND DISCUSSION
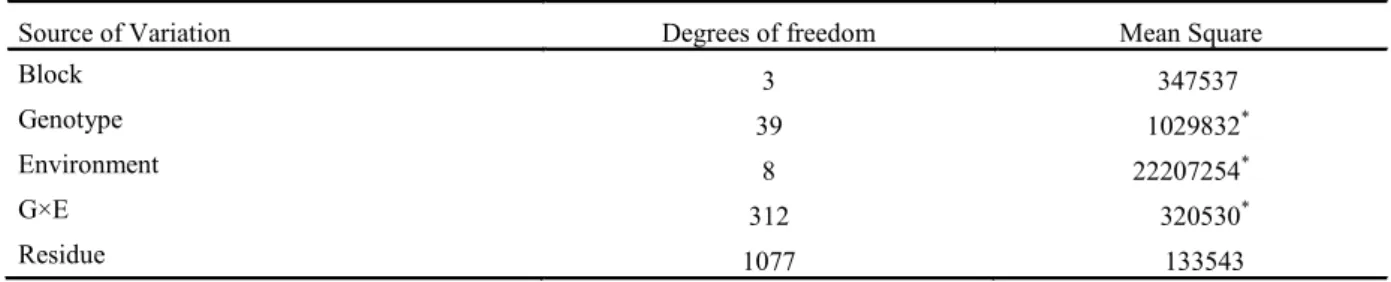
The mean squares (MS) of the fixed effects by the joint analysis of variance (Table 3), considering each year in each location as an environment, showed highly significant differences (p<0.01) for the environment, genotype and G×E. Rocha et al. (2007) and Barros et al. (2013) found similar results for these three sources of variation in cowpea genotypes grown in the mid-north of Brazil. According to Rocha et al. (2007), variations between environments are probably due to the strong interaction between years and sites, due to the occurrence of abiotic stresses. The detection of significant G×E denotes the existence of interaction or dependence between genotypes and environments in relation to grain yield, i.e., indicates that the genotypes have different responses to different environments.
𝑗 𝜀𝑖𝑗
Table 3. Joint analysis of variance of grain yield (kg ha-1) for 40 cowpea genotypes evaluated in nine environments of the
Brazilian Cerrado, in the years 2010, 2011 and 2012.
Source of Variation Degrees of freedom Mean Square
Block 3 347537
Genotype 39 1029832*
Environment 8 22207254*
G×E 312 320530*
Residue 1077 133543
1
*= significant at p≤0.01.Studies on G×E using fixed effects and additive models are common in the literature for cowpea crops. Shiringani and Shimelis (2011) evaluated the stability of ten cowpea genotypes and found significant interactions between genotypes, planting timing and site for grain yield. Their results assisted in the recommendation of specific or highly adapted and productive lines for crops in regions of South Africa. Nunes et al. (2014) evaluated 20 cowpea genotypes in environments of the Brazilian Cerrado and also found significant interactions between genotypes and environments, using four methodologies to evaluate the adaptability and yield stability.
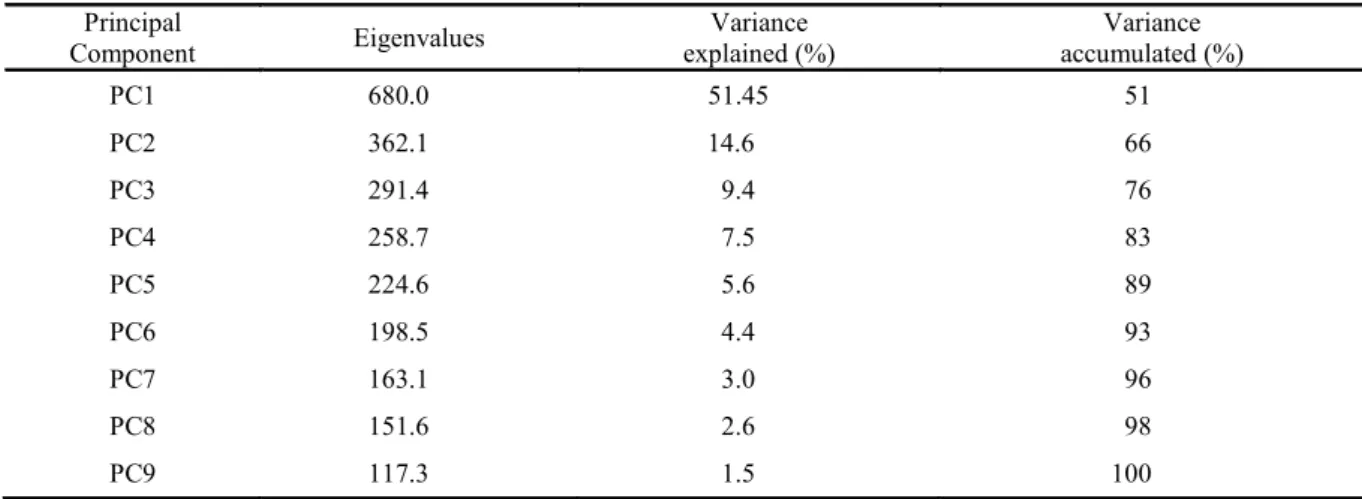
Table 4. Importance of the principal components (PC) for analysis of 40 cowpea genotypes in nine environments by the GGE-Biplot methodology.
Principal
Component Eigenvalues explained (%) Variance accumulated (%) Variance
PC1 680.0 51.45 51
PC2 362.1 14.6 66
PC3 291.4 9.4 76
PC4 258.7 7.5 83
PC5 224.6 5.6 89
PC6 198.5 4.4 93
PC7 163.1 3.0 96
PC8 151.6 2.6 98
PC9 117.3 1.5 100
1
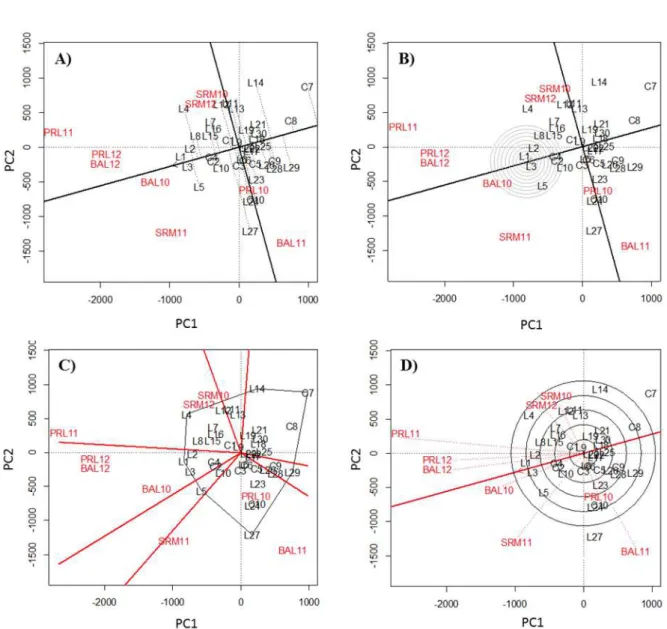
The biplots related to the performance of the genotypes were formed using the first two principal components. The GGE-Biplot representation (mean × stability) is an effective tool to evaluate genotypes in both aspects (YAN, 2011). The greater the projection of a genotype in relation to axis 1, the lower its stability, and the more distant the genotypes in relation to axis 2 (perpendicular to axis 1) the higher its yield (Figure 1A). Thus, the lines L1, L2, L3 and cultivar C4 had high stability combined with high grain yield. The lines L9, L18 and L20 had stability (with minimum projection of axis 1), however, these lines had no promising grain yield (Table 1). In general, the lines L14 and L27 showed the most variable performance among environments. The line L27 had low yield and stability, however, it had an advantageous performance in relation to the other genotypes grown in the environment BAL (Balsas MA) (Figure 1A).
GGE-Biplot method is advantageous by showing the ideal genotype and environment, which can be used as a reference to evaluate genotypes and select environments with greater G×E (SANTOS et al., 2016). It shows the relative performance of the genotypes in relation to what would be the ideal performance of a hypothetical genotype (genotype with maximum yield and good stability), represented by circles in the graph (Figure 1B). Based on these criteria, the lines with performance close to the ideal genotype were L1, L3, L2, L5, L8 and cultivars C4 and C2, from which the lines L1 and L3 had superior performance compared with the others, with higher yield and good stability.
Another advantage of the GGE-Biplot method is the possibility of grouping the evaluation environments in mega-environments, determining
which genotypes are the best for each mega-environment, facilitating the selection of
the G×E, with greater accuracy to identify mega-environments and select stable and adapted genotypes for specific environments and
mega-environments (SILVA; BENIN, 2012). Thus, the biplot who-wins-where visually grouped test environments, determining the genotypes with the
best average performance for each mega-environment. The results of the biplot who-wins-where showed three mega-environments
(Figure 1C). The first formed by environments SRM10, SRM12 and PRL11; the second by BAL10, BAL12 and PRL12; and the third by SRM11, PRL10 and BAL11. The lines L4 in the first, L1 in the second and L27 in the third mega-environment, were located at the vertices of the polygon, thus
showing the best average performance. Akande (2007), used the GGE-Biplot methodology
to evaluate grain yield and number of days for
flowering of cowpea lines and found three mega-environments. The results were efficient to
group the environments that tend to induce similar adaptation of the cowpea lines. Olayiwola, Soremi and Okeleye (2015) also used the GGE-Biplot methodology and found promising results to identify more productive genotypes with good stability for the study region.
A selected environment must have greater discrimination of the genotypes and be representative. Thus, the objective of the evaluation environment test was to identify environments that could be used to effectively select superior genotypes for a mega-environment. Therefore, the most
discriminating environments, represented by
those with the longest vectors, were shown in the GGE-Biplot graph
Figure 1. Results of the GGE-Biplot method A) mean × stability; B) ideal genotype; C) who-wins-where; and D) discrimination-and-representativeness for grain yield of 40 genotypes (L1 to L30, and C1 to C10) of cowpea, evaluated in nine environments of the Brazilian Cerrado: Balsas 2010 (BAL10), 2011 (BAL11) and 2012 (BAL12), São Raimundo das Mangabeiras 2010 (SRM10), 2011 (SRM11) and 2012 (SRM12) and Primavera do Leste 2010 (PRL10), 2011 (PRL11) and 2012 (PRL12).
The correlation between environments is shown by the angle between their vectors (YAN; TINKER, 2006); the lower the angle between two vectors is than 90º, the better the correlation between environments. Therefore, most environments were positively correlated (Figure 1D). Moreover, the year factor affected the G×E, for example, SRM11 and BAL11, had negative correlation (obtuse angle), indicating that the year 2011 was probably atypical for these sites. Santos et al. (2016) also found positive and negative correlations between environments, and defined it as the combination of year and site, using the GGE Biplot approach to access the interaction between cowpea genotypes and their production environments.
However, the GGE-Biplot method captures only a small percentage of the total variability, which
(YANG et al., 2009). Despite this limitation, the GGE-Biplot method has been shown to be efficient in evaluating and demonstrating the effects of the G×E, as seen here and in several other studies (SANTOS et al., 2016; PAGLIOSA et al., 2015). Moreover, this method simultaneously identifies genotypes with high grain yield and stability for a wide range of environments (MEHARI et al., 2015). Pagliosa et al. (2015) evaluate the response of maize genotypes to different fertilization and environments using the GGE-Biplot, and showed the efficiency of this method to identify promising and stable genotypes, and environments that optimize the performance of the genotypes.
The GGE-Biplot method was efficient in detecting the genotype by environment interaction and identifying the most stable genotypes and best environments.
MNC02-675F-4-9, MNC02-675F-4-10 and MNC02-675F-9-2 are potential lines to be grown in environments of the Brazilian Cerrado, since they had high grain yield with stability and adaptability.
The lines MNC02-676F-3 and MNC02-684F-5-6 and the cultivar BRS Cauamé showed superior performance compared to the other genotypes, and were considered close to the ideal genotype.
ACKNOWLEDGEMENTS
The authors thank the Coordination for the Improvement of Higher Education Personnel (CAPES) for financing this research, and the Brazilian Agricultural Research Corporation (Embrapa Meio-Norte) for providing the data used in this study.
REFERENCES
AKANDE, S. R. Genotype by environment interaction for cowpea seed yield and disease reactions in the forest and derived savanna agro-ecologies of south-west Nigeria. American-Eurasian Journal of Agricultural & Environmental Science, Deira, v. 2, n. 2, p. 163-168, 2007.
ALWALA, S. et al. A comprehensive comparison between Eberhart and Russel joint regression and GGE-Biplot analyses to identify stable and high yielding maize hybrids. Field Crops Research, Amsterdam, v. 119, n. 2-3, p. 225-230, 2010. BARROS, M. A. et al. Adaptabilidade e estabilidade produtiva de feijão-caupi de porte semiprostrado. Pesquisa Agropecuária Brasileira, Brasília, v. 48, n. 4, p. 403-410, 2013.
CRUZ, C. D. Princípios de Genética Quantitativa. 1. ed. Viçosa, MG: UFV, 2010. 394 p.
FREIRE FILHO, F. R. et al. Feijão-caupi: produção, melhoramento genético, avanços e desafios. Brasília, DF: Embrapa Informação Tecnológica, 2011. 81 p.
FRUTOS, E.; GALINDO, M. P.; LEIVA, V. An
GAUCH, H. G. Model selection and validation for yield trials with interaction. Biometrics, Arlington, v. 44, n. 3, p. 705-715, 1988.
GAUCH, H. G. Statistical analysis of regional yield trials: AMMI analysis of factorial designs. 1. ed. Amsterdam: Elsevier, 1992. 278 p.
GAUCH, H. G.; PIEPHO, H. P.;
ANNICCHIARICO, P. Statistical analysis of yield trials by AMMI and GGE: Further considerations. Crop Science, Madison, v. 48, n. 3, p. 866-889, 2008.
HONGYU, K. et al. Comparação entre os modelos AMMI e GGE-Biplot para os dados de ensaios multi-ambientais. Revista Brasileira de Biometria, São Paulo, v. 33, n. 2, p. 139-155, 2015.
KAYA, Y. M.; AKÇURA, T. S. GGE-Biplot analysis of multienvironment yield trials in bread wheat. Turkish Journal of Agriculture and Forestry, Tübitak, v. 30, n. 5, p. 325-337, 2006. KEMPTON, R. A. The use of biplots in interpreting variety by environment interactions. The Journal of Agricultural Science, Cambridge, v. 103, n. 1, p. 123–135, 1984.
MATTOS, P. H. C. et al. Evaluation of sugarcane genotypes and production environments in Paraná by GGE-Biplot and AMMI analysis. Crop Breeding and Applied Biotechnology, Viçosa, v. 13, n. 1, p. 83-90, 2013.
MEHARI, M. et al. GGE-Biplot analysis of genotype-by-environment interaction and grain yield stability of bread wheat genotypes in South Tigray, Ethiopia. Communications in Biometry and Crop Science, Warsaw, v. 10, n. 1, p. 17–26, 2015.
MOHAMMADI, R.; AMRI, A.
Genotype×environment interaction and genetic improvement for yield and yield stability of rainfed durum wheat in Iran. Euphytica, Wageningen, v. 192, n. 3, p. 227–249, 2013.
NUNES, H. F. et al. Grain yield adaptability and stability of blackeyed cowpea genotypes under rainfed agriculture in Brazil. African Journal of Agricultural Research, Nairobi, v. 9, n. 2, p. 255-261, 2014.
PAGLIOSA, E. S. et al. Análise GGE-Biplot de genótipos de milho sob diferentes formas de adubação em sistema de agricultura familiar. Semina: Ciências Agrárias, Londrina, v. 36, n. 5, p. 2965-2976, 2015.
R CORE TEAM. R: A language and environment for statistical computing. R Foundation for Statistical Computing, Vienna, Austria, 2015. Disponível em: <http://www.R-project.org/>. Acesso em: 14 jun. 2016.
RESENDE, M. D. V.; DUARTE, J. B. Precisão e controle de qualidade em experimentos de avaliação de cultivares. Pesquisa Agropecuária Tropical, Goiânia, v. 37, n. 3, p. 182-194, 2007.
ROCHA, M. M. et al. Adaptabilidade e estabilidade produtiva de genótipos de feijão-caupi de porte semi-ereto na região Nordeste do Brasil. Pesquisa Agropecuária Brasileira, Brasília, v. 42, n. 9, p. 1283-1289, 2007.
SANTOS, et al. Adaptability and stability of erect cowpea genotypes via REML/BLUP and GGE-Biplot. Bragantia, São Paulo, v. 75. n. 3, p. 299-306, 2016.
SHIRINGANI, R. P.; SHIMELIS, H. A. Yield response and stability among cowpea genotypes at three planting dates and test environment. African Journal of Agricultural Research, Nairobi, v. 6, n. 4, p. 3259-3263, 2011.
SILVA, R. R.; BENIN, G. Análises Biplot: conceitos, interpretações e aplicações. Ciência Rural, Santa Maria, v. 42, n. 8, p. 1404-1412, 2012. WESTCOFF, B. A method of analysis of the yield stability of crops. Journal of Agricultural Science, Toronto, v. 108, n. 1, p. 267–274, 1987.
YAN, W. et al. Cultivar evaluation and mega environment investigation based on GGE-Biplot. Crop Science, Madison, v. 40, n. 3, p. 597-605, 2000.
YAN, W. GGE-Biplot vs. AMMI Graphs for Genotype-by-Environment Data Analysis. Journal of the India Society of Agricultural Statistics, New Delhi, v. 65, n. 2, p. 181-193, 2011.
YAN, W.; TINKER, N. A. Biplot analysis of multienvironment trial data: Principles and applications. Canadian Journal of Plant Science, Ottawa, v. 83, n. 6, p. 623-645, 2006.