ASSESSING THE CANOPY INTEGRITY USING CANOPY DIGITAL IMAGES IN
SEMIDECIDUOUS FOREST FRAGMENT IN SÃO CARLOS - SP- BRAZIL
1Thiago Yamada2*, Emerson Carlos Pedrino3, João Juares Soares4 and Maria do Carmo Nicoletti3
1 Received on 06.07.2016 accepted for publication on 14.08.2017.
2 Universidade Federal de São Carlos, Doutorado em Ecologia e Recursos Naturais, São Paulo, Brasil. E-mail: <thyago.yamada@gmail.com>.
3 Universidade Federal de São Carlos, Departamento de Computação, São Paulo, Brasil. E-mail: <emerson@dc.ufscar.br> and <carmo@dc.ufscar.br>.
4 Universidade Federal de Sergipe, Campus Itabaiana, Sergipe, Brasil. E-mail: <juares@ufscar.br>. *Corresponding author.
ABSTRACT – It is well-known that conducting experimental research aiming the characterization of canopy structure of forests can be a difficult and costly task and, generally, requires an expert to extract, in loco, relevant information. Aiming at easing studies related to canopy structures, several techniques have been proposed in the literature and, among them, various are based on canopy digital image analysis. The research work described in this paper empirically compares two techniques that measure the integrity of the canopy structure of a forest fragment; one of them is based on central parts of canopy cover images and, the other, on canopy closure images. For the experiments, 22 central parts of canopy cover images and 22 canopy closure images were used. The images were captured along two transects: T1 (located in the conserved area) and T2 (located in the naturally disturbance area). The canopy digital images were computationally processed and analyzed using the MATLAB platform for the canopy cover images and the Gap Light Analyzer (GLA), for the canopy closure images. The results obtained using these two techniques showed that canopy cover images and, among the employed algorithms, the Jseg, characterize the canopy integrity best. It is worth mentioning that part of the analysis can be automatically conducted, as a quick and precise process, with low material costs involved.
Keywords: Canopy closure images; Canopy cover images; Digital image processing.
AVALIANDO A INTEGRIDADE DO DOSSEL POR MEIO DE IMAGENS
DIGITAIS EM FRAGMENTO DE FLORESTA ESTACIONAL SEMIDECÍDUA EM
SÃO CARLOS - SP - BRASIL
RESUMO – É notório que a realização de pesquisa experimental com o objetivo de avaliar a estrutura do dossel de florestas é uma tarefa difícil e custosa, que geralmente requer um especialista para extrair, in loco, suas informações mais relevantes. Com o objetivo de facilitar a realização de estudos relacionados à estrutura do dossel, vários métodos foram propostos na literatura, entre eles, alguns que se baseiam na utilização de imagens digitais do dossel. Este trabalho compara empiricamente duas técnicas que medem a integridade da estrutura do dossel em um fragmento de floresta; uma baseada nas partes centrais das imagens da cobertura do dossel e outra nas imagens da oclusão do dossel. Para a comparação, foram utilizadas 22 partes centrais
das imagens da cobertura do dossel e 22 imagens da oclusão do dossel. As imagens foram capturadas, in
loco, ao longo de dois transectos: T1 (localizado em uma área conservada) e T2 (localizado em uma área
1. INTRODUCTION
According to the Pesquisa FAPESP magazine (2012), the native forests and fields have grown for the second consecutive decade in the state of São Paulo, after about half a century of disturbance waves that have left the territory almost without natural vegetation cover. According to a survey carried out by the Forest Institute, based on satellite images obtained in 2008 and 2009, 4.34 million hectares of fields and natural forests in the state were identified. Even with native forest cover increasing, the use of forest ecosystems for agricultural purposes has led to an increase in the number of forest fragments.
These fragments present serious problems, such as: a large number of dead trees and a high occurrence of lianas. However, they present a large number of rare species, as well as the development of species belonging to the initial stages of succession. A fragment can be defined as any area of continuous native vegetation, interrupted by anthropic actions (such as roads, agriculture, among others) or natural barriers, which interfere with the natural flow of animals, pollen grains or seeds, among others (Viana, 1990).
In the workshop on monitoring forest dynamics, held in Brasilia in 2014, several environmental issues were discussed, such as carbon stocks, greenhouse gas flows and biodiversity. During the meeting both, the need to monitor deforestation and the dynamics of forests (forest disturbance) were highlighted. Disturbance is the status of a forest that can be characterized between an intact forest (with no sign of significant human activity) and a pasture area. It is a state in which a forest has not yet been completely deforested.
Gaps are localized areas resulting from disturbances whose effect causes the canopy to open or the decrease in canopy cover (Lima, 2005a), which can be defined
by the vertical projection of the canopy openness up to a height of 2 meters above the ground with a minimum area of 20 m2 (Brokaw, 1982).
The decrease in forest cover allows a large penetration of solar radiation, which consequently changes the temperature and humidity of the air and soil (Calegari et al., 2010). On the one hand, gaps can increase floristic diversity, a condition that many species need for their development, promoting a favorable environment for the natural regeneration of tropical forests (Brokaw, 1982; Denslow and Hartshorn, 1994; Tabarelli and Mantovani, 1997; Armelin and Mantovani, 2001). On the other hand, gaps may alter the structure of a forest, limiting the establishment of native flora and fauna (Brown et al., 2000) and promoting the development of invasive species (Parendes and Jones, 2000). Other factors such as topographic context, soil characteristics, climate and surrounding vegetation regulate the species composition (Chazdon, 2012).
Gaps can be classified as being artificial or natural. Artificial gaps are usually caused by selective cutting, pesticides, edge effect, among other causes. Natural gaps are mainly a consequence of natural disturbances such as lightning, dead old trees, falling trees, diseased trees, wind-decapitated trees, which totally or partially remove forest cover at different time and space scales (Chazdon, 2012), continuously modifying the integrity of the canopy structure of the forest. In addition to causing impacts on biodiversity conversion, clearings alter several ecosystem functions, such as energy flow and nutrient cycling.
To evaluate the integrity of a canopy structure, two relevant concepts should be considered, the canopy cover and the canopy closure. Briefly described, the canopy closure is concerned with measuring the luminosity in a specific point while the canopy cover
analisadas, por meio de técnicas de processamento digital de imagens, utilizando o MATLAB para análise
das imagens da cobertura do dossel e o Gap Light Analyzer (GLA) para análise das imagens da oclusão
do dossel. Os resultados obtidos usando as duas técnicas revelaram que as imagens da cobertura do dossel e o algoritmo Jseg caracterizaram melhor a integridade do dossel. Por fim, vale ressaltar que parte da análise pode ser realizada automaticamente em um processo rápido, preciso e com baixo custo de material.
is concerned with measuring the coverage in a specific point. Both concepts will be detailed in the next section. Therefore, it is important to distinguish between the two types of techniques that evaluate the integrity of the canopy structure, which are the focus of this work: (1) the technique that measures the canopy closure, defined as the hemispheric portion of the sky covered by the canopy (Leblanc and Fournier, 2017), and (2) the technique that measures the canopy cover defined as the portion of the forest floor covered by the vertical projection of tree canopies (Jennings et al., 1999; Korhonen et al., 2006; Paletto and Tosi, 2009).
There is a substantial number of papers analyzing forest canopies. Among them, those that inspired some of the decisions made during the conduction of this work are: the measurement of the size of the canopy openness, using digital images (Yamamoto, 2000); the use of the sum of the areas of triangles (Lima, 2005b); the estimation of the canopy cover by the sum of the projections of the canopy (Durigan et al., 2000); the estimation of the canopy closure using hemispheric lens (Meira Neto et al., 2005; Nascimento et al., 2007; Suganuma et al., 2008); and the evaluation of the canopy structure using images of the canopy cover (Jennings et al., 1999; Korhonen et al., 2006; Paletto and Tosi, 2009; Goodenough and Goodenough, 2012).
The canopy structure of a forest can be defined by the distribution of tree species at different heights (vertical profile) which, depending on their integrity (characteristic of not missing any of its parts), will reflect in a canopy structure with high coverage (greater canopy integrity), or low coverage with higher incidence of solar radiation reaching the ground (lower canopy integrity).
The work described in this paper aimed at identifying the canopy digital image-based technique more suitable to evaluate the integrity of the canopy, considering several issues, such as cost, accuracy and practicality.
2. MATERIAL E METHODS
The digital images of the canopy were captured with a Nikon D7000 camera with a NIKKOR 18-105 mm f/3.5-5.6G ED VR AF DX Lens and a hemispherical converter lens (0.21 ´ Digital King Fish Eye Lens Optics Japan). Two software were used to process the digital images namely, the MATrix LABoratory (MATLAB) and the Gap Light Analyzer (GLA) (Frazer et al., 1999).
The camera parameters were configured with: spatial resolution of 4,928 ´ 3,264 pixels i.e., high resolution thus avoiding a large number of mixed pixels (Macfarlane, 2011; Song et al., 2014); 300 dpi; RGB representation; adjusted focus to infinite; shutter speed and shutter automatically set, as well as ISO set to 6,400.
The area chosen to capture the digital images of the canopy was a 112 hectares semideciduous forest fragment, located at Canchim Farm at Empresa Brasileira de Pesquisa Agropecuária (EMBRAPA), in São Carlos, São Paulo, Brazil. This fragment has been preserved for more than 70 years (Primavesi et al., 1999). For the experiments, the images were captured in loco, along two transects: T1 (located in a conserved area) with higher canopy integrity and T2 (located in an area with natural disturbance) with lower canopy integrity. The characterization of both transects (T1 and T2) was conducted based on the work of Silva and Soares (2002). The digital images of the canopy were captured along each transect T1 and T2, with a difference of 10 meters between each capture. The procedure followed the proposal defined by Jennings et al. (1999). The images were taken on the October 9th, 2011, in the morning,
with a vertical adjustment of the camera, at the height of 1.5 meters from the ground (a tripod was used to stabilize and elevate the camera). A total of 44 digital images of the canopy were captured: 22 in transect T1 (11 images of the canopy cover and 11 images of the canopy closure) and 22 in transect T2 (11 images of the canopy cover and 11 images of the canopy closure). The methodology involved in the processing of the digital images are described next, beginning with the images of the canopy cover, followed by the images of the canopy closure. The 22 images of the canopy cover were imported into the MATLAB platform and then, each was divided into nine equal parts, all of them with the same dimensions (1,643 x 1,089 pixels). Figure 1a shows an example.
et al. (1999), the angles are considered vertical when the slope is less than 3 degrees.
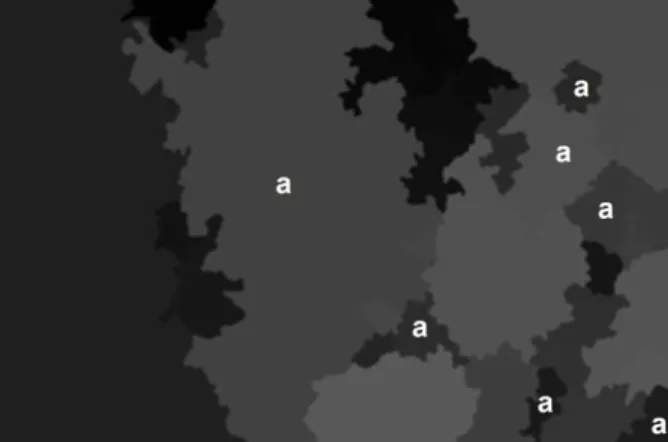
Next, the segmentation process of the 22 CPIs was carried out. The segmentation process of an image subdivides the image into objects of interest, where the levels of subdivision depend on the problem to be studied (Gonzalez et al., 2004). Thus, the segmentation process of an image must stop when the objects of interest are isolated, which can be characterized as being a set of similar pixels grouped with a same label. The labeled regions (map image) in this work were labeled as sky or canopy (Figure 2).
In the work four segmentation algorithms were used: (1) Thresholding (Thr); (2) Jseg; (3) Watershed Transform Distance Transform (WTDT) and Watershed Transform Gradients (WTG) (Deng and Manjunath, 2001; Gonzalez et al., 2004; Cavani et al., 2006).
The Thresholding algorithm determines one or more thresholds among all the gray level values of an image, in order to separate the objects of interest from others. In this work, the Otsu method, that automatically determines a threshold by minimizing the intraclass variance between pixels, was used.
The Jseg algorithm, created in 1999 by Deng and Manjunath (2001), uses the color and texture characteristics of an image to group similar regions. This algorithm is usually used for processing nature scenes (Deng and Manjunath, 2001; Cavani et al., 2006; Wang et al., 2007).
The Watershed Transform algorithm finds the basin divider in a monochromatic image, that is, the image is analogous to a topographic surface whose ash levels would be the altimetric dimensions (Dougherty and
Lotufo, 2003; Gonzalez et al., 2004). This algorithm can use the Euclidean distance between pixels to group similar regions (WTDT), or then use the magnitude of the gradients (WTG) obtained by a preprocessing, where the high values of the pixels are the edges (Dougherty, 1992; Dougherty and Lotufo, 2003; Gonzalez et al., 2004).
In order to capture the images of the canopy closure, the same camera with the same parameters previously discussed for the canopy cover images was used; however, in this case, a hemispherical converter lens was coupled to the main lens, which provided a 180 degree vision angle. The 22 images of the canopy closure were imported and processed using the GLA software, which required the setting of the following parameters: magnetic north, color plane and threshold value.
In both techniques, canopy cover and canopy closure, to measure the integrity of the canopy structure, the dark areas of the images (pixels representing any part of the vegetation, such as leaves, branches, stems, etc.) were used. The digital images of the canopy had a radiometric resolution of 8 bits, that is, a variation from 0 to 255 levels.
For comparison purposes, the average (AVG) and the standard deviation (STD) metrics were used for both, the canopy cover values and the canopy closure values, for transects T1 (conserved area with higher
Figure 2 – Example of labeled regions (image map), separating sky (marked with the letter a) and canopy (the remaining area).
Figura 2 – Exemplo de regiões rotuladas (imagem mapa), separando céu (marcada com a letra a) e dossel (áreas restantes).
Figure 1 – Example of canopy cover image. (a) a canopy cover image divided in nine equal parts; (b) an enlargement of the central part (referred to as CPI) of image (a).
Figura 1 – Exemplo de imagem da cobertura do dossel. (a)
canopy integrity) and T2 (area with natural disturbance, with lower canopy integrity).
3. RESULTS
The results obtained using the two above mentioned techniques show that both were able to differentiate between the T1 transect (conserved area, with higher canopy integrity) and the T2 transect (area with natural disturbance, with lower canopy integrity). However, the rates of variation between the canopy cover results and the canopy closure were different. Figure 3 illustrates the technical aspects involved in the angle of view (AOV) of the canopy cover images (plane images) and the canopy closure (hemispheric images) that led to the differences.
As can be seen in Table 1 (transect T1), in relation to the canopy cover images, the segmentation algorithms present different values for the same image (CPI). In particular, the results produced by Thr and WTDT agreed (sometimes with a slight difference) in all the 11 PCIs. Regarding the Jseg and the WTG, the same was observed, except for the CPI I1,9.
Considering the four methods of segmentation used for the canopy cover images, the values obtained for the AVGs were higher than 82%, and the AVG obtained for the images of the canopy closure was 79.41%.
Still analyzing the values in Table 1, it can be seen that the values of images I1,6, I1,9, I1,11 and I’1,6, I’1,8,
I’1,11 (for both, canopy cover and canopy closure) are
small values in relation to the values obtained with the other images. In addition, the STD value obtained for the canopy cover was around 11.00 and for the
canopy closure was 4.74 indicating a small variation in the percentage values of the canopy cover.
As can be seen in Table 2 (transect T2), in relation to the images of the canopy cover, that segmentation algorithms obtained different values for the same image (with the T1 transect). Similarly to T1, the results produced by Thr and WTDT agreed (sometimes with a slight difference) in all 11 CPIs. In relation to Jseg and WTG the same applies, except for the CPIs of images I2,3,
I2,6 and I2,8.
It is important to mention that the results of the segmentation performed by the Jseg algorithm, for both, the T1 transect and the T2 transect, were the ones that best represented the canopy integrity, since the Jseg algorithm was the one that best identified pixels representing the sky and pixels representing the cover. The analysis was conducted by comparing real images (RGB) with the images classified by the segmentation algorithms. It is also worth noting that the result of the Jseg algorithm for CPI I2,6 (Table 2) was zero, as it should be, considering the image represented the sky.
4. DISCUSSION
The analysis of the canopy cover in tropical forests is a very important subject for studies that aim at the investigation of the forest structure (Barnes et al., 1998). In the canopy cover images the distinction between clear areas (pixels representing the sky) and dark areas (pixels representing the canopy) is a challenge considering the difficulties involved in discriminating between pixels that represent each of them. In addition,
Source: Figure based on Korhonen et al. (2006). Fonte: Figura fundamentada em Korhonen et al. (2006).
Figure 3 – Differences between the two techniques that measure the canopy integrity: (a) canopy cover image; (b) canopy closure image.
the difference between an image of the canopy cover and an image of the canopy closure depends on the angle of view (AOV) of the lens, which may overestimate the canopy cover (Chianucci, 2016).
Jennings et al. (1999) present a review of the techniques used to measure the canopy where two main basic types of measurements are considered: canopy cover and canopy closure, and conclude that it is not possible to prescribe a method that is better.
This is a controversial topic in the literature, as pointed out by Jennings et al. (1999), considering that different authors support different methods, taking into account different criteria. However, it is a consensus among them that the higher the AOV, the greater the distortion effect on the captured image, as can be seen in the works by Paletto and Tosi (2009) and Suganuma et al. (2008), where both methods were used to analyze the forest canopy.
In this work the images of the canopy closure suffered many distortions due to the height of the trees and, also, due to the 180 degree AOV of the hemispherical lens, that is, parts of the trees, such as boles, were overestimated, increasing the values of the canopy closure. Thus, when analyzing the mean values of the canopy closure obtained for T1 (conserved area) and T2 (area with natural disturbance) transects, it was noticed that they are very close,
which can be considered an evidence that the canopy closure measurement technique was unable to detect changes in canopy integrity; on the other hand, the images of the canopy cover were processed only using the CPI, which made the AOV = 0° and consequently, reduced distortions, thus obtaining more realistic values in relation to the vertical projection proposed by Brokaw (1982).
Regarding the four techniques of segmentation, the differences in results are related to a difference of illumination in parts of the canopy, which somehow introduced a bias in the process. This occurred due to the angle of incidence of morning solar radiation (which was the capture period of digital canopy images). As a result, parts of the canopy cover were erroneously considered to be canopy openness (sky). Thus, future work could use other computational techniques to deal with this problem by improving the distinction between sky and canopy, in the canopy cover images.
Distinctly from Korhonen and Heikkinen (2009), who used the Thresholding combined with morphological operations of erosion and dilation, and Goodenough and Goodenough (2012), who also used the Thresholding, to separate the canopy sky in canopy cover images, the work described in this paper found that the Jseg algorithm applied to canopy cover images was the most
Transect T1 – Canopy Digital Images
IMG Canopy Cover IMG Canopy Closure
Thr (%) Jseg (%) WTDT (%) WTG (%) GLA (%)
I1,1 93 98 94 98 I’1,1 83.70
I1,2 92 97 92 97 I’1,2 83.72
I1,3 89 99 89 97 I’1,3 81.57
I1,4 87 95 88 91 I’1,4 79.54
I1,5 99 100 99 99 I’1,5 83.44
I1,6 68 68 69 72 I’1,6 72.65
I1,7 80 95 81 94 I’1,7 79.06
I1,8 93 99 93 98 I’1,8 83.34
I1,9 55 81 59 75 I’1,9 67.66
I1,10 88 98 88 96 I’1,10 82.01
I1,11 68 80 69 81 I’1,11 76.91
AVG 82.90 91.81 83.72 90.72 79.41
STD 12.99 10.57 12.09 9.45 4.74
Table 1 –Percentage values of canopy cover obtained with the segmentation techniques Thr, Jseg, WTDT and WTG. Percentage values of canopy closure obtained with GLA. IMG = image, AVG = average, STD = standard deviation. The values for the canopy cover were obtained using the central part of the image (CPI) of IMG.
efficient in differentiating the canopy sky, followed by the Thresholding, Watershed Transform Distance Transform and Watershed Transform Gradients, respectively.
5. CONCLUSION
Unlike traditional approaches usually adopted by experts, based on techniques to infer the integrity of tropical forest canopy, this work concludes that the use of the central parts of the canopy cover images combined with the use of digital image processing tools, for the analysis of the canopy integrity, is more efficient.
Among the segmentation algorithms for digital processing of canopy cover images used in this work, the Jseg algorithm was the best classifier for semideciduous forest.
The evaluation of canopy integrity with the use of cover images has shown to be a fast, precise and practical technique, helping to reduce time and material cost related issues.
6. ACKNOWLEDGMENTS
The authors thank the CAPES (Coordenação de Aperfeiçoamento de Pessoal de Nível Superior) for
the financial support to this research and the EMBRAPA (Empresa Brasileira de Pesquisa Agropecuária) for authorizing the first author to have access to the forest fragment.
7. REFERENCES
Armelin RS, Mantovani W. Definições de clareira natural e suas implicações no estudo da dinâmica sucessional em florestas. Rodriguésia.
2001;81(52):5-15.
Avery TE, Burkhart HE. Forest measurements. 4a.
ed. New York: McGraw-Hill; 1994.
Barnes B, Zak D, Denton S, Spurr S. Forest ecology. 4a. ed. New York: John Wiley & Sons;
1998.
Brokaw NVL. Treefalls: frequency, time, and consequences. In: Leight EG. The ecology of a tropical forest: Seasonal Rythms and Long-Term Changes Washington, DC: Smith Institution Press; 1982. p.101-8.
Brown N, Jennings S, Wheeler P, Nabe-Nielsen J. An improved method for the rapid assessment of forest understorey light environments. Journal of Applied Ecology. 2000;37(6):1044-53.
Table 2 – Percentage values of canopy cover obtained with the segmentation techniques Thr, Jseg, WTDT and WTG. Percentage values of canopy closure obtained with GLA. IMG = image, AVG = average, STD = standard deviation. The values for the canopy cover were obtained using the central part of the image (CPI) of IMG.
Tabela 2 – Valores de porcentagem da cobertura do dossel obtidos com as técnicas de segmentação Thr, Jseg, WTDT e WTD. Valores de porcentagem da oclusão do dossel obtidos com GLA. IMG = imagem, AVG = média, STD = desvio padrão. Os valores da cobertura do dossel foram obtidos utilizando a parte central da imagem (CPI) da IMG.
Transect T2 - Canopy Digital Images
IMG Canopy Cover IMG Canopy Closure
Thr (%) Jseg (%) WTDT (%) WTG (%) GLA (%)
I2,1 71 72 72 78 I’2,1 81.56
I2,2 98 100 98 99 I’2,2 85.80
I2,3 4 9 5 21 I’2,3 47.84
I2,4 92 95 93 94 I’2,4 88.67
I2,5 66 64 67 67 I’2,5 75.00
I2,6 59 0 64 19 I’2,6 32.95
I2,7 67 79 69 74 I’2,7 79.12
I2,8 21 28 26 40 I’2,8 55.55
I2,9 80 99 81 99 I’2,9 70.93
I2,10 91 94 92 95 I’2,10 84.93
I2,11 89 97 89 96 I’2,11 80.43
AVG 67.09 67 68.72 71.09 71.16
Calegari L, Martins SV, Gleriani JM, Silva E, Busato LC. Análise da dinâmica de fragmentos florestais no município de Carandaí, MG, para fins de restauração florestal. Revista Árvore.
2010;34(5):871-80.
Cavani FA, Sousa RV, Porto AJV, Tronco ML. Segmentação e classificação de imagens de laranjeiras utilizando Jseg e perceptron multicamadas. Minerva. 2006;3(2):189-97.
Chazdon R. Regeneração de florestas tropicais. Boletim do Museu Paraense Emílio Goeldi. Ciências Naturais. 2012;7(3):195-218.
Chianucci F. A note on estimating canopy cover from digital cover and hemispherical photography. Silva Fennica. 2016;50(1):1-10.
Deng Y, Manjunath BS. Unsupervised
segmentation of color-texture regions in images and video. IEEE Transactions on Pattern Analysis and Machine Intelligence. 2001;23(8):800-10.
Denslow JS, Hartshorn GS. Treefall gap environments and forest dynamic process. In: Mcdade LA. Ecology and natural history of a neotropical rain forest. Chicago: The University of Chicago Press; 1994. p.120-8.
Dougherty ER. Mathematical morphology in image processing. Boca Raton: CRC Press; 1992. 552p.
Dougherty ER, Lotufo RA. Hands-on
morphological image processing. Bellingham: SPIE Press; 2003. 272p.
Durigan G, Franco GADC, Saito M, Baitello JB. Estrutura e diversidade do componente arbóreo da floresta na Estação Ecológica dos Caetetus, Gália, SP. Brazilian Journal of Botany.
2000;23(4):371-83.
Frazer GW, Canham CD, Lertzman KP. Gap Light Analyzer – GLA, version 2.0. Burnaby, British Columbia: Simon Fraser University; 1999. 40p.
Gonzalez RC, Woods R, Eddins S. Digital image processing using MATLAB. Upper Saddle River, New Jersey: Prentice Hall; 2004.
Goodenough AE, Goodenough AS. Development of a rapid and precise method of digital Image Analysis
to Quantify Canopy Density and Structural Complexity. ISRN Ecology. 2012;2012:1-11.
Jennings SB, Brown NB, Sheil D. Assessing forest canopies and understorey illumination: canopy closure, canopy cover and other measures. Forestry. 1999;72(1):59-74.
Korhonen L, Korhonen KT, Rautiainen M, Stenberg P. Estimation of forest canopy cover: a comparison of field measurement techniques. Silva Fennica. 2006;40(4):577-88.
Korhonen L, Heikkinen J. Automated analysis of in situ canopy images for the estimation of forest canopy cover. Journal of Forest Science.
2009;55(4):323-34.
Leblanc SG, Fournier RA. Measurement of forest structure with hemispherical photography. In: Fournier RA, Hall RJ. Hemispherical photography in forest science: theory, methods, applications. Dordrecht: 2017. p.53-84.
Lima RAF. Estrutura e regeneração de clareiras em florestas pluviais tropicais. Revista Brasileira de Botânica. 2005a;28(4):651-70.
Lima RAF. Gap size measurement: the proposal of a new field method. Forest Ecology and
Management. 2005b;214(1-3):413-9.
Macfarlane C. Classification method of mixed pixels does not affect canopy metrics from digital images of forest overstorey. Agricultural and Forest Meteorology. 2011;151(7):833-40.
Meira Neto JAA, Martins FR, Souza AL.
Influência da cobertura e do solo na composição florística do sub-bosque em uma floresta
estacional semidecidual em Viçosa, MG, Brasil. Acta Botanica Brasilica. 2005;19(3):473-86.
Nascimento ART, Fagg JMF, Fagg CW. Canopy openness and lai estimates in two seasonally deciduous forests on limestone outcrops in Central Brazil using hemispherical photographs. Revista Árvore. 2007;31:167-76.
Parendes LA, Jones JA. Role of light availability and dispersal in exotic plant invasion along roads and streams in the H.J. Andrews Experimental Forest, Oregon. Conservation Biology. 2000;14:64-75.
Primavesi O, Primavesi ACPA, Pedroso AF, Camargo AC, Rassini JB, Filho JR, Oliveira GP et al. Microbacia hidrográfica do ribeirão Canchim: um modelo real de laboratório ambiental.. Brasília, DF: Ministério da Agricultura e do Abastecimento; 1999. (Boletim de Pesquisa)
Pesquisa FAPESP. São Paulo mais verde, Mapa da cobertura vegetal nativa paulista período 2008 -2009. 2012. [acesso em: 01 jul. 2016] Disponível em: http://revistapesquisa.fapesp.br/wp-content/ uploads/2012/08/mapa.pdf.
Silva LÁ, Soares JJ. Análise sobre o estado sucessional de um fragmento florestal e sobre suas populações. Revista Árvore. 2002;26:229-36.
Song GZM, Doley D, Yates D, Chao KJ, Hsieh CF. Improving accuracy of canopy hemispherical photography by a constant threshold valued derived from an unobscured overcast sky. Canadian Journal of Forest Research.
2014;44(1):17-27.
Suganuma MS, Torezan JMD, Cavalheiro AL, Vanzela ALL, Benato T. Comparando metodologias para avaliar a cobertura do dossel e a
luminosidade no sub-bosque de um
reflorestamento e de uma floresta madura. Revista Árvore. 2008;32:377-85.
Tabarelli M, Mantovani W. Colonização de clareiras naturais na floresta atlântica no Sudeste do Brasil. Revista Brasileira de Botânica.
1997;20:57-66.
Viana VM. Biologia e manejo de fragmentos florestais. In: Anais do 6º Congresso Florestal Brasileiro. São Paulo: Campos do Jordão SBS/ SBEF; 1990. p.113-8.
Wang Z, Boesch R, Ginzler C. Color and LIDAR data fusion: application to automatic forest boundary delineation in aerial images [CD ROOM]. International Archives of the Photogrammetry, Remote Sensing and Spatial Information Sciences 2007;36:1/W51.