Structural, optical and electrical properties of Ni-doped Co
3O
4prepared via
Sol-Gel technique
Abdelhak Lakehala,b*, Benrabah Bedhiafa, Amar Bouazaa, Hadj Benhebala, Abdelkader Ammaria,c,
Cherifa Dalached
Received: June 03, 2017; Revised: December 13, 2017; Accepted: January 18, 2018
In this article, Nickel doped Cobalt oxide thin films and powders have been prepared on glass substrates using sol gel based dip coating process in order to investigate their optical, structural and electrical properties. The Ni concentration was changed from 0 to 9 wt(%).The synthesized samples were characterised by Ultraviolete visible analysis, X-ray diffraction, Fourier transform infrared
spectroscopy and Complex impedance spectroscopy to depict the optical, structural, vibrational and
electrical properties. Our structural results show that the obtained samples were composed of (Co3O4)
polycrystalline with spinel-type preferentially oriented in the (311) plane. Our optical results show that the films have high transparency over the visible region (85% for Co3O4 and ~ 60-75% for all doped
samples). The optical band gaps were found to be (Eg1 = 1.50 eV, Eg2 = 2.20 eV) and (Eg1 = 1.42 eV,
Eg2 = 2.07 eV) for the case of (pure Co3O4 and 9% Ni-doped Co3O4) respectively. The complementary
phase information is provided by FT-IR spectroscopy. FT-IR spectra confirms the presence of Co2+-O and Co3+-O vibrations in the spinel lattice. The Nyquist plots suggests that the equivalent circuit of
our films is an parallel circuit RpCp. It was found that the resistance Rp decreases whereas the capacity Cp increases with increasing doping levels.
Keywords: Cobalt oxide, Ni-doping, Sol-gel dip coating, Thin films.
*e-mail: [email protected]
1. Introduction
In the last decade, transparent conductive oxides (TCO) have gained considerable interest in the research community due to their intriguing properties, they combine electrical conductivity and optical transparency in the visible range. These properties have attracted the attention for using them
in optoelectronic devices such as photovoltaic solar cells, electrochromic sensor1,2.
Among the transparent conductive oxides (TCO), cobalt oxide (Co3O4) is one of the most studied oxides due to its
importance for various scientific fields1 such as supercapacitors3, solar selective absorber4, and energy storage owing to its electrochemical stability1, large surface area4, and high
conductivity. It is also characterized by good resistance to thermal shocks, oxidation, UV radiation, humidity and
corrosion. Co3O4 exhibits p-type semiconducting property
and behaves like an antiferromagnet (AF) with the Néel
temperature TN ≈ 290 K5, Optical studies have shown that
Co3O4 exhibits multiple direct band gap energies (Eg1 = 1.48
eV, Eg2 = 2.24 eV)6. It has three well-known valence states, the
cobaltous oxide (CoO), the cobaltic oxide (Co2O3), and the
cobalt cobaltite (Co3O4)
7. The most stable phase in the cobalt oxide system is a mixed valence compound [Co2+Co3+
2O4]
with a normal spinel structure3.
In recent years, several efforts have been devoted to fabricating nanostructured systems of cobalt oxide with tunable physical-chemical properties for broad range of applications, among which transition metal doping is a promising and efficient route to improve the optical absorption and the electrical behavior of Co3O4. In this regard, this
study fabricates Ni-doped Co3O4 thin films in an effort to understand their enhanced optical and electrical properties.
In our work, we choose doping by nickel because its atomic radius is almost equal to that of cobalt. A small change in doping concentration is significant for changing the band gaps, the energy band gaps are expected to vary in a wide and very attractive energies intervals.
Various routes of synthesis of Co3O4 films have been undertaken such as chemical vapor deposition8, spray pyrolysis9, sol-gel method8,10,11, metal organic chemical vapor
deposition (MOCVD)12. In this paper we have adopted a
simple sol gel dip-coating method, this method of preparing aLaboratory of Physical Engineering, Ibn-Khaldoun University, Zaaroura, 14000, Tiaret, Algeria
bSynthesis and Catalysis Laboratory, Ibn-Khaldoun University, Zaaroura, 14000, Tiaret, Algeria
cLaboratory of Storage and Valorization of Renewable Energy, USTHB, el Alia 16111
Babezzouar Algiers, Algeria
thin films has several advantages: its low cost, flexibility in the deposition process, and it is convenient for a large area and it can produce homogeneous thin films with very regular crystallites sizes13-15. It has been used successfully
in our laboratory to fabricate a variety of porous materials
such as SnO29, TiO216.
2. Experimental Details
2.1. Films and Powders preparation
In the present venture, a sol gel dip-coating setup operating at atmospheric pressure was used to deposit Ni-doped cobalt oxide thin films on glass substrates. To prepare 0.1 M solution of pure Co3O4, hexahydrate nitrate cobalt
(Co(NO3)2.6H2O) was dissolved in an aqueous solution of
citric acid (C6H8O7 total solutions volume was 30 ml) (citric
acid can also act as an effective chelating agent to produce fine particles) and the resulting solution was stirred and heated at 80°C for 2 hours in order to obtain the burgundy homogeneous solution which is further converted into thick gel. The stoichiometric equilibrium reaction between
the cobalt nitrate and citric acide used in this study,can be
described by the following equation:
To achieve Ni-doping , nickel nitrate was added
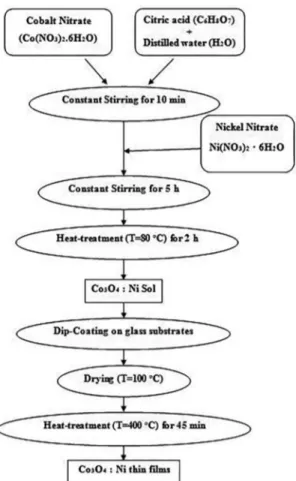
to the precursor solution with different concentrations (3 wt%, 5 wt%, 7 wt% and 9 wt%) for all doped samples. This mixture was equally stirred and heated at 80 °C for 2 hours to obtain viscous solution. The obtained viscous gel was calcined in muffle furnace at 400°C for 3 hours in a static air atmosphere to obtain Ni-doped Co3O4 powders. A schematic
representation of the sol gel synthesis is given in Fig.1.
2.2. Film deposition
The procedure of cleaning glass substrates is very important to get well adherent, smooth films. The substrates Pyrex pieces (75 x 25 x1mm3) were cleaned through dipping
them in ultrasonic bath containing trichloroethylene, ethanol, aciton for 5 minutes respectively, and finally rinsed by distilled water. The substrates were dipped in the solution, The withdrawal speed of the substrates from the solution was 5Cm/min. The optimized deposition conditions are listed in Table 1. After coating process was completed, the films were heated at 100°C for 2 hours in the ambient to evaporate the solvent and then annealed at 400°C during 45 minutes to remove organic residues and for densification. The obtained samples were subjected to microstructural,
optical and electrical analysis.
* *
Co NO H O C H O H O Co O N H O CO
27 6 14 9
27 232 84
Heat
3 2 2 6 8 7 2 3 4
2- 2 2
-+ +
+ +
Q V
Co Ni
! ! $$
G J Figure 1. Schematic diagram of sol-gel process of Ni-doped Co
3O4
preparation
Table 1. Optimized deposition parameters.
Dip coating parameters Optimized values
Concentration of precursor 0.1 M
Volume of precursor 30ml
Solvent 100% Citric acid
Relative humidity 40%
Substrate temperature 400 °C
Constant speed 5.0 Cm/min
2.3. Characterizations
The as-prepared samples were characterized by using different physical techniques. The optical transmittance spectra and band gap energies of Ni-doped Co3O4 thin films
were measured using Shimadzu-1650 spectrophotometer in the wavelength range from 300 to 900 nm. The phase and crystal structure of all samples were studied by X-ray diffraction (Rigaku miniflex 600) with CuKα radiation
the wavenumber range from 400 to 4000 cm-1. Impedance
measurements were carried out using Agilent4284A LCR-meter operating in the frequency range 75 KHz to 20 MHz with an oscillation amplitude of 1V.
3. Results and discussion
3.1. Optical analysis
In this part, the UV-Vis spectra of Ni-doped Co3O4
films were recorded in the wavelength range from 300 to 900 nm. Fig.2 shows the optical transmission spectra of Ni-doped Co3O4 thin films. All the obtained spectra manifest
the presence of two sharp absorption edges in the visible region, which are attributed to the ligand to metal charge transfer (LMCT) event of (O-2 →Co2+) and (O-2→Co3+) in Co3O4. This indicates the presence of two energy band gaps,
in agreement with the literature17.
Moreover, the electrical conduction of Co3O4 occurs by the
hopping of small polarons between two different valency states of the cobalt ions23. A Schematic representation of the
band structure of Pure Co3O4 is given in Fig.3. The variation
of absorption coefficient against photon energy hν for direct band-to-band transition has the form of:
(1)
Figure 2. Transmittance spectra of pure and Ni-doped Co3O4 films
Fig.2 shows a high transmittance in the range of visible light (T ~ 85% for pure Co3O4 and between 60% and 75%
is observed for all doped samples), attributed to a better structural homogeneity. It is well known that Co3O4, (i.e. Co
2+
[Co3+]
2O4) has a normal spinel crystal structure, knowing that the Co2+ ions occupy the tetrahedral sites, while Co3+ ions occupy the octahedral sites18. Since the p states of O2- ions are located closely to the d states of Co3+ ions, p
electrons can easily undergo a transition. At low temperatures this peak splits and results in a doublet corresponding to p(O2-)→e
g(Co3+) and p (O2-)→t2(Co
2+). The higher band
gap should be associated to the O2-→Co2+charge transfer
(valence to conduction band excitation) and the lower band gap associated to the O2-→Co3+charge transfer (with the Co3+ level located below the conduction band)19-21. Jacques Pankove. I22 suggest that the multiple band gap energy for the Co3O4 thin films may be due to the valence band degeneracy.
Figure 3. Schematic representation of the band structure of Co3O4
h
A h
E
gx
y
y
a
=
-Q
V
Q
V
ln d T 1 1 a=
T G JY
where α is the absorption coefficient , hν
is the photon energy, Eg the band gap energy and A the edge
parameter. The value of x is 2 for indirect allowed transitions
and ½ for direct allowed transitions24. Fig.4 shows the plots
of (αhυ)2vs (hυ). The extrapolation of a straight portion to
the energy axis at α = 0 can give two values of band gap
Eg1 = 1.50eV corresponds (O-2→Co3+) and E
g2 = 2.20eV
corresponds (O-2 →Co2+). Louardi et al.24 have obtained the
same results. The refractive index is calculated by Ravindra
relation ship25:
(2)
The film thickness d has been calculated from UV-visible data using the following equation26:
(3)
Where, n is the refractive index at two adjacent maxima
or minima at wavelengths λ1 and λ2. Results obtained for
the direct band gap energy, films' thickness and refractive index of our films at different doping levels are reported in Table 2. In Fig.5, we show the variations of the band gap energies as a function of doping level.
.
.
n
=
4 084
-
0 68
Q V
E
gd
n
2
1 21 2
m
m
m m
=
Figure 4. Plot of (αhν)2 versus hν of pure and Ni-doped Co
3O4 films at different doping levels
Table 2. Band gap energy, thikness and refractive index of pure
and Ni-doped Co3O4 films.
Sample Eg1 (eV) Eg2 (eV) Thikness (nm) Refractive index
Pure Co3O4 1.50 2.20 256.01 2.588
Co3O4: Ni (3%) 1.47 2.14 301.90 2.628
Co3O4: Ni (5%) 1.46 2.12 313.28 2.642
Co3O4: Ni (7%) 1.44 2.10 244.93 2.656
Co3O4: Ni (9%) 1.42 2.07 251.48 2.676
Ni-doped Co3O4 at different doping levels show slight
decrease in the band gap compared to pure Co3O4 with
the increase of doping levels (the lower band gap energy shifted from1.50 for pure Co3O4 and to 1.42 eV for the 9wt%
Ni-doped Co3O4, the higher band gap energy shifted from
2.20 for pure Co3O4 and to 2.07 eV for the 9wt% Ni-doped Co3O4), This behavior may be due to the network distortions
caused by the introduction of nickel ions in the Co3O4 matrix
Figure 5. Variation of the optical gap of Ni-doped Co3O4 films at
different doping levels
within the band gap. On the other hand nickel contributes to the creation of holes and increases its role by the number of charge carriers (holes) which contribute to the conductivity knowing that Co3O4 is a P type semiconductor.
Refraction index increases from 2.588 (pure) to 2.676 (9%Ni). This can be explained by the crystallization and the densification of the material. J.A.K. Tareen et al.26 suggest
that the Ni atoms are located in the octahedral sites of the spinel lattice. Moreover at the microscopic level, the increase of n refers to the modification of the polarizability of the
ions and the local field in the material27,28.
3.2. Structural analysis
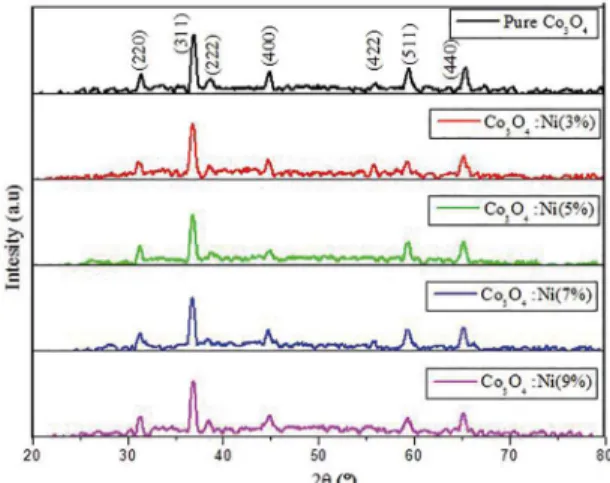
The structural characterization of the powders was analyzed using Rigakuminiflex 600 Xray diffractometer with CuKα radiation in the 2θ range of 20-80°. Fig.6 shows the X-ray diffraction (XRD) pattern of Ni-doped Co3O4
powders after calcination in muffle furnace at 400°C for 3 hours. All obtained powders show multiple diffraction peaks coincided well with the cubic spinel type structure (Fd3m
space group). The presence of reflection peaks associated to (220), (311), (222), (400), (422), (511) and (440) planes at 2θ = 31.27°, 36.88°, 38.62° 44.81°, 55.75°, 59.45°and 65.38° respectively, knowing that 〈311〉 as preferential orientation.
No parasitic phase of nickel clusters, nickel oxides (NiO) or Ni-Co, (NiCoO3) oxide phases has been observed in the detection limit of the apparatus, which indicate a high purity of the samples. These results have been previously confirmed by several authors20-29. The crystalline phase of
Ni-doped Co3O4 is identical to the Co3O4cubic spinel phase. When the Ni atoms introduced into the matrix it can either
"substitute" or "interstice" in the lattice. The lattice spacing was calculated from the Bragg's cubic system formula20:
(4)
d
h
k
l
a
hkl
=
2 2 2+
+
Q
Q
V
V
Figure 6. XRD patterns of pure and Ni-doped Co3O4 powders for
different Ni-doping amounts
The particle sizes of Ni-doped Co3O4 samples were
calculated using the full width at half maximum (FWHM) of (311) peak from the Debye-Scherrer formula30, knowing
that the width increases as the particle size decreases
(5)
Where D is the crystallite size, λ is the wavelength of the CuKα radiation (1.5406Å), β the full-width half maximum (FWHM) of Bragg peak observed at Bragg angle θ. It was found that the crystallite size of the samples was in the range of [214-279] Ǻ. The values of D and β obtained are given in Table 3.
3.3. Infrared Spectroscopy
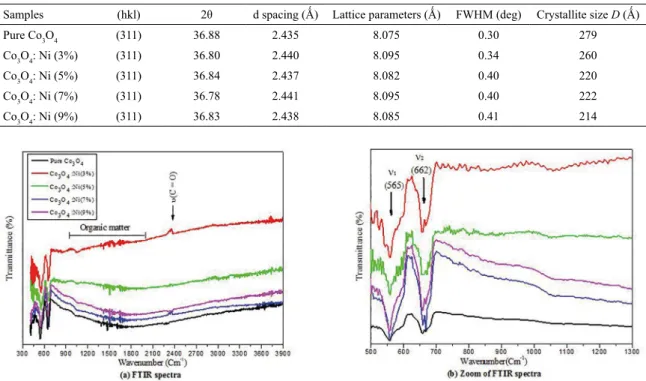
Fig.7, shows the FT-IR transmission spectra of Pure and Ni-doped Co3O4 films at different doping levels
(3wt%, 5wt%, 7wt% and 9wt%), deposited by dip coating technique on silicon substrates and annealed at 400°C. In the investigated region 400-4000 cm-1, all obtained spectra
have two absorption bands υ1, υ2 at 565 cm
-1 and 662 cm-1
assigned to the stretching vibration of metal-oxygen bond (Co-O or Ni-O) in Co3O4 spinel oxide with (Fd3m space
group), Gomaa A et al.23 have obtained the same results.
The absorption band υ1 at 565 cm
-1 is associated with the
OB3 vibrations in the spinel lattice where B denotes the Co3+ ions in an octahedral hole. The second band υ
2 (662 cm-1) is the ABO3 vibration, where A denotes Co2+ ions in
a tetrahedral hole. The absorption peak υ4 at (2350 cm
-1), is
assigned to the vibration of C=O bond31. The experimental
values of absorption bands have been collected from different
sources12,17,32. These observations are in good agreement with
the XRD results (Fig.6).
.
cos
Table 3. Structural parameters of pure and Ni-doped Co3O4 samples.
Samples (hkl) 2θ d spacing (Ǻ) Lattice parameters (Ǻ) FWHM (deg) Crystallite size D (Ǻ)
Pure Co3O4 (311) 36.88 2.435 8.075 0.30 279
Co3O4: Ni (3%) (311) 36.80 2.440 8.095 0.34 260
Co3O4: Ni (5%) (311) 36.84 2.437 8.082 0.40 220
Co3O4: Ni (7%) (311) 36.78 2.441 8.095 0.40 222
Co3O4: Ni (9%) (311) 36.83 2.438 8.085 0.41 214
Figure 7. FT-IR spectra of pure and Ni-doped Co3O4 films at different doping levels
3.4. Impedance spectroscopy
The measurement of the electrical properties of materials requires powerful tools to explore the electrical behavior, and that is through modeling them by an equivalent circuit33. In
this method we apply a sinusoidal disturbance of constant amplitude and a variable frequency to determine the conduction properties of a polycrystalline oxide and also, in theory, the different contributions to the conduction of a material (grains, grain boundaries, Pores, defects)16,30,34 It also characterizes
the different electrically active regions in the material and
demonstrates their existence by their individual electrical
properties. The electrical behavior of our films described in terms of one of the four complex expressions35, each consists
of real and imaginary component.
Complex impedance:
(6)
Complex admittance:
(7)
Complex permittivity:
(8)
Complex modulus:
(9)
These expressions are interrelated as:
(10)
Where RS and CS are the series resistance and capacitance;
RP and CP are the parallel resistance and capacitance, C0 is the empty capacitance, ω=2πυ, where υ is the applied frequency and j2=-1. Previous formalisms provide the opportunity to expand the scope to highlight a particular aspect of the electrical response of the sample. The idealized plot (Z'' versus Z') that describes the electrical behavior of a polycrystalline oxide has three components, each of these components corresponds to a particular relaxation frequency. At higher frequencies, the component corresponds to the bulk properties (νb). At
intermediate frequencies, the electrical behavior due to the grain boundaries (νgb) and at low frequencies the electrical response corresponds to electrode process (νel), or processes
occurring in the material/electrode interface (νel≪ νgb≪ νb) 36.
Several factors influence the electrical behavior of materials as chemical composition, impurities, ageing and conditions of preparation. The volume and grain boundary properties, chemical composition, impurities, ageing and preparation
conditions make the actual oxide system rather complicated.
The electrical characteristic of a material is shown by the appearance of semicircular arcs in the Nyquist plots. Fig.8 is the Nyquist representation of pure and Ni-doped Co3O4 thin
films, whose f frequency varies from 75 kHz to 20 MHz at
ambient temperature. The processes that occur in the electrode
are modeled by an equivalent electrical circuit. The physical logic of the system indicates that the concurrent processes
/
Z
*Z
jZ
R
j
C
s
~
s=
l
+
m
=
-Y
*Y
Y
R
1
j C
P
~
p=
l
-
m
=
+
j
*f
=
f
l
-
f
m
M
*M
M
=
l
+
m
M
*1
j C Z
j C
Y
1
*
*
*
0 0
f
~
~
are connected in parallel. The capacity Cp of the thin films
was calculated using the following equation:
(11)
C
P2
f R
1
P pr
=
Table 4. Values of fc, Rp and Cp of pure and Ni-doped Co3O4 films.
Samples fc (MHz) Rp (Ω) Cp (nF)
Pure Co3O4 13.40 25.68 462
Co3O4: Ni (3%) 13.29 24.27 493
Co3O4: Ni (5%) 13.07 22.84 533
Co3O4: Ni (7%) 12.85 21.93 564
Co3O4: Ni (9%) 12.51 19.56 650
Figure 8. Nyquist plots of pure and Ni-doped Co3O4 thin films at
different doping levels
The variation of the resistance and capacitance as a function of Ni doping level are listed in Table 4 and shown in Fig.9. It is clear that the resistance of cobalt oxide decreases and the capacity increases with the increase of doping level. This shift is also due to the introduction of nickel ions in
Co3O4 lattice which induces a variation in the particle size
and consequently introduce more grain boundaries within the samples. Two conduction mechanisms are simultaneously present, conduction across the grain and conduction through the grain boundaries. The effect of grain boundaries in samples becomes more dominant with respect to the contribution of the grains in the conduction mechanism.
Figure 9. Variation of capacity and resistance of pure and Ni-doped
Co3O4 as a function of Ni doping level
4. Conclusion
In conclusion, we have successfully synthesised Ni-doped cobalt oxide (Co3O4) thin films using a sol gel technique in
order to investigate their optical, structural and electrical properties. X-ray diffraction patterns revealed that Ni-doped
Co3O4 samples were crystallized in cubic spinel structure
knowing that the crystallite size was found to be from 214 to 279 Å. The as synthesis films, exhibit a high transmission
~ 60-85% in the visible region. Optical studies concluded that
Co3O4 has multiple band gap energies with direct transitions
2.20 eV (O2-→Co2+) and 1.50 eV (O2-→Co3+). The band gap
energies of our samples were determined by the Tauc plot. The values of the band gaps were found to decrease as the dopant concentration increases, it might be due to the formation of acceptor level within the band gap. The FT-IR spectra of pure and Ni-doped Co3O4 films revealed two distinct bands
that arise due to the stretching vibrations of the metal Co-O or Ni-O bonds in the investigated region. The FT-IR spectra were typical of a cubic spinel structure with space group
Fd-3m and served as a clear evidence for the presence of
cubic Co3O4 in agreement with X-ray diffraction results. The complex impedance spectroscopy indicates that the physical
concurrent processes of Ni-doped Co3O4 are connected in parallel RC. The conduction mechanism of all samples is
highly due to the grain boundaries.
5. References
1. Yao L, Xi Y, Xi G, Feng Y. Synthesis of cobalt ferrite with enhanced magnetostriction properties by the sol-gel-hydrothermal route using spent Li-ion battery. Journal of Alloys and Compounds. 2016;680:73-79. DOI: 10.1016/j.jallcom.2016.04.092
2. Razmi H, Habibi E. Amperometric detection of acetaminophen by an electrochemical sensor based on cobalt oxide nanoparticles in a flow injection system. Electrochimica Acta. 2010;55(28):8731-8737. DOI: 10.1016/j.electacta.2010.07.081
3. Shinde VR, Mahadik SB, Gujar TP, Lokhande CD. Supercapacitive cobalt oxide (Co3O4) thin films by spray pyrolysis. Applied
Surface Science. 2006;252(20):7487-7492. DOI: 10.1016/j.
apsusc.2005.09.004
4. Smith GB, Ignatiev A, Zajac G. Solar selective black cobalt: preparation, structure, and thermal stability. Journal of Applied
Physics. 1980;51(8):4186-4196. DOI: 10.1063/1.328276
5. Patil PS, Kadam LD, Lokhande CD. Preparation and characterization of spray pyrolysed cobalt oxide thin films. Thin Solid Films. 1996;272(1):29-32. DOI: 10.1016/0040-6090(95)06907-0 6. Gulino A, Dapporto P, Rossi P, Fragalà I. A Novel Self-Generating
Liquid MOCVD Precursor for Co3O4 Thin Films. Chemistry of
Materials. 2003;15(20):3748-3752. DOI: 10.1021/cm034305z
7. Young RS, ed. Cobalt: Its Chemistry, Metallurgy and Uses. New York: Reinhold Publishing Corp.; 1960.
9. Victoria SG, Raj AME, Ravidhas C. An insight in the structural, morphological, electrical and optical properties of spray pyrolysed Co3O4 thin films. Materials Chemistry and Physics.
2015;162:852-859. DOI: 10.1016/j.matchemphys.2015.07.015
10. Tang Q, Zhu H, Chen C, Wang Y, Zhu Z, Wu J, et al. Preparation and Characterization of Nanoscale Cobalt Blue Pigment for Ceramic Inkjet Printing by Sol-Gel Self-Propagating Combustion.
Materials Research. 2017;20(5):1340-1344. DOI:
10.1590/1980-5373-MR-2017-0322
11. Patil V, Joshi P, Chougule M, Sen S. Synthesis and Characterization of Co3O4 Thin Film. Soft Nanoscience Letters. 2011;2(1):1-7.
DOI: 10.4236/snl.2012.21001
12. Švegl F, Orel B, Grabec-Švegl I, Kaučič V. Characterization of spinel Co3O4 and Li-doped Co3O4 thin film electrocatalysts
prepared by the sol-gel route. Electrochimica Acta. 2000;45(25-26):4359-4371. DOI: 10.1016/S0013-4686(00)00543-0
13. Chatelon JP, Terrier C, Bernstein E, Berjoan R, Roger JA. Morphology of SnO2 thin films obtained by the sol-gel technique.
Thin Solid Films. 1994;247(2):162-168. DOI:
10.1016/0040-6090(94)90794-3
14. Zarbali M, Göktaş A, Mutlu IH, Kazan S, Şale AG, Mikailzade F. Structure and Magnetic Properties of La0.66Sr0.33MnO3 Thin Films
Derived Using Sol-Gel Technique. Journal of Superconductivity
and Novel Magnetism. 2012;25(8):2767-2770. DOI: 10.1007/
s10948-011-1260-z
15. Göktas A. Sol-gel derived Zn1-xFexS diluted magnetic semiconductor thin films: Compositional dependent room or above room temperature ferromagnetism. Applied Surface
Science. 2015;340:151-159. DOI: 10.1016/j.apsusc.2015.02.115
16. Kharoubi A, Bouaza A, Benrabah B, Ammari A, Khiali A. Characterization of Ni-doped TiO2 thin films deposited by
dip-coating technique. The European Physical Journal Applied
Physics. 2015;72(3):30301. DOI: 10.1051/epjap/2015150282
17. Kandalkar SG, Gunjakar JL, Lokhande CD, Joo OS. Synthesis of cobalt oxide interconnected flacks and nano-worms structures using low temperature chemical bath deposition. Journal of
Alloys and Compounds. 2009;478(1-2):594-598. DOI: 10.1016/j.
jallcom.2008.11.095
18. Thota S, Kumar A, Kumar J. Optical, electrical and magnetic properties of Co3O4 nanocrystallites obtained by thermal
decomposition of sol-gel derived oxalates. Materials Science
and Engineering: B. 2009;164(1):30-37. DOI: 10.1016/j.
mseb.2009.06.002
19. Pal J, Chauhan P. Study of physical properties of cobalt oxide (Co3O4) nanocrystals. Materials Characterization.
2010;61(5):575-579. DOI: 10.1016/j.matchar.2010.02.017
20. Jacobs JP, Maltha A, Reintjes JGH, Drimal J, Ponec V, Brongersma HH. The Surface of Catalytically Active Spinels. Journal of
Catalysis. 1994;147(1):294-300. DOI: 10.1006/jcat.1994.1140
21. Shelef M, Wheeler MAZ, Yao HC. Ion scattering spectra from spinel surfaces. Surface Science. 1975;47(2):697-703. DOI: 10.1016/0039-6028(75)90218-6
22. Pankove JI. Optical Processes in Semiconductors. Englewood Cliffs: Prentice-Hall; 1971.
23. Ali GAM, Fouad OA, Makhlouf SA. Structural, optical and electrical properties of sol-gel prepared mesoporous Co3O4/
SiO2 nanocomposites. Journal of Alloys and Compounds.
2013;579:606-611. DOI: 10.1016/j.jallcom.2013.07.095
24. Louardi A, Rmili A, Ouachtari F, Bouaoud A, Elidrissi B, Erguig H. Characterization of cobalt oxide thin films prepared by a facile spray pyrolysis technique using perfume atomizer.
Journal of Alloys and Compounds. 2011;509(37):9183-9189.
DOI: 10.1016/j.jallcom.2011.06.106
25. Ravindra NM. Energy gap-refractive index relation - some observations. Infrared Physics. 1981;21(5):283-285. DOI: 10.1016/0020-0891(81)90033-6
26. Tareen JAK, Malecki A, Doumerc JP, Launay JC, Dordor P, Pouchard M, et al. Growth and electrical properties of pure and Ni-doped Co3O4 single crystals. Materials Research Bulletin.
1984;19(8):989-997. DOI: 10.1016/0025-5408(84)90212-5
27. Goktas A, Aslan F, Tumbul A, Gunduz SH. Tuning of structural, optical and dielectric constants by various transition metal doping in ZnO:TM (TM=Mn, Co, Fe) nanostructured thin films: A comparative study. Ceramics International. 2016;43(1 Pt A):704-713. DOI: 10.1016/j.ceramint.2016.09.217
28. Goktas A, Mutlu IH. Structural, Optical, and Magnetic Properties of Solution-Processed Co-Doped ZnS Thin Films. Journal of
Electronic Materials. 2016;45(11):5709-5720. DOI: 10.1007/
s11664-016-4771-3
29. Santos GA, Santos CM, da Silva SW, Urquieta-González EA, Sartoratto PPC. Sol-gel synthesis of silica-cobalt composites by employing Co3O4 colloidal dispersions. Colloids and Surfaces
A: Physicochemical and Engineering Aspects.
2012;395:217-224. DOI: 10.1016/j.colsurfa.2011.12.033
30. Benrabah B, Bouaza A, Kadari A, Maaref MA. Impedance studies of Sb doped SnO2 thin film prepared by sol gel process.
Superlattices and Microstructures. 2011;50(6):591-600. DOI:
10.1016/j.spmi.2011.08.009
31. Ammari A, Bellal B, Zebbar N, Benrabah B, Trari M. Thermal-frequency dependence study of the sub-band localized states effect in Sb-doped SnO2 based sol-gel thin films. Thin Solid
Films. 2017;632:66-72. DOI: 10.1016/j.tsf.2017.02.060
32. Makhlouf MT, Abu-Zied BM, Mansoure TH. Direct Fabrication of Cobalt Oxide Nanoparticles Employing Sucrose as a Combustion Fuel. Journal of Nanoparticles. 2013;2013:384350. DOI: 10.1155/2013/384350
33. Barsoukov E, Macdonald JR, eds. Impedance Spectroscopy, Theory, Experiment, and Applications. 2nd ed. New York: John
Wiley & Sons; 2005.
34. Göktas A, Tumbul A, Aslan F. Grain size-induced structural, magnetic and magnetoresistance properties of Nd0.67Ca0.33MnO3
nanocrystalline thin films. Journal of Sol-Gel Science and
Technology. 2016;78(8):262-269. DOI: 10.1007/s10971-016-3960-0
35. McDevitt NT, Baun WL. Infrared absorption study of metal oxides in the low frequency region (700-240 cm-1). Spectrochimica
Acta. 1964;20(5):799-808. DOI: 10.1016/0371-1951(64)80079-5
36. Mechiakh R, Meriche F, Kremer R, Bensaha R, Boudine B, Boudrioua A. TiO2 thin films prepared by sol-gel method for