ABSTRACT The state of São Paulo has adopted a financial incentive program for philanthropic hospitals. The objective of this study was to analyze the performance of the hospitals partici-pating in this program in 2012. Performance indicators were analyzed according to hospital size and municipal size, using the Proadess performance model (Evaluation of Health System Performance). There was a difference in the performance of the hospitals according to the size: small hospitals presented unfavorable results in relation to the indicators of access, ef-ficiency and effectiveness. This result corroborates the need to reassess financial incentive programs for small hospitals configured as general hospitals.
KEYWORDS Hospital administration. Health services. Service indicators. Health manage-ment. Hospital services.
RESUMO O estado de São Paulo adotou um programa de incentivo financeiro para hospitais filantrópicos. O objetivo deste estudo foi analisar o desempenho dos hospitais participantes desse programa em 2012. Foram analisados os indicadores de desempenho segundo o porte hos-pitalar e o porte municipal, empregando-se o modelo de desempenho do Proadess (Avaliação de Desempenho do Sistema de Saúde). Encontrou-se diferença no desempenho dos hospitais segun-do porte: os hospitais de pequeno porte apresentaram resultasegun-dos desfavoráveis com relação aos indicadores de acesso, eficiência e efetividade. Esse resultado corrobora a necessidade de reaval-iar programas de incentivo financeiro para hospitais de pequeno porte configurados como hos-pitais gerais.
PALAVRAS-CHAVE Administração hospitalar. Serviços de saúde. Indicadores de serviços. Gestão em saúde. Serviços hospitalares.
Philanthropic hospitals benefited by
financial incentive program: a performance
analysis
Hospitais filantrópicos beneficiados por programa de incentivo
financeiro: uma análise de desempenho
Tanira Gomes de Toledo Barros1, Carla Gianna Luppi2
1 Secretaria de Estado da Saúde de São Paulo – São Paulo (SP), Brasil.
2 Universidade Federal de São Paulo (Unifesp), Escola Paulista de Medicina (EPM), Departamento de Medicina Preventiva – São Paulo (SP), Brasil.
Introduction
In the state of São Paulo, philanthropic hospi-tals and, in particular, Holy Houses of Mercy are responsible for an important portion of hos-pital care offered to the Unified Health System (SUS)1. In 2012, of the total number of hospitals
that provided care to SUS, more than 66% of the institutions were of a philanthropic nature, according to data from the National Registry of Health Establishments (CNES)2.
The increase of costs in hospital care (due to the demographic and epidemio-logical transitions), the technoepidemio-logical advance and the need to improve the quality of care provided by the Holy Houses and philanthropic hospitals led to the proposal of a program of finan-cial support to these institutions1. This
program was settled and approved by the Bipartite Interagency Commission (BIC) of the state of São Paulo, in 2007 and 2009, with the objective of financially support-ing philanthropic entities responsible for hospital health services of regional refer-ence of the SUS and improving regional organization and quality of hospital care. The number of participating hospitals was established according to the popula-tion size of each Health Region (HR): up to 80.000 inhabitants, one hospital; from 80.000 to 200.000 inhabitants, two hospi-tals; from 200.000 to 400.000 inhabitants, three hospitals; and more than 400.000 inhabitants, four hospitals, regardless of whether they are under state or mu-nicipal management3,4. The total value of
the incentive to be granted was also set based on the same population criteria: regions with up to 80 thousand inhabit-ants, R$30.000,00 monthly; regions with between 80 and 200 thousand inhabit-ants, R$100.000,00 monthly; regions with between 200 and 400 thousand inhabit-ants, R$200.000,00 monthly; and regions with more than 400 thousand inhabitants, R$450.000,00 per month3,4.
It was agreed that these Philanthropic Hospital Units (PHU) should present minimum criteria to be covered by this financial incen-tive: more than 30 hospital beds, demonstrate regional or micro-regional coverage and com-pliance with standards and procedures with surveillance instances, auditing and other. Hospitals that provided predominant care for chronic and psychiatric patients and those who only provided ambulatory care were excluded from the program. They were established as mandatory conditions for the inclusion of hos-pitals in the program the availability of 100% of the SUS beds to the competent regulatory body and other outpatient procedures defined and prioritized by the corresponding Regional Interagency Committee (RIC)3,4.
The financial values to be transferred would be shared among the managers: 70% of the state manager and 30% of the municipal managers. The selection of the PHU ben-eficiaries was delegated to the RIC, as well as the definition of the corresponding incentive values within the limit established by HR3.
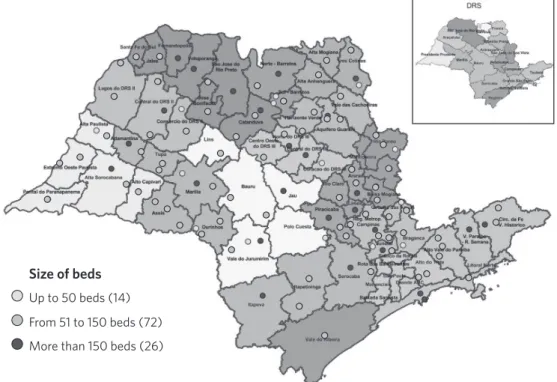
Figure 1 shows the distribution of selected hospitals, according to HR and the Regional Health Department (RHD), for 2012.
The description and analysis of the hos-pital performance indicators of these PHUs contemplated by the financial incentive would contribute to directing the reformu-lation of the adopted election criteria. It is, therefore, opportune to investigate the per-formance of these institutions, to recognize qualifying elements, and to promote adjust-ments to subsidize the formulation of new incentive policies.
The objective of this study was to analyze the performance of hospitals participating in the financial incentive program to philanthrop-ic hospitals in the state of São Paulo, in 2012.
Methods
A cross-sectional descriptive study with secondary data was performed. In 2012, the state of São Paulo was organized in 64 HR,
all of them with constituted RIC. All HR in-dicated philanthropic hospitals to participate in the financial assistance, except for the Metropolitan Region of São Paulo, where only one of the six RICs indicated a hospital unit.
The present study contemplated the de-scription of the indicators of all PHU includ-ed in the financial incentive program in 2012. The selected performance indicators and the variables of hospital size and municipal size were described. The hospital size vari-able was organized according to the stratum of number of beds by PHU, adopting to the composition of the strata the orientation in-dicated by the Ministry of Health (MH)5,6:
small size, less or equal to 50 beds; medium size, from 51 to 150 beds; and large size, with more than 150 beds (GM Ordinance nº 2.224, December 2002). The variable municipal size was organized according to the stratum of number of inhabitants per municipality: Figure 1. Spatial distribution of Philanthropic Hospital Units (PHU) of the financial incentive program by Health Region (HR) and by Regional Health Department (RHD), according to hospital size. State of São Paulo, 2012
Size of beds
Up to 50 beds (14)
From 51 to 150 beds (72)
More than 150 beds (26)
small size – less than 50.000 inhabitants; medium size – from 50.000 to less than 100.000 inhabitants; large size – 100.000 in-habitants or more.
The performance indicators described were selected according to the quality crite-ria established by McGlynn7: reliability,
fea-sibility, uses and limitations. The indicators were classified according to the sub-dimen-sions, adapted from the model proposed by the Performance Evaluation of the Brazilian Health System (Proadess)8. The
sub-dimen-sions adopted for analysis of the perfor-mance dimension were access, adequacy, effectiveness and efficiency. The indicators used were: access – number of outpatient
procedures per month, number of hospi-talizations and number of deliveries per month; efficiency – hospital occupancy rate, average length of stay, proportion between the value of the incentive program and the amount paid for SUS production; effective-ness – percentage of Hospitalizations for Conditions Sensitive to Basic Care (ICSAB); and adequacy – hospital mortality rate and cesarean rate (chart 1).
The main sources of data were: CNES9,
Outpatient Information System of SUS (SIA/ SUS)10, Hospital Information System of the
SUS (SIH/SUS)11. Demographic data were
obtained from the Brazilian Institute of Geography and Statistics (IBGE)12.
Dimension Indicator Method of calculation Data source Reliability/availability
Access
Number of out-patient proce-dures/month
Number of outpatient procedures (monthly average in 2012) per hospital unit
Ambulatory Information System (SIA/SUS)
Outpatient information is processed by SIA/ SUS, with the Consolidated Ambulatory Pro-duction Bulletin (BPA-C), the Individualized Ambulatory Production Bulletin (BPA-I) and the Authorization of High Complexity Procedures (Apac) as data sources. They include all consul-tations, follow-ups and individual consultations performed by doctors, including when per-formed in multi-professional care.
Access
Number of hospitalizations/ month
Number of hospital admissions (monthly average in 2012) per hospital unit
Hospital Information System
(SIH/SUS).
The information about hospitalization has as data sources the Hospitalization Authoriza-tions – AIH (SIH/SUS). This is, for most brazil-ian states and municipalities, the only source of hospitalization data. It includes only the paid hospitalizations, not all those that were effectively performed by the SUS, according to the limits defined in the physical and financial programming of the SUS. There is a possibility of underreporting of the number of hospitaliza-tions performed in public hospitals financed by direct transfer of resources, and not by produc-tion of services.
Access Number of births/month
Number of hospital deliveries SUS (month-ly average in 2012) per hospital unit
Effectiveness Percentage of Hospitalizations for Conditions Sensitive to Basic Care (ICSAB) Nº ICSAB
Total of hospitalizations. x 100
Adequação Hospital mortal-ity rate
Nº of Deaths (after 24hs hospitalization)
Nº of hospital exits.
x 100
Adequação Hospital mortal-ity rate
Nº of cesarean deliveries occured Total of deliveries
x 100
Eficiência Hospital Occu-pancy Rate
Nº of patients per day
Total of beds per day. x 100
Eficiência Average stay Nº of patients per day
In the analysis of the performance indica-tors, it was observed that the three access indicators (number of outpatient procedures per month, number of hospitalizations per month and number of deliveries per month) had a positive relation with the size of the PHU and the size of the municipality: the larger the indicator, the larger the hospital
size (table 2). This relation was maintained after a stratified analysis by municipalities (table 3): large size hospitals in large size municipalities presented a number of hospi-talizations per month 8.5 times greater, and a number of births per month 8.9 times higher.
The percentage of ICSAB, an indicator of effectiveness, was 1.7 times higher in PHU of Chart 1. (cont.)
The statistical measures used to describe the indicators were: median, 25h percentile (P25), 75th percentile (P75). The analysis of the indicators was performed according to hospital size and municipal size.
The data used in this study were obtained from the official information systems, avail-able for public access. Data on the institu-tions that make up this financial aid program were provided by the State Department of Health of São Paulo (SESSP)13, also with
public access.
Results
Of the total of 112 PHU, 13 (12%) were small size, 72 (64%) were medium size and 27 (24%) were large size (table 1). The indica-tors were analyzed by dimension according to hospital size and municipal size. It was observed that a small PHU was indicated by the RIC in a large municipality, and a large PHU, located in a small municipality. In the group of municipalities of medium size no small hospital was found benefited.
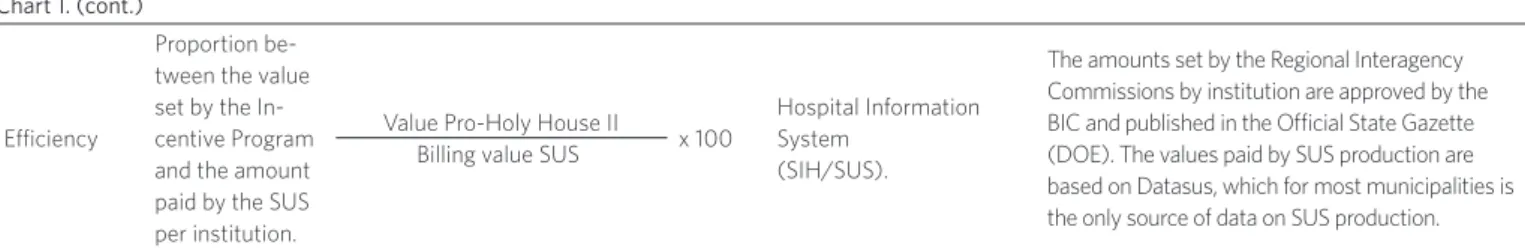
Efficiency
Proportion be-tween the value set by the In-centive Program and the amount paid by the SUS per institution.
Value Pro-Holy House II Billing value SUS x 100
Hospital Information System
(SIH/SUS).
The amounts set by the Regional Interagency Commissions by institution are approved by the BIC and published in the Official State Gazette (DOE). The values paid by SUS production are based on Datasus, which for most municipalities is the only source of data on SUS production.
Table 1. Distribution of hospitals of the incentive program according to number of beds, by municipal population size, state of São Paulo, 2012
Population Range Number of beds
≤ 50 % 51 to 150 % 150 %
< 10.000 1 7,69 0 0 0 0
10.000 a 20.000 9 69,23 5 6,94 0 0
20.000 a 50.000 2 15,38 26 36,11 1 3,70
50.000 a 100.000 0 0,00 24 33,33 5 18,52
> 100.000 1 7,69 17 23,61 21 77,78
Total 13 100,00 72 100,00 27 100,00
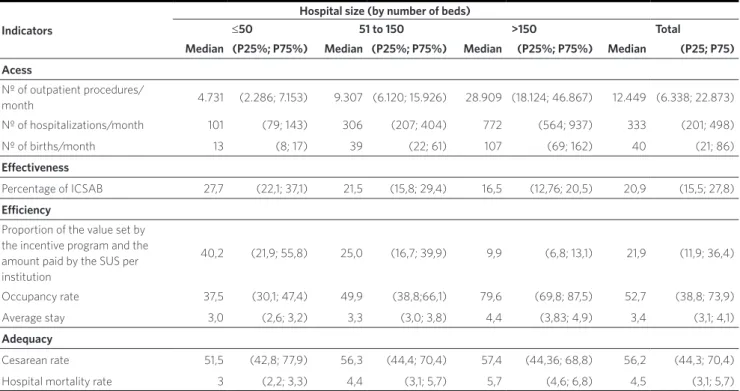
Table 2. Distribution of medians (25th percentile – P25 - and 75th percentile – P75 percentile) of performance indicators by hospital size of the hospitals of the incentive program. State of São Paulo, 2012
Indicators
Hospital size (by number of beds)
≤50 51 to 150 >150 Total
Median (P25%; P75%) Median (P25%; P75%) Median (P25%; P75%) Median (P25; P75)
Acess
Nº of outpatient procedures/
month 4.731 (2.286; 7.153) 9.307 (6.120; 15.926) 28.909 (18.124; 46.867) 12.449 (6.338; 22.873) Nº of hospitalizations/month 101 (79; 143) 306 (207; 404) 772 (564; 937) 333 (201; 498)
Nº of births/month 13 (8; 17) 39 (22; 61) 107 (69; 162) 40 (21; 86)
Effectiveness
Percentage of ICSAB 27,7 (22,1; 37,1) 21,5 (15,8; 29,4) 16,5 (12,76; 20,5) 20,9 (15,5; 27,8)
Efficiency
Proportion of the value set by the incentive program and the amount paid by the SUS per institution
40,2 (21,9; 55,8) 25,0 (16,7; 39,9) 9,9 (6,8; 13,1) 21,9 (11,9; 36,4)
Occupancy rate 37,5 (30,1; 47,4) 49,9 (38,8;66,1) 79,6 (69,8; 87,5) 52,7 (38,8; 73,9)
Average stay 3,0 (2,6; 3,2) 3,3 (3,0; 3,8) 4,4 (3,83; 4,9) 3,4 (3,1; 4,1)
Adequacy
Cesarean rate 51,5 (42,8; 77,9) 56,3 (44,4; 70,4) 57,4 (44,36; 68,8) 56,2 (44,3; 70,4)
Hospital mortality rate 3 (2,2; 3,3) 4,4 (3,1; 5,7) 5,7 (4,6; 6,8) 4,5 (3,1; 5,7)
small size (27.7%) than in large ones (16%). In the analysis stratified by municipality, these small PHUs in small municipalities presented a percentage 8 times greater of ICSAB in relation to large hospitals in large municipalities. In large municipalities, the performance of ICSAB has remained worse in small PHUs.
In the efficiency sub-dimension, the oc-cupancy rate was higher in PHU of large size (79.6%), and the performance of the small PHU was 2.1 times smaller. Regarding the averages of permanence, the differences ac-cording to the size were not as expressive: the larger PHU presented 1.5 times more average of permanence than the smaller ones, a result that was not modified by the analysis stratified by size of municipality. The median of the proportion of the benefit value in relation to the output approved by the SUS production of the hospital was four
times higher in small hospitals compared to large hospitals. It is noteworthy that in a quarter of small hospitals this figure was higher than 55%. After stratifying the analy-sis by size of municipalities, this difference remained, and it was observed that a small PHU located in a large municipality had a higher percentage – 57.4%.
Regarding adequacy indicators, the hospital mortality rate observed in the small and medium-sized group of hospi-tals increases by 2.5 times when these hos-pitals are located in larger municipalities. This same relation was not verified for the group of large hospitals. The median cesarean rate presented a smaller varia-tion in relavaria-tion to the hospital size, with a 51.5% increase in small size, to 57.5% in large size. It was possible to observe that the largest cesarean rate occurred in a large PHU in a small municipality (86.5%).
Discussion
The aim of this incentive program for phil-anthropic hospitals was to provide financial support to philanthropic entities that provid-ed health services, such as general hospitals, which constituted regional references, as well as to improve the territorial organization and quality of hospital care. The selection strategy of these hospitals that would be contemplated by the incentive was given by the indication of the RIC, with the use of election criteria agreed in BIC. The distribution according to the hospital size of the PHU contemplated by the financial incentive program showed that the indication prioritized the medium and large hospitals. However, approximately 12% were small PHUs. The PHUs of small hospital size presented an unfavorable performance, especially in the indicators of access, effec-tiveness and efficiency. In Brazil, and also in the state of São Paulo, studies have indicated worse performance evaluations among small hospitals1,2,14,15.
The observed performance of the access indicators was positively related to hospital and municipal transport, that is, the larger the size, the better the performance. This result is expected and determined by the existing hospital structure, that is, by the installed capacity of the larger PHUs and by the greater demand in municipalities with larger population sizes16,17. However,
it should be noted that the small general PHUs presented a very restricted service offer, which could be better organized in the regional health service system. As has been pointed out in other publications, these hos-pitals do not present economies of scale, and there is a direct relationship between quality and quantity of procedures1,2,14,15.
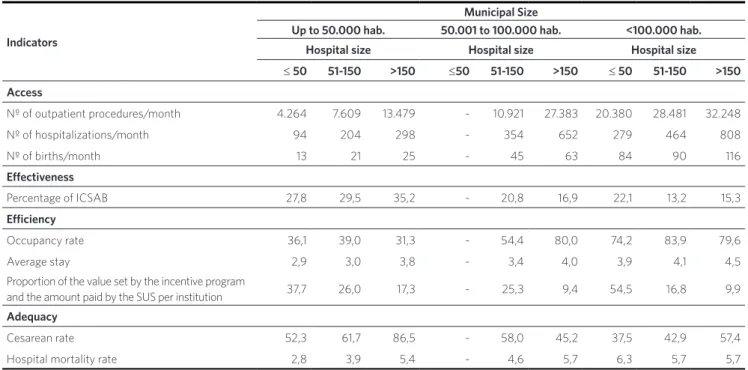
The effectiveness indicator, percent-age of ICSAB, was higher in small size hospitals, even when located in larger mu-nicipalities. This result was similar to that found in 2013 in the universe of hospitals in the state of São Paulo with less than 50 beds, in which the percentage of ICSAB was Table 3. Distribution of the medians of the performance indicators according to municipal size and hospital size of the hospitals of the incentive program, São Paulo, 2012
Indicators
Municipal Size
Up to 50.000 hab. 50.001 to 100.000 hab. <100.000 hab.
Hospital size Hospital size Hospital size
≤ 50 51-150 >150 ≤50 51-150 >150 ≤ 50 51-150 >150
Access
Nº of outpatient procedures/month 4.264 7.609 13.479 - 10.921 27.383 20.380 28.481 32.248
Nº of hospitalizations/month 94 204 298 - 354 652 279 464 808
Nº of births/month 13 21 25 - 45 63 84 90 116
Effectiveness
Percentage of ICSAB 27,8 29,5 35,2 - 20,8 16,9 22,1 13,2 15,3
Efficiency
Occupancy rate 36,1 39,0 31,3 - 54,4 80,0 74,2 83,9 79,6
Average stay 2,9 3,0 3,8 - 3,4 4,0 3,9 4,1 4,5
Proportion of the value set by the incentive program
and the amount paid by the SUS per institution 37,7 26,0 17,3 - 25,3 9,4 54,5 16,8 9,9 Adequacy
Cesarean rate 52,3 61,7 86,5 - 58,0 45,2 37,5 42,9 57,4
Hospital mortality rate 2,8 3,9 5,4 - 4,6 5,7 6,3 5,7 5,7
29%14. The provision of services in small
general hospitals contributes to unneces-sary hospitalizations2. This high proportion
of hospitalizations of simpler cases, often un-necessary, may indicate that the urgent care of cases with low complexity, which should be resolved in the basic care network, was per-formed by these small hospitals. In addition, the high percentage of ICSAB may indicate a lack of quality and a lack of articulation in the Regional Health Care Network (RRAS)18.
In relation to the indicators of occupancy rate, efficiency indicator, the performance of all PHU was lower than that found for all hospital units with SUS service in the state in 2013 (67%). Regarding small hospitals, performance was similar11. The result of the
poorer performance of this indicator in small hospitals, as compared to large ones, corrob-orates the findings in other studies conduct-ed in the state of São Paulo1,2,14. The apparent
idleness of beds, demonstrated by occupa-tion rates below 80%, should be examined considering the differences between the dif-ferent clinics, which reflect the changing de-mographic and epidemiological profiles and the existence of great regional inequalities, not only in the supply of beds, but also in its complexity and resolubility. Economies of scale can be found in hospitals with more than 100 beds, due to the direct relationship between quality and quantity16,19.
The cost of financing small size hospitals is disproportionately high compared to their low efficiency1,15. Another efficiency
indica-tor used was the amount of value allocated by the incentive program on the financial value received by the SUS production, which was much higher for small PHUs compared to large PHUs – four times higher. In 25% of small-scale UHFs, this resource accounted for more than half of the financial value re-ceived by SUS production, a result that indi-cates difficulties in the sustainability of these PHUs and their dependence on the incentive program to maintain their operation. In ad-dition, the distribution of the proportions
found evidences the need to revise the current criterion: the proportional distri-bution of the number of hospitals contem-plated according to the size of the regions, a factor that could have led to distortions in the indication of hospitals. In one of the HR, a small philanthropic hospital was indicated, even though there were other larger public hospitals in the region, only to complete the PHU quota contemplated by HR. This result points to the fragility of the PHU election criterion benefited by this program.
Regarding the adequacy indicators, the worst performance in a small PHU in a large municipality was noticed. The institutional mortality found was twice as high in small PHU, located in a larger municipality, in re-lation to the PHU located in a small munici-pality. This result was not as expected. In the evaluation of hospital mortality, the concern should be focused on identifying the deaths that could be avoided by the hospital, but also reflects the severity of demand. In hospitals that are more complex, this rate could be high due to the severity of the cases treated20, however, such an analysis should
be carried out with caution, since only a single small PHU was contemplated with the incentive program in one large municipality. Institutional mortality rates can be consid-ered as a possible indicator to discriminate services with different performance in the quality of the patient care process20,21.
Medium size and large size hospitals showed a higher cesarean rate, regardless of the size of the municipality. One of the large PHUs located in a small township presented a caesarean rate approximately six times higher than what is recommended by the World Health Organization22.
Another limitation concerns the produc-tion data used that were approved by the SIA and SIH system, and there may be dif-ferences between the procedures presented by the supplier and those approved, that is, it is possible that the production was higher than the one obtained24.
Meeting the health needs of the popula-tion must always be the central objective of a health system. Health services are an integral part of the system, whose performance influ-ences the living conditions and determinants of health25. The confrontation of a health
condition must be done by providing people with the complete cycle of care for them, that is, in a health care network16. Financial
aid to health services needs to consider the regional context, existing health services, and how they are organized. The hospital is a point of attention for these networks, and it is up to public managers to define the role of the institution in the network and to monitor their performance.
A program of financial assistance to health services should aim to improve the health of the population, always considering the characteristics of the territory in which the service is located. The role it should and would have to play would be based on a re-gional planning that would take into account, in addition to its physical and human re-sources structures, the range of health services in the territory, the conditions of access and the regional context. Thus, as proposed by the incentive program, the in-dication of the institutions to be covered by this financial aid should continue to be at-tributed to the RIC. However, the criteria for
indication and financial figures to be given to each hospital, as well as the appropriateness of funding for small hospitals, would need to be reviewed.
Conclusions
This result corroborates the need to reassess financial incentive programs, especially for small hospitals configured as general hos-pitals. The financial incentive program should be directed to PHU that present good perfor-mance and articulation with the other points of attention of the network, in a more favorable relation of investment and quality of care.
Collaborators
Tanira Gomes de Toledo Barros: organized the project and the planning. Performed the analy-sis and interpretation of the data. Elaborated the draft and revised the content. Participated in the final approval of the manuscript.
Carla Gianna Luppi: organized the project and the planning. Performed the analysis and interpretation of the data. Elaborated the draft and revised the content. Participated in the final approval of the manuscript.
Acknowledgements
References
1. Bittar OJNV, Mendes JDV, Magalhães A. Rede
Hospitalar no Estado de São Paulo: mapear para re-gular [monografia]. São Paulo. SESSP; 2011. 54p.
2. Ramos MCA, Cruz LP, Kishima VC, et al. Avaliação
de desempenho de hospitais que prestam atendi-mento pelo sistema público de saúde, Brasil. Rev. Saúde Pública. Universidade de São Paulo, 2015.
3. São Paulo (Estado). Deliberação CIB nº 232, de 27 de novembro de 2007. Aprovar o Programa Pró-Santa Casa – 2008. Diário Oficial do Estado. 2017 Dez. 11.
4. São Paulo (Estado). Deliberação CIB nº 51, de 17 de setembro de 2009. Nota Técnica sobre o Programa Pró-Santa Casa 2. Este programa substitui o atual Programa Pró-Santa Casa. Diário Oficial do Estado.
2009 Set. 23.
5. Brasil. Coordenação de Assistência Médica e Hospitalar. Secretaria Nacional de Ações Básicas
de Saúde. Conceitos e Definições em Saúde. Brasil. Brasília, DF: Ministério da Saúde; 1997.
6. Brasil. Secretaria Nacional de Ações Básicas de
Saúde. Coordenação de Assistência Médica e Hospitalar. Portaria no 2.224, de 6 de dezembro de 2002. Conceitos e Definições em Saúde. Diário Oficial da União. Brasil. Brasília, DF: Ministério da
Saúde; 1977.
7. Mcglynn EA. Selecting Common Measures of Quality and System Performance. Medical Care,
California.2003; 41(supl.):39-47.
8. Viacava F, Almeida C, Caetano R, et al. Uma me-todologia de avaliação do desempenho do sistema
de saúde brasileiro. Ciênc. Saúde Colet. Associação Brasileira de Saúde Coletiva. Rio de Janeiro. 2004; 9(3): 711-724.
9. Cadastro Nacional de Estabelecimentos de Saúde [internet]. Departamento de Informática do SUS (Datasus) [acesso em 2012 dez 5]. Disponível em: http://www.cnes.datasus.gov.br/.
10. Ministério da Saúde (Brasil). Tabnet [internet].
Departamento de Informática do SUS (Datasus). [acesso em 2017 jun 10]. Disponível em: http://tabnet. datasus.gov.br/cgi/deftohtm.exe?sia/cnv/qisp.def.
11. Ministério da Saúde (Brasil). Tabnet [internet]. Departamento de Informática do SUS (Datasus). [acesso em 2017 jun 10]. Disponível em: http://tabnet. datasus.gov.br/cgi/deftohtm.exe?sih/cnv/qisp.def.
12. Ministério da Saúde (Brasil). Tabnet [internet]. Departamento de Informática do SUS (Datasus). [acesso em 2012 dez 10]. Disponível em: http://
tabnet.datasus.gov.br/cgi/deftohtm.exe?ibge/cnv/ popsp.def.
13. São Paulo. Secretaria de Estado da Saúde de São
Paulo. Matriz de Indicadores de Saúde do Estado de São Paulo, 2012 [internet]. [acesso em 2017 maio 5]. Disponível em: http://www.saude.sp.gov. br/ses/perfil/gestor/informacoes- de-saude/
matriz-de-indicadores-de-saude-atualizado/.
14. Mendes JDV, Cecilio MAM, Osiano VLRL. Hospitais de Pequeno Porte no SUS do estado de
São Paulo. Boletim Epidemiológico Paulista. São Paulo. 2014; (11):127-128.
15. Cunha LF, Bahia L. Construção de hospitais de
pe-queno porte como política de saúde: um caso em-blemático no estado de Maranhão, Brasil. Journal of Management and Primary Health Care, América do Norte. 2014; 6(2): 248-254.
16. Souza RR, Mendes JDV, Barros, coordenadores. Pactuação em saúde. In: Vinte anos do SUS São Paulo. São Paulo. Secretaria de Estado da Saúde;
2008. p. 69-80.
17. Bittar OJNV. Produtividade em hospitais de acor-do com alguns indicaacor-dores hospitalares. Revista
de Saúde Pública. Faculdade de Saúde Pública. Universidade de São Paulo. 1996; 30(1):53-60
e condições sensíveis à atenção primária. Revista de Saúde Pública. Faculdade de Saúde Pública. Universidade de São Paulo. 2008; (42):1041-1052.
19. Bittar OJNV. Indicadores de qualidade e quantida-de em saúquantida-de. São Paulo. Revista quantida-de Administração em Saúde. Associação Brasileira de Medicina
Preventiva e Administração em Saúde. São Paulo. 2001 Jul-Set; 3(12):21-28.
20. Travassos C, Noronha JC, Martins M. Mortalidade
hospitalar como indicador de qualidade: uma re-visão. Ciênc. Saúde Colet. Associação Brasileira de Saúde Coletiva. Rio de Janeiro. 1999; (4):367-381.
21. Martins M, Blais R, Leite IC. Mortalidade hospi-talar e tempo de permanência: comparação entre hospitais públicos e privados na região de Ribeirão Preto, São Paulo, Brasil. Cad. saúde pública. Escola
Nacional de Saúde Pública Sergio Arouca. Rio de Janeiro; 2004; 20(supl.2):S268-S282.
22. World Health Organization. Appropriate technolo-gy for birth. Lancet. 1985; 326(8452):436-437.
23. Escrivão JRA. Uso da informação na gestão de hospitais públicos. Ciênc. Saúde Colet. Associação Brasileira de Saúde Coletiva. Rio de Janeiro. 2007; 12(3):655-666.
24. Rede Interagencial de Informações para a Saúde – RIPSA. Indicadores Básicos para a Saúde no Brasil. 2.ed. Brasília, DF. 2008.
25. Buss PM, Pellegrini Filho A. Saúde e seus Determinantes Sociais. Physis. Instituto de Medicina Social. Universidade do Estado do Rio de
Janeiro. 2007; 17(1):77-93.