Determination of serum lithium: comparison between
atomic emission and absorption spectrometry methods
Determinação sérica de lítio: comparação das metodologias
de espectrometria de emissão e de absorção atômica
Carlos Elielton do Espírito Santo1; Teresa Maria de Jesus Ponte Carvalho2
First submission on 23/03/13; last submission on 21/09/13; accepted for publication on 27/09/13; published on 20/02/14 1. Pharmacy graduate from Universidade Federal do Ceará (UFC).
2. Doctorate in Toxicology from Universidade de São Paulo (USP); head of the Department of Clinical and Toxicological Analyses from the Pharmacy course at UFC.
ABSTRACT
Introduction: The therapeutic monitoring of lithium, through concentration measurements, is important for individual dose adjustment, as a marker of treatment adherence and to prevent poisoning and side effects. Objectives: Validate and compare two methods – atomic emission and atomic absorption – for the determination of lithium in serum samples. Methodology: Parameters such as speciicity, precision, accuracy, limit of detection (LOD) and linearity were considered. The atomic absorption spectrometer was used, operating in either emission or absorption mode. For the quantitative comparison of 30 serum samples from patients with mood disorder treated with lithium, the results were submitted to Student’s t-test, F-test and Pearson’s correlation. Results: The limit of quantiication (LOQ) was established as 0.05 mEq/l of lithium, and calibration curves were constructed in the range of 0.05-2 mEq/l of lithium, using aqueous standards. Sample preparation time was reduced, what is important in medical laboratory. Conclusion: Both methods were considered satisfactory, precise and accurate and can be adopted for lithium quantiication. In the comparison of quantitative results in lithium-treated patients through statistical tests, no signiicant differences were observed. Therefore the methods for lithium quantiication by lame atomic absorption spectrometry (FAAS) and lame atomic emission spectrometry (FAES) may be considered similar.
Key words: lithium; validation; lame atomic absorption spectrometry (FAAS); lame atomic emission spectrometry (FAES).
INTRODUCTION
The bipolar affective disorder is a chronic condition that characterizes by mood swings, with alternate episodes of mania and depression(8). Treatment includes lithium, valproate,
carbamazepine, typical and atypical antipsychotics(5, 7) when
it aims at reducing manic symptoms; and antidepressants, lamotrigine, luoxetine and olanzapine when it is necessary to ight depression. Treatment must be established considering individual aspects.
The use of lithium salts points to the necessity of therapeutic monitoring through determination of serum lithium, as the therapeutic effect of lithium is directly related to its concentration in serum, whose therapeutic levels range between 0.6 and 1.2 mEq/l. Serum levels above 1.5 mEq/l(12) are considered toxic;
therefore, it is a drug with narrow therapeutic index(10).
Monitoring is important also because there is inluence on the therapeutic response to lithium, depending on the heterogeneity of bipolar disorders, leading to pharmacokinetic differences following the patient’s clinical state. In other words, lithium levels decrease in patients during hypomania, remain constant in normal states and increase during depression(11, 12).
Lithium concentrations in plasma, serum, urine or other body luids may be determined by lame atomic emission spectrometry (FAES), also known as lame photometry, a colorimetric semi-quantitative method with ferric periodate(9),
using a lithium ion-selective electrode(3), and by lame atomic
absorption spectrometry (FAAS)(9).
assurance measures into their services, and it is fundamental that they have means and objective criteria to demonstrate, through validation, that the assay methods they employ yield reliable results that meet the expected quality(6).
The aims of this work are to validate and to compare two methods for determination of lithium in serum samples – atomic emission and atomic absorption – so that they are used in medical laboratories; also to produce knowledge and to contribute to the formation of qualiied staff resources in this study area.
METHODOLOGY
Instrument
An atomic absorption Varian(Mulgrave, Australia) model SPECTRAA 55 spectrometer was used, operating in either emission or absorption mode. In the absorption mode, a lithium hollow cathode lamp was employed, at a current of 5 mA. Operational parameters of the equipment were adjusted as recommended by the manufacturer: wavelength of 670.8 nm, slit width of 1 nm, burner height of 7.5 mm, air as oxidizer and acetylene as fuel (air/ acetylene) and a stoichiometric lame.
Materials and reagents
The following were used: volumetric balloon and test tubes of 10 ml; Eppendorf (Westbury, USA) calibrated variable-volume micropipettes; vortex mixer FANEM for the homogenization of solutions and samples. As reagents, the following were used: 1000 mg/l lithium reference analytical solution (J.T.BAKER, USA) certiied by the National Institute of Standards and Technology (NIST) of the United States; Special Reagent Water (SRW) obtained from Millipore system (Bedford, USA), to prepare standard working solutions and sample dilution.
Samples: origin, collection and preparation
Quality control serum samples (serum of patients not taking lithium), as well as samples from bipolar mood disorder patients treated with lithium, were provided by a clinical laboratory in Fortaleza, Brazil.
For the quality control (QC) samples to be used in the validation, the serum of patients not taking lithium and lithium reference standard solutions (1,000 mg of the element) were provided. The quality controls were prepared as follows: a) low concentration quality control (LQC): serum with addition of the analyte, concentration of 0.15 mEq/l, three times the lower limit of
quantiication (LLOQ) of the method; b) medium concentration quality control (MQC): serum with addition of the analyte, concentration of 1 mEq/l, average of LLOQ and the upper limit of quantiication (ULOQ); c) high concentration quality control (HQC): serum with addition of the analyte, concentration of 1.5 mEq/l, 75% of the highest concentration of the calibration curve.
For the treatment of samples, a tenfold dilution with reagent water was made, allowing an absorption measurement within the linear calibration range of the spectrometer. This dilution is important for the reduction of matrix effect. Thus, 200 µl of the sample were diluted with 1,800 µl of water in a 5 ml test tube and homogenized for 30 seconds on a vortex mixer.
Validation
The validation was performed based on the parameters laid down in Resolution RDC 27, of May 17, 2012, of the Brazilian Health Surveillance Agency (ANVISA)(1).
Linearity and working range
In order to verify the method ability to provide a signal that is directly proportional to lithium concentration within a certain application range, standard solutions were prepared at variable concentrations (0.1, 0.2, 0.5, 1, 1.5 and 2 mEq/l), which were selected according to the therapeutic range and the information on linearity included in the equipment manual. After reading the concentrations using both methods, FAAS and FAES, graphs showing the analytical response were produced to identify the linear range, both by visual inspection and using the correlation coeficient (R). The acceptance criterion is R > 0.99.
Limit of quantiication
The limit of quantiication (LOQ) was established through analysis of solutions containing decreasing concentrations of the analyte up to the lowest determinable level with acceptable precision and accuracy (≤ 20%). Samples were prepared with addition of the analyte standard solution at concentrations of 0.01, 0.02, 0.03, 0.04 and 0.05 mEq/l. Five replicates were carried out, and precision and accuracy were evaluated for each concentration.
Calibration curve
were done, using both methods, whose calibration curves were constructed establishing the relationship between signal and concentration, through a linear mathematical model and using the computer program Origin 5.0.
Speciicity
In order to evaluate the matrix effect, a test was conducted that consists of the comparison of calibration in two ways: with calibration standards prepared in reagent water (aqueous standards) and with calibration standards prepared with serum matrix obtained from patients not using lithium. To determine speciicity, serum samples obtained from six different patients were analyzed.
Accuracy and precision
Accuracy and precision assays of both methods were conducted in a same run (intra-run accuracy and precision) and in three different runs and in different days (inter-run accuracy and precision). In each run ive replicates were prepared, at concentrations: LLOQ (0.05 mEq/l), LQC (0.15 mEq/l), MQC (1 mEq/l), HQC (1.5 mEq/l). Intra-run (ive replicates) and inter-run (15 replicates) accuracy and precision were calculated based on the obtained values. The acceptance criteria do not allow values higher than 15% as coeficient of variation (CV) and relative standard deviation (RSD). For LLOQ, values up to 20% are admitted.
Use of the methods after validation
Thirty samples of blood serum from lithium-treated patients were used. Collection was performed in 5 ml evacuated tubes, with clot activator and, after 20 minutes at room temperature, the samples were centrifuged (2,500 rpm, 15 min) to separate blood serum. Before analysis, samples were diluted ten times with reagent water type 1 (200 µl of the sample were diluted in 1,800 µl of water) and homogenized for 30 seconds.
Methodology comparison
We used 30 serum samples from lithium-treated patients, analyzed them with both methods, making a comparison using the Student’s t-test, F test and Pearson correlation.
Ethical aspects
The study was designed in accordance with the guidelines and norms on research involving human beings (Resolution
no. 196/1996). It was submitted to the research ethics committee of Universidade Federal do Ceará, and approved in the meeting held on December 9, 2010, with protocol number 282/10.
RESULTS AND DISCUSSIONS
Validation
Linearity and working range
The curves constructed at concentrations of 0.1, 0.2, 0.5, 1, 1.5 and 2 (mEq/l), using the techniques FAAS and FAES, are presented in Figure 1. The result shows that in the used working range (from 0.1 to 2 mEq/l of lithium), FAAS demonstrates linearity, with R equal to 0.9998, and the linear equation obtained was Y = 0.1866× + 0.001. In determination by FAES, the obtained R was 0.9998, but we could observe, both visually and by comparison between R values, that FAAS presents better linearity. FAES demonstrates a slight loss of linearity, at and above the concentration of 1.5 mEq/l. The linear equation obtained in this method was Y = 0.484× + 0.0326.
Speciicity
The calibration curves obtained with calibration standards prepared in reagent water (aqueous standards) and serum matrix (patients who do not use lithium as treatment) using FAAS and FAES techniques were parallel, and the slope values were very close, with no signiicant difference between calibration curves. One may say there was no interference from the matrix.
The speciicity assay with serum samples obtained from six different patients, using the therapeutic range of 0.6 to 1.2 mEq/l, demonstrated a very small response, on average, 0.011 mEq/l for FAAS and 0.013 mEq/l for FAES, without compromising the identiication and/or quantiication of the substance of interest. The obtained values may be due to the endogenous lithium or to other interferences, such as that of strontium, with an absorption maximum at 671 nm(2).
FIGURE 1 – Calibration curves for assessment of linearity by techniques FAAS and FAES FAAS: flame atomic absorption spectrometry; FAES: flame atomic emission spectrometry.
Absorption
Emission intensity
FAAS 0.4
0.35
0.3
0.25
0.2
0.15
0.1
0.05
0
-0.05
0 0.5 1 1.5 2
[Li] mEq/l [Li] mEq/l
Y = 0.1866 + 0.001 R = 0.9998
FAES
Y = 0.484× + 0.0326 R = 0.9998
1
0.8
0.6
0.4
0.2
0
0 0.5 1 1.5 2
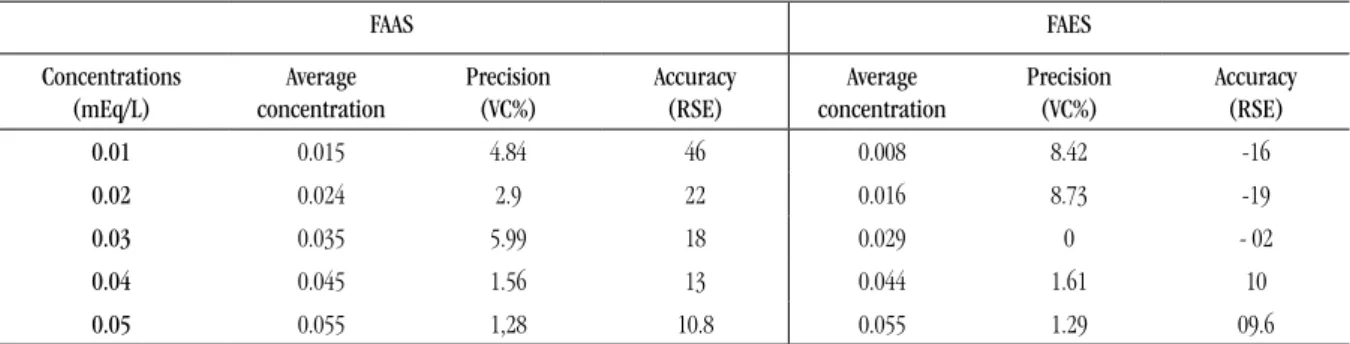
Limit of quantiication
The LOQ established by means of analysis in quintuplet of solutions containing decreasing concentrations of the analyte, 0.01, 0.02, 0.03, 0.04 and 0.05 mEq/l are shown in Table 1. Precision and accuracy were obtained within the acceptance criteria, starting at the concentration of 0.03 mEq/l for FAAS and at 0.01 mEq/l for FAES; however, the concentration of 0.05 mEq/l was selected as LOQ for both methods, because it is a safer and acceptable limit for the aims of the method.
Calibration curve
The average of calibration curves, using both methods, at concentrations of 0.05, 0.1, 0.2, 0.5, 1, 1.5 and 2 mEq/l of lithium are shown in Figure 2, presenting R = 0.9996 and linear equation Y = 0.1962× + 0.0019 for FAAS, and R = 0.9955 and linear equation Y = 0.4897× + 0.027 for FAES.
Accuracy and precision
The assays of intra-run and inter-run accuracy and precision for both methods are described in Table 2. Both methods are considered accurate and precise, as they presented accuracy and precision within the established norms: CV and relative standard error (RSE) below 15%.
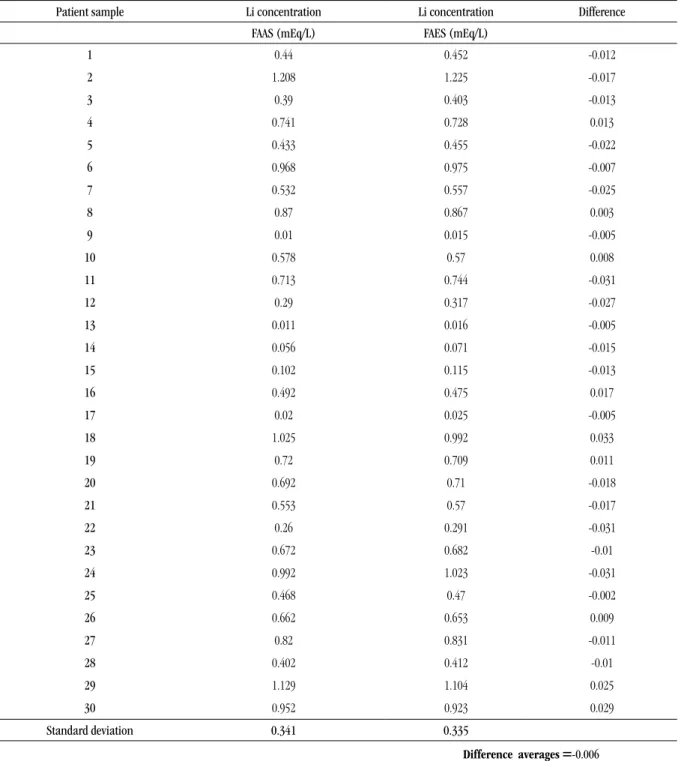
Method comparison
For comparison of both methods, 30 samples from patients treated with lithium carbonate were analyzed. For each sample both results were similar, but not identical (Table 3). The difference between both methods was calculated for each sample, as well as the average of differences and the standard deviation of differences. The applied t-test, with 95% conidence and 29 (n-1) degrees of freedom, presented a result of tcalculated equal to 1.855, which is lower than ttabulated equal to 2.045. Therefore, there is more than 95% chance that both results are the same.
TABLE 1 – Determination of the limit of quantiication (n = 5)
FAAS FAES
Concentrations
(mEq/L)
Average
concentration
Precision
(VC%)
Accuracy (RSE)
Average
concentration
Precision
(VC%)
Accuracy (RSE)
0.01 0.015 4.84 46 0.008 8.42 -16
0.02 0.024 2.9 22 0.016 8.73 -19
0.03 0.035 5.99 18 0.029 0 - 02
0.04 0.045 1.56 13 0.044 1.61 10
0.05 0.055 1,28 10.8 0.055 1.29 09.6
FIGURE 2 – Calibration curves in the concentrations from 0.05 to 2 mq/l lithium by techniques FAAS and FAES FAAS: flame atomic absorption spectrometry; FAES: flame atomic emission spectrometry.
.
Absorption
Emission intensity
Calibration curves
FAAS
Calibration curves
FAES
0.4
0.35
0.3
0.25
0.2
0.15
0.1
0.05
0
-0.05
0 0.5 1 1.5 2
[Li] mEq/l [Li] mEq/l
Y = 0.1962 + 0.0019
R = 0.9996 Y = 0.4897× + 0.027
R = 0.99546
1
0.8
0.6
0.4
0.2
0
0 0.5 1 1.5 2
TABLE 2 – Determination of intra- (n = 5) and inter-assay (n = 15) precision and accuracy
Intra-assay precision and accuracy
FAAS FAES
Concentration
(mEq/L)
Replicate averages
Precision
(VC%)
Accuracy (RSE)
Replicate averages
Precision
(VC%)
Accuracy (RSE)
LLOQ (0.05) 0.054 2.423 7.6 0.052 2.841 4.4
LQC(0.15) 0.157 1.822 4.8 0.163 2.656 8.533
MQC (1) 1.046 1.187 4.64 1.087 1.265 8.72
HQC(1.5) 1.499 0.735 -0.04 1.601 0.722 6.747
Inter-assay precision and accuracy
LLOQ(0.05) 0.052 5.321 4.267 0.052 4.903 3.2
LQC(0.15) 0.158 1.484 5.289 0.16 2.035 6.844
MQC(1) 1.032 1.832 3.233 1.052 3.278 5.193
HQC(1.5) 1.527 1.862 1.831 1.576 1.555 5.0
VC%: variation coefficient = standard deviation/mean* 100; RSE: relative standard error = (average experimental concentration - nominal value)/nominal value* 100; FAAS: flame atomic absorption spectrometry; FAES: flame atomic emission spectrometry; LLOQ: lower limit of quantification; LQC: low concentration quality control; MQC: medium concentration quality control; HQC: high concentration quality control.
In order to verify whether there is a signiicant difference between the variances of both methods, the F-test was applied at the 5% signiicance level based on the degrees of freedom 29 of both variances. Standard deviations were calculated from the 30 results of lithium concentrations in patients obtained for each method (Table 3) and the result presented Fcalculated equal to 0.982, while Ftabulated was 1.86. Since Fcalculated was lower than Fcritical, one may conclude that there is no signiicant difference between precisions.
The results obtained through FAAS and FAES were compared based on linear regression and the Pearson correlation. The result is presented in Figure 3. The graph and the descriptive statistics were obtained by using software Minitab 15.0.
TABLE 3 – Result of lithium dosage in patients (n = 30) treated with lithium carbonate and comparison of both methods (t-test)
Patient sample Li concentration Li concentration Difference
FAAS (mEq/L) FAES (mEq/L)
1 0.44 0.452 -0.012
2 1.208 1.225 -0.017
3 0.39 0.403 -0.013
4 0.741 0.728 0.013
5 0.433 0.455 -0.022
6 0.968 0.975 -0.007
7 0.532 0.557 -0.025
8 0.87 0.867 0.003
9 0.01 0.015 -0.005
10 0.578 0.57 0.008
11 0.713 0.744 -0.031
12 0.29 0.317 -0.027
13 0.011 0.016 -0.005
14 0.056 0.071 -0.015
15 0.102 0.115 -0.013
16 0.492 0.475 0.017
17 0.02 0.025 -0.005
18 1.025 0.992 0.033
19 0.72 0.709 0.011
20 0.692 0.71 -0.018
21 0.553 0.57 -0.017
22 0.26 0.291 -0.031
23 0.672 0.682 -0.01
24 0.992 1.023 -0.031
25 0.468 0.47 -0.002
26 0.662 0.653 0.009
27 0.82 0.831 -0.011
28 0.402 0.412 -0.01
29 1.129 1.104 0.025
30 0.952 0.923 0.029
Standard deviation 0.341 0.335
Differenceaverages =-0.006
Standard deviation = 0.018
tcalculated = 1.855
FAAS: flame atomic absorption spectrometry; FAES: flame atomic emission spectrometry.
CONCLUSION
Comparing FAES and FAAS as to the necessary parameters for validation (speciicity, linearity, precision, accuracy, LOQ),
RESUMO
Introdução: A monitorização terapêutica por meio da determinação sérica de lítio é importante para proporcionar o ajuste individual da dose, como marcador de adesão e para prevenir intoxicações. Objetivos: Validar e comparar duas metodologias, a de emissão e a de absorção atômicas, para determinação de lítio em amostras de soro. Metodologia: Foram determinados parâmetros de especificidade, precisão, exatidão, limite de detecção e linearidade a fim de validar as metodologias para determinação de lítio. Foi utilizado espectrômetro de absorção atômica, funcionando no modo de emissão ou de absorção. Para comparação das metodologias foram utilizados os testes estatísticos (teste t de Student, o teste F e a correlação de Pearson) nos resultados quantitativos de 30 amostras de soro sanguíneo de pacientes que faziam uso terapêutico de lítio para o controle do transtorno de humor bipolar (THB). Resultados: Foram estabelecidos um limite de quantificação de 0,05 mEq/l de lítio e curvas de calibração de 0,05 a 2 mEq/l de lítio, construídas utilizando padrões aquosos, com redução no tempo de preparo das amostras, principalmente para ser utilizado em laboratório de análises clínicas. Conclusão: Os dois métodos foram considerados satisfatórios, precisos e exatos e podem ser adotados para a quantificação do lítio. Na comparação dos dois métodos por testes estatísticos em amostras de pacientes tratados com o fármaco, não foram observadas diferenças significativas entre os resultados encontrados. Desta forma, os métodos para quantificação do lítio por espectrometria de absorção atômica em chama (FAAS) e espectrometria de emissão atômica em chama (FAES) podem ser considerados semelhantes.
Unitermos: lítio; validação; espectrometria de absorção atômica; espectrometria de emissão atômica.
REFERENCES
1. AGÊNCIA NACIONAL DE VIGILÂNCIA SANITÁRIA (ANVISA) BRASIL.
Resolução nº 27, de 17 de maio de 2012. Dispõe sobre os requisitos
mínimos para a validação de métodos bioanalíticos empregados em estudos com ins de registro e pós-registro de medicamentos. Diário
Oficial da União, 22 de maio de 2012.
2. AMERICAN PUBLIC HEALTH ASSOCIATION (APHA). Standard Methods
for the Examination of the Water and Wastewater.19th ed. New York:
1995.
FIGURE 3 – Correlation between the results obtained by the techniques FAAS and FAES FAAS: flame atomic absorption spectrometry; FAES: flame atomic emission spectrometry.
FAAS
FAES 1.2
1
0.8
0.6
0.4
0.2
0
0 0.2 0.4 0.6 0.8 1 1.2
n = 30
Slope = 1.01
Intercept = 0.015
Correlation coeficient (r) = 0.9987
which one may perceive a loss of linearity, mainly starting at the 1.5 mEq/l concentration.
Matrix interference was not observed, and calibration curves for both methods were constructed using aqueous standards, a simpler preparation method that provides a reduction in sample preparation time, especially to be used in clinical laboratories.
The quantitative analysis of lithium in samples from patients treated with the drug comparing both methods through statistical tests showed there are no signiicant differences between the results. And the test called Pearson’s correlation coeficient showed a strong correlation between both methods. Thus, the methods FAAS and FAES for lithium quantiication may be considered similar.
3. FERNANDES A. S. G.; LEAL A. C. Lítio e sua aplicação terapêutica na psicose maníaco-depressiva. Ciências Farmacêuticas da Faculdade de Farmácia de Lisboa, 2002.
4. GOODWIN, F. K. Rationale for long-term treatment of bipolar disorder and evidence for long-term lithium treatment. J Clin Psychiatry, v. 63, suppl. 10, p. 10-12, 2002.
5. GOODWIN, G. M. Evidence-based guidelines for treating bipolar disorder: revised second edition – recommendations from the British Association for Psychopharmacology. J Psychopharmacol, v. 23, n. 4,
6. INSTITUTO NACIONAL DE METROLOGIA (INMETRO). Orientação
sobre validação de métodos analíticos. DOQ_CGCRE-008, revisão 3,
2010.
7. KAPCZINSKI, F. et al. Tratamento farmacológico do transtorno bipolar: as evidências de ensaios clínicos randomizados. Rev Psiq Clín,
v. 32, suppl 1, p. 34-38, 2005.
8. MICHELON, L.; VALLADA, H. Fatores genéticos e ambientais na manifestação do transtorno bipolar. Rev Psiq Clín, v. 32, suppl 1, p. 21-27, 2005.
MAILING ADDRESS
Teresa Maria de Jesus Ponte Carvalho
Universidade Federal do Ceará; Faculdade de Farmácia – Departamento de Análises Clínicas e Toxicológicas; Rua Capitão Francisco Pedro, 1210 – Poranga-bussu; CEP: 60430-372; Fortaleza-CE, Brazil; e-mail: [email protected].
9. PASSARELI, M. M. Saliva como controle terapêutico do lítio. São Paulo, 1987. Tese (doutoramento) – Universidade de São Paulo. 10. ROSA, A. R. et al. Monitoramento de adesão ao tratamento com lítio.
Rev Psiq Clín, v. 33, n. 5, p. 249-61, 2006.
11. SCOTT, J.; POPE, M. Nonadherence with mood stabilizers: prevalence and predictors. J Clin Psychiatry, v. 63, n. 5, p. 384-90, 2002.