Licence CC
Prevalence and factors associated with
nutritional status among female university
students in Florianópolis, SC
Prevalência e fatores associados ao estado nutricional de
universitárias ingressantes em Florianópolis, SC
Larissa da Cunha Feio Costa1
Francisco de Assis Guedes de Vasconcelos1
Abstract– University admission provides the adoption of new behaviors, which can afect the health of students. he objective of this study was to identify the character-istics and factors associated with the nutritional status of female university students in Florianopolis, SC, and to assess their prevalence. Socioeconomic and behavioral variables were obtained by a structured questionnaire. Nutritional status was assessed based on body mass index, waist circumference and body fat percentage. Food consumption data were obtained through the application of a 24-hour food recall. he chi-square test was used to select independent variables associated with body mass index. Response rate in this study was 86.6% (total of 220 students). Most students were teenagers (57.7%), lived with parents (69.5%), were sedentary (55.9%), and eutrophic (72.3%). he prevalence was 15.9% for underweight and 11.8% for overweight. Breakfast was the main meal most frequently omitted (16.9%), and most students (79.0%) had an energy intake below 2,200 kcal. Energy intake was the only variable inversely associated with nutritional status (p = 0.0358). here is a need to implement educational health measures in universities in order to establish healthier lifestyle and eating habits.
Key words: Feeding behavior; Nutritional status; Students.
Resumo – O ingresso no meio universitário proporciona a adoção de novos comportamentos, que podem repercutir na saúde dos estudantes. O objetivo do presente estudo foi avaliar o peril e fatores associados ao estado nutricional de universitárias ingressantes em uma uni-versidade pública de Florianópolis, SC. As variáveis sociodemográicas e comportamentais foram obtidas por meio de entrevista com aplicação de questionário estruturado. O estado nutricional foi avaliado com base no índice de massa corporal, circunferência da cintura e percentual de gordura corporal. Os dados de consumo alimentar foram obtidos por meio da aplicação de inquérito recordatório alimentar de 24 horas. O teste Qui-quadrado de Pearson foi aplicado para selecionar as variáveis independentes associadas ao índice de massa corpo-ral. A taxa de resposta obtida no presente estudo foi de 86,6%, totalizando a participação de 220 universitárias. As estudantes, em maioria, eram adolescentes (57,7%), residiam com os familiares (69,5%), eram sedentárias (55,9%) e eutróicas (72,3%). A prevalência de baixo peso foi de 15,9%, enquanto a de excesso de peso foi de 11,8%. O desjejum foi a refeição principal de maior omissão entre as universitárias (16,9%) e a maioria delas (79,0%) apre-sentou consumo energético inferior a 2.200 quilocalorias. O consumo energético foi a única variável associada, inversamente, com o estado nutricional (p = 0,0358). Faz-se necessária a implantação de medidas educativas de saúde na universidade, a im de estabelecer hábitos
1 Federal University of Santa Catarina. Graduate Program in Nutrition. Florianópolis, SC, Brazil
INTRODUCTION
Admission to higher education is considered an outstanding moment in the psychosocial development of young students, because new behavior patterns are adopted in this period, as well as social and afective experiences1. he
transition occurs simultaneously with a number of other changes in the stu-dent’s life. For many youngsters, the university is the irst time that they will have to be responsible for managing their housing, feeding and inances2.
In other words, in addition to the signiicant psychosocial instability characteristic of adolescence and young adulthood, entering the univer-sity environment provides new social relations and the adoption of new behaviors, such as diferent eating patterns, physical activity, alcohol consumption and smoking, which can interfere with the physical, social and biological formation of this group and may make these individuals vulnerable to health problems3.
Research has revealed that college students show low prevalence of healthy eating, with a high intake of fat and added sugar and a low intake of fruits and vegetables4. Such practices, associated with a low level of
physical activity, may contribute to the increasing prevalence of obesity in this population5.
It is known that obesity and the incidence of eating disorders has been increasing in recent decades, particularly reaching teenagers and young female6-8 adults. Notwithstanding, few studies have investigated the
nutri-tional proile of university students and factors associated with such proile. Such data could be useful in guiding the planning and implementation of health interventions at the university - an institution considered to be important in forming students’ habits9.
herefore, the objective of this article was to describe and investigate factors associated with the nutritional status of female college students at a Brazilian public university in Florianópolis, SC, Brazil.
METHODOLOGICAL PROCEDURES
his is a cross-sectional study conducted with a probability sample of 220 entrant female students in 55 graduate courses at the Federal University of Santa Cata-rina (UFSC) in the irst semester of 2006. It is also an integral part of a research project that sought to identify the prevalence of abnormal eating behaviors10.
Considering the total of students enrolled in the semester during which this research was conducted (n = 935), the minimum sample size was calcu-lated using the following parameters: conidence level of 95%, sampling error of 2.85% and prevalence of abnormal eating behaviors of 5.5%11, yielding a
list of random numbers generated by EPI INFO 6.0 sotware. he sample included female students entering university at UFSC in the irst semester of 2006 and excluded male students, female students who were not attend-ing the irst half of their course, pregnant women and people with special needs that made it impossible for them to participate in the research.
Data collection was carried out between June 5, 2006 and December 8, 2006, including socio-demographic (age, parents’ educational level in years of study, monthly household income), behavioral (people with whom the student lives, physical activity, omission of meals) and nutritional (food consumption and nutritional status) variables.
Socio-demographic and behavioral variables
he students were divided into two age groups: adolescents aged 19 years or less and adults aged 20 years or more12.
Maternal and paternal educational levels were expressed in years of study and categorized for association analysis into: 1 to 8 years of schooling and 9 or more years of schooling.
Net monthly household income, reported by the students, was ex-pressed in absolute values (in Brazilian Reais). For association analysis with the outcome, the monthly household income was converted into minimum wages (MW) and distributed into quartiles.
he variable that evaluated with whom the students lived was catego-rized into: live alone, with parents or with roommates. Physical activity referred to the practice of habitual leisure activities and was assessed by the presence or absence of physical activity and by the frequency of physical activity in days and hours.
Food consumption
Food consumption and omission of meals were investigated with a 24-hour food recall, applied in a single day by the research team, with the help of tools for taking photographic records and measuring food portions, both of them developed by the Ministry of Health13.
Food consumption was evaluated by calculating energy consumption in kilocalories and macronutrient consumption in grams (proteins, lipids and carbohydrates). hese amounts were recorded in Nutwin version 2.5 sotware, in which the daily intake of each nutrient was obtained. he daily intakes of nutrients were analyzed following FNB/IOM recommendations14.
he results of energy consumption were grouped into two categories according to the Recommended Dietary Allowances (RDA)15 for females
in the age group from 15 to 50 years: energy consumption < 2,200 kcal and energy consumption ≥ 2,200 kcal.
Anthropometry
Students’ weight and height were used for the calculation of Body Mass Index (BMI), assessed with the criteria recommended by the World Health Organization (WHO)17, which considers individuals with BMI < 18.5 kg/
m² as underweight, between 18.5 kg/m² and < 25.0 kg/m² as eutrophic, be-tween 25.0 kg/m² and 30.0 kg/m² as overweight, and ≥ 30.0 kg/m² as obese.
WC was measured at the midpoint between the last rib17 and iliac crest
and classiied according to criteria based on Han et al18, suggested by the
WHO17, which establish that WC < 80 cm represents absence of risk of
abdominal obesity and WC ≥ 80 cm represents risk of abdominal obesity. Biceps, triceps, sub scapular, suprailiac skinfold thickness were meas-ured three times in order to estimate body fat percentage (%BF) from the formula of Durnin and Womersley19, considering the average of the
three measurements, and the classiication followed the criteria proposed by Lohman20: malnourished %BF ≤ 8%; eutrophic %BF > 8% and 32% <;
obese %BF ≥ 32%.
Statistical analysis
Statistical calculations were performed with the support of Epi info version 3.5.1. In order to characterize the sample, variables were described as meas-ures of central tendency and dispersion (median and standard deviation). he Pearson’s chi-square test was applied to select independent variables associated with the outcome. Signiicance level was set at 5% (p ≤ 0.05).
he outcome of this study was BMI categorized into: underweight, entropy and overweight (overweight and obesity), and the independent variables were: age, maternal and paternal education, monthly household income, people with whom the student lives, physical activity, and energy consumption.
Ethical aspects
his study was approved by the Committee of Ethics in Research with Humans at the Federal University of Santa Catarina (Protocol 047/06). he data were collected ater obtaining written consent from the coordinators of the courses, as well as from the selected students.
RESULTS
he response rate obtained in this study was 86.6%, totaling 220 female university students, with a 13.4% loss. he reasons for the losses were: refusal to participate in the research and withdrawal of some students who initially accepted to participate but were absent on the days of data collection or refused to participate in any part of the collection process.
amplitude of 1.3 MW to 74.3 MW. When MW were distributed quartiles, it was observed that the 25% lowest income students presented a monthly household income of up to 5.7 MW, while the 25% highest income students had a monthly household income of at least 20 MW.
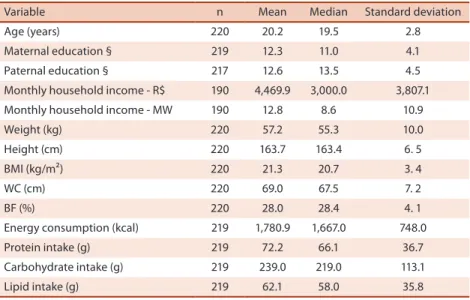
Mean BMI was 21.3 kg/m², mean waist circumference was 69 cm, and mean body fat percentage was 28%. Mean energy consumption of the students was 1,780.86 kcal, with protein, carbohydrate and lipid consump-tion corresponding to 16.2, 53.7% and 31.4% of total energy consumpconsump-tion, respectively.
Table 1. Distribution of values of central tendency and dispersion for the socioeconomic, demographic and anthropometric variables and dietary intake of female university students. Florianópolis, Brazil, 2006.
Variable n Mean Median Standard deviation
Age (years) 220 20.2 19.5 2.8
Maternal education § 219 12.3 11.0 4.1
Paternal education § 217 12.6 13.5 4.5
Monthly household income - R$ 190 4,469.9 3,000.0 3,807.1
Monthly household income - MW 190 12.8 8.6 10.9
Weight (kg) 220 57.2 55.3 10.0
Height (cm) 220 163.7 163.4 6. 5
BMI (kg/m²) 220 21.3 20.7 3. 4
WC (cm) 220 69.0 67.5 7. 2
BF (%) 220 28.0 28.4 4. 1
Energy consumption (kcal) 219 1,780.9 1,667.0 748.0
Protein intake (g) 219 72.2 66.1 36.7
Carbohydrate intake (g) 219 239.0 219.0 113.1
Lipid intake (g) 219 62.1 58.0 35.8
R$ = Brazilian Reais; MW = minimum wages; § = years of schooling; BMI = body mass index; WC = waist circumference; BF = body fat.
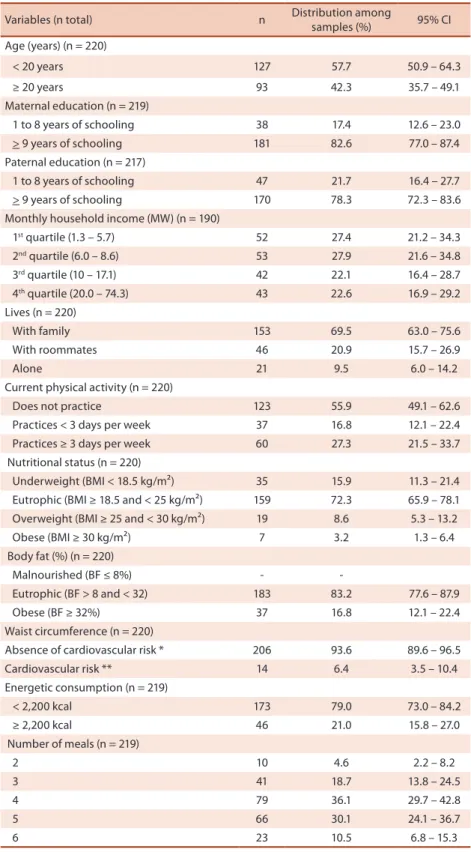
Table 2 shows frequency distribution of demographic, socioeconomic, behavioral and anthropometric variables and of energy consumption.
A high frequency of teenage students (57.7%) was observed, as well as of students whose fathers and mothers had an educational level equal to or greater than 9 years of study (78.3% and 82.6%, respectively) and whose monthly household income was greater than 6 minimum wages (72.1%) and of students who lived with the family (69.5%), were sedentary (55.9%), eutrophic (72.3%), and consumed four meals per day (36.1%).
he study also found a high number of students living on their own or with roommates (30.4%) and a high prevalence of underweight (15.9%). Obesity measured by body fat percentage was present in 16.8% of the participants, while overweight and obesity assessed by BMI amounted to 11.8% and obesity rates estimated by waist circumference reached 6.4%.
Table 2. Frequency distribution of demographic, socioeconomic, behavioral, anthropometric variables and energy consumption in female university students. Florianópolis, Brazil, 2006.
Variables (n total) n Distribution among samples (%) 95% CI
Age (years) (n = 220)
< 20 years 127 57.7 50.9 – 64.3
≥ 20 years 93 42.3 35.7 – 49.1
Maternal education (n = 219)
1 to 8 years of schooling 38 17.4 12.6 – 23.0
> 9 years of schooling 181 82.6 77.0 – 87.4
Paternal education (n = 217)
1 to 8 years of schooling 47 21.7 16.4 – 27.7
> 9 years of schooling 170 78.3 72.3 – 83.6
Monthly household income (MW) (n = 190)
1st quartile (1.3 – 5.7) 52 27.4 21.2 – 34.3
2nd quartile (6.0 – 8.6) 53 27.9 21.6 – 34.8
3rd quartile (10 – 17.1) 42 22.1 16.4 – 28.7
4th quartile (20.0 – 74.3) 43 22.6 16.9 – 29.2
Lives (n = 220)
With family 153 69.5 63.0 – 75.6
With roommates 46 20.9 15.7 – 26.9
Alone 21 9.5 6.0 – 14.2
Current physical activity (n = 220)
Does not practice 123 55.9 49.1 – 62.6
Practices < 3 days per week 37 16.8 12.1 – 22.4
Practices ≥ 3 days per week 60 27.3 21.5 – 33.7
Nutritional status (n = 220)
Underweight (BMI < 18.5 kg/m²) 35 15.9 11.3 – 21.4
Eutrophic (BMI ≥ 18.5 and < 25 kg/m²) 159 72.3 65.9 – 78.1
Overweight (BMI ≥ 25 and < 30 kg/m²) 19 8.6 5.3 – 13.2
Obese (BMI ≥ 30 kg/m²) 7 3.2 1.3 – 6.4
Body fat (%) (n = 220)
Malnourished (BF ≤ 8%) -
Eutrophic (BF > 8 and < 32) 183 83.2 77.6 – 87.9
Obese (BF ≥ 32%) 37 16.8 12.1 – 22.4
Waist circumference (n = 220)
Absence of cardiovascular risk * 206 93.6 89.6 – 96.5
Cardiovascular risk ** 14 6.4 3.5 – 10.4
Energetic consumption (n = 219)
< 2,200 kcal 173 79.0 73.0 – 84.2
≥ 2,200 kcal 46 21.0 15.8 – 27.0
Number of meals (n = 219)
2 10 4.6 2.2 – 8.2
3 41 18.7 13.8 – 24.5
4 79 36.1 29.7 – 42.8
5 66 30.1 24.1 – 36.7
6 23 10.5 6.8 – 15.3
* = waist circumference <80 cm; ** = waist circumference ≥80 cm.
DISCUSSION
he socioeconomic proile of the female university students revealed that most of their parents had an educational level equal to or higher than 9 years of schooling. Comparing the average income of the irst quartile (1.5 MW) with those of the remaining quartiles, it was observed that this average was approximately ive times lower than that of the second quartile (7.9 MW), nine times lower than that of the third quartile (13.4 MW), and nineteen times lower than that of the fourth quartile (29.0 MW), which demonstrates important diferences in the distribution of income among the population studied.
he literature points out that the access to higher education is still inluenced by the socioeconomic level of youngsters21. According to Baloch
and Gurgel22, 61% of students from free public university education belong
to the 20% richest families and only 3% of them come from low-income families.
Concerning the practice of physical activity, the predominant inding was the absence of this practice. In a study with entrant university students of both sexes, Vieira et al4 also found that more than half of students showed
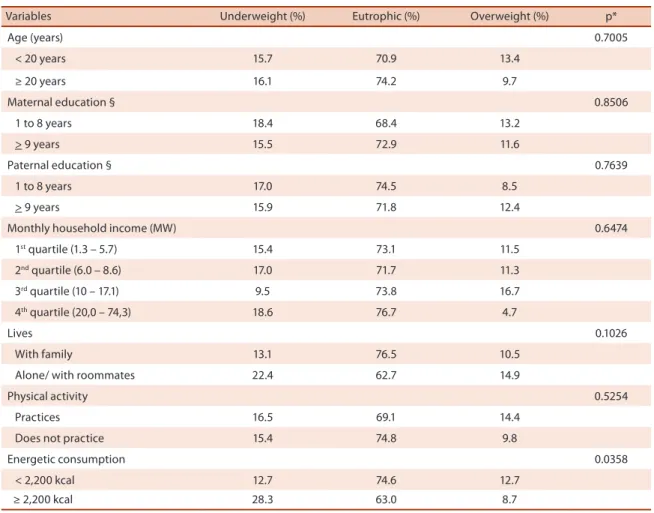
Table 3. Association of nutritional status according to BMI with socioeconomic and behavioral variables and food consumption. Florianópolis, Brazil, 2006.
Variables Underweight (%) Eutrophic (%) Overweight (%) p*
Age (years) 0.7005
< 20 years 15.7 70.9 13.4
≥ 20 years 16.1 74.2 9.7
Maternal education § 0.8506
1 to 8 years 18.4 68.4 13.2
> 9 years 15.5 72.9 11.6
Paternal education § 0.7639
1 to 8 years 17.0 74.5 8.5
> 9 years 15.9 71.8 12.4
Monthly household income (MW) 0.6474
1st quartile (1.3 – 5.7) 15.4 73.1 11.5
2nd quartile (6.0 – 8.6) 17.0 71.7 11.3
3rd quartile (10 – 17.1) 9.5 73.8 16.7
4th quartile (20,0 – 74,3) 18.6 76.7 4.7
Lives 0.1026
With family 13.1 76.5 10.5
Alone/ with roommates 22.4 62.7 14.9
Physical activity 0.5254
Practices 16.5 69.1 14.4
Does not practice 15.4 74.8 9.8
Energetic consumption 0.0358
< 2,200 kcal 12.7 74.6 12.7
≥ 2,200 kcal 28.3 63.0 8.7
lack of physical activity. hese results can be explained by the busy routine of the students, who end up abandoning physical activity ater entering university4.
In relation to the results obtained in this study for the nutritional status of female university students based on BMI, the percentage of low weight was 15.9% and of overweight 11.8%. his prevalence of underweight is considered high when compared to data from the 2008-2009 Survey of Family Budgets (POF) and is consistent with the results of national and international studies conducted with university students23.24. According to
data from the 2008-2009 POF, the prevalence of underweight in teenagers from 16 to 19 years was 2.5% and of overweight was 15.1%; additionally, in adult women aged between 20 and 24, the prevalence was 8.3% for under-weight and 24.2% for overunder-weight. However, when analyzing the evolution of the prevalence of overweight and obesity in relation to socioeconomic level in the period from 1974-75 to 1989 and in 2002-3, Giant et al25 found
that there was an increase in the occurrence of obesity only among poorer women. On the other hand, among higher income individuals, there was a decline in the prevalence of obesity and overweight.
Considering that the population of this study showed higher socio-economic characteristics, it is possible to understand why underweight rates were higher than those of overweight, corroborating the mentioned research. his fact can be attributed to a greater concern with body image among individuals from the most privileged26 economic strata.
In summary, the results of this study and of the mentioned literature related to BMI point out high rates of underweight, which requires speciic attention to the health of these female university students.
In turn, the evaluation of nutritional status based on %BF found a prevalence of 16.8% of obese women. his result reveals that, despite being classiied as eutrophic or underweight by BMI, some students showed high body fat percentage and abdominal adiposity, which may occur, among other reasons, due to the lack of physical activity, which was present in most of the studied female university students (55.9%).
he higher prevalence of obesity evaluated by body fat percentage can also be explained by the fact that BMI does not measure body composition but measures individual’s body ratio27.
In this study, nutritional status was classiied by means of three anthro-pometric measurements, BMI %BF and WC, because they are measures that complement each other. BMI, a quantitative measure, identiies body proportion, %BF, a qualitative measure, identiies body composition, and WC, a qualitative measure, identiies body fat distribution.
he results of food consumption are in accordance with the recom-mendations set out by international organizations of the area14, which states
due to the extreme values of energy consumption found (minimum of 331 kcal and maximum of 13,337 kcal). In view of these values, it is important to note that the initial context of the research was to identify abnormal eating behaviors, with the outcome of symptoms of anorexia and bulimia in students, so these results are of major relevance to the research, as they may indicate the presence of such practices.
When energy consumption was evaluated according to the RDA rec-ommendations16 (2,200 kcal/day), it was observed that 79% of the students
obtained less than the recommended consumption, which reinforces cau-tion regarding deiciencies in the diet.
It should be noted, however, that energy consumption was the only variable associated with nutritional status according to BMI, showing an inverse association, in which underweight was higher in the group with energy consumption equal to or greater than 2,200 kcal, while obesity was more present in the group that consumed less than 2,200 kcal. It is suggested that overweight students sought to reduce their food intake due to their condition of obesity, while underweight students were not concerned with food amount or composition, resulting in higher energy consumption.
Among the three main meals of the day, the breakfast showed the highest rate of omission. his is a fact that deserves attention, because it can compromise students’ health, since skipping breakfast metabolically implies undergoing a period of fasting of more than twelve hours, in gen-eral, during which the body does not receive nutrients. hus, breakfast is recognized as the most important meal of the day due to its role in the health context and in the understanding of human physiology28.
Some studies have investigated the omission of this meal among teenagers and young adults, such as that of Aguilar et al.29, which found
that omission of breakfast was observed in 35.4% of schoolchildren in Florianópolis.
he present study is limited by the fact that sample calculations were performed for another outcome (abnormal eating behaviors) and for the study of prevalence and not for association analysis. However, the sample size was estimated to assess nutritional status. Considering a conidence of 95%, a sampling error of 5% and a prevalence of outcome of 15.9% (prev-alence of underweight observed in the sample), the number of individuals being investigated would be 169 students, a value contemplated by the present study. In addition, the study power was also evaluated in order to test the associations with overweight; considering a power of 80%, a level of conidence 95% and the n of each category of the independent variables, this study could detect diferences between 18.2 and 25.3% among exposed groups when compared to unexposed groups.
higher educational level, may underestimate food consumption, relative to what would be expected. However, this method has advantages, such as the recent recall of consumption, meaning that, due to the proximity of recall, the respondent tends to remember more easily and provide less change in feeding behavior compared to other methods30.
And inally, another limitation refers to the use of the RDA to the as-sessment of students’ energy intake. Because the RDA meets the nutritional needs of almost all (97 to 98%) healthy individuals in a particular group of same sex and stage of life, its use in this study may have overestimated the energy needs of the students.
It is suggested that further studies should be conducted, using new variables, such as students’ concern about health, use of alcohol and tobac-co, and comparing changes students undergo when entering universities, with the evaluation of not only entrant university students but also senior students, in order to know the contribution that the university experience has on students’ health.
CONCLUSION
he results found in this study allow us to conclude that the female uni-versity students studied had mostly high socioeconomic condition and showed high prevalence of underweight and physical activity. he results of food consumption have appropriate values, but with important variations between minimum and maximum values.
It highlights the need to implement health education activities, focus-ing especially on body satisfaction, whose attention should be given on the results identiied in this study. Students need to know the principles of healthy eating and to be motivated to practice them and thus be ready to make appropriate nutrition and health choices in their day to day life. his study contributes to the socioeconomic framework and nutrition knowl-edge on university students, which, besides ensuring the internal validity of data, can also relect the reality of other places in the country. Such knowledge can be important to implement educational health measures and to provide more efective energy supply at universities.
REFERENCES
1. Almeida LS, Soares AP, Guisande MA, Paisana J. Rendimento acadêmico no ensino
superior: estudo com alunos do 1º ano. RGPPE 2007;14(1):1138-63.
2. Petribú MMV, Cabral PC, Arruda IKG. Estado nutricional, consumo alimentar e
risco cardiovascular: um estudo em universitários. Rev Nutr 2009;22(6):837-46.
3. Madureira AS, Corseuil HX, Pelegrini A, Petroski EL. Associação entre estágios
de mudança de comportamento relacionados à atividade física e estado nutricional em universitários. Cad Saúde Pública 2009;25(10):2139-46.
4. Vieira VCR, Priore SR, Ribeiro SMR, Franceschini SCC, Almeida LP. Peril
5. Hedley AA, Ogden CL, Johnson CL, Carroll MD, Curtin LR, Flegal KM. Prevalence of overweight and obesity among US children, adolescents, and adults, 1999-2002. JAMA 2004;291(23):2847-50.
6. Monteiro CA, Conde WL, Popkin BM. Income-speciic trends in obesity in Brazil:
1975-2003. Am J Public Health 2007;97(10):1808-12.
7. Instituto Brasileiro de Geograia e Estatística. Pesquisa de Orçamentos Familiares 2008-2009: antropometria e estado nutricional de crianças, adolescentes e adultos no Brasil. Rio de Janeiro: Instituto Brasileiro de Geograia e Estatística; 2010.
8. Campagna VN, Souza ASL. Corpo e imagem corporal no inicio da adolescência
feminina. Bol Psicol 2006;56(124):9-35.
9. Alves HJ, Boog MCF. Comportamento alimentar em moradia estudantil: um espaço
para promoção da saúde. Rev Saúde Pública 2007;41(2):197-204.
10. Costa LCF, Vasconcelos FAG, Peres KG. Inluence of biological, social and
psycho-logical factors on abnormal eating attitudes among female university students in Brazil. J Health Popul Nutr 2010;28(2):173-81.
11. Souza FGM, Martins MCR, Monteiro FCC, Menezes Neto GC, Ribeiro IB. Anorexia
e bulimia nervosa em alunas da Faculdade de Medicina da Universidade Federal do Ceará. Rev Psiquiatr Clín 2002;29(4):172-80.
12. World Health Organization. Physical status: use and interpretation of
anthropom-etry. Genova: WHO; 1995.
13. Brasil. Ministério da Saúde. Registro fotográico para inquéritos dietéticos: uten-sílios e porções. Instituto Nacional de Alimentação e Nutrição. Goiânia, 1996.
14. Food and Nutrition Board (FNB), Institute of Medicine (IOM). Dietary reference
intakes for energy, carbohydrate, iber, fat, fatty acids, cholesterol, protein and amino acids. Washington: National Academy Press; 2002.
15. National Research Council (NRC). Recommended Dietary Allowances. 10ª Ed.
Washington: National Academy Press; 1989.
16. Lohman TG, Roche AF, Martorell R. Anthropometric Standardization Reference
Manual. Champaign, Illinois: Human Kinetics Books; 1991.
17. World Health Organization. Obesity: preventing and managing the global epidemic. Report of a WHO Consultation on Obesity. Geneva: WHO/NUT/NCD; 1998. 18. Han TS, van Leer EM, Seidell JC, Lean ME. Waist circumference action levels in the
identiication of cardiovascular disease risk factors: prevalence study in a random sample. BMJ 1995;311:1401-5.
19. Durnin JVGA, Womersley J. Body fat assessed from total body density and its
estimation from skinfold thickness: measurements on 481 men and women aged from 16 to 72 years. Br J Nutr 1974;32:77-97.
20. Lohman TG. Advances in body composition assessment. Champaign, Illinois:
Human Kinetics Publishers; 1992.
21. Braga MM, Peixoto MCL, Bogutchi TF. Tendências da demanda pelo ensino
supe-rior: estudo de caso da UFMG. Cad Pesqui 2001;113:129-52.
22. Bezerra TOC, Gurgel C. A política pública de cotas em universidades, desempenho
acadêmico e inclusão social. SBIJ 2011;9:1-22.
23. Alvarenga MS, Philippi ST, Lourenço BH, Sato PM, Scagliusi FB. Insatisfação com a imagem corporal em universitárias brasileiras. J Bras Psiquiatr 2010;59(1):44-51.
24. Arechabaleta G, Castillo H; Herrera H; Pacheco M. Composición corporal en uma
población de Estudiantes universitários. Rev Fac Med 2002;25(2):209-16.
25. Gigante DP, Moura EC, Sardinha LMV. Prevalência de excesso de peso e obesidade
e fatores associados, Brasil, 2006. Rev Saúde Pública 2009;43(Supl 2):83-9. 26. Alvarenga MS, Philippi ST, Lourenço BH, Sato PM, Scagliusi FB. Insatisfação com
a imagem corporal em universitárias brasileiras. J Bras Psiquiatr. 2010; 59(1): 44-51.
27. Acuña K, Cruz T. Avaliação do estado nutricional de adultos e idosos e situação
nutricional da população brasileira. Arq Bras Endocrinol Metab 2004;48(3):245-61. 28. Barbosa L. Feijão com arroz e arroz com feijão: o Brasil no prato dos brasileiros.
Corresponding author
Larissa da Cunha Feio Costa Programa de Pós-Graduação em Nutrição
Centro de Ciências da Saúde – Universidade Federal de Santa Catarina Campus Universitário Trindade Cep 88040-970 Florianópolis, SC, Brasil.
E-mail: [email protected]
29. Araújo DSA, Blank N, Oliveira WF. Atividade física e hábitos alimentares de
adolescents de três escolas públicas de Florianópolis/SC. Rev Bras Cineantropom Desempenho Hum 2009;11(4):428-34.
30. Costa AGV, Priore SE, Sabarense CM, Franceschini SCC. Questionário de