Ilana Nogueira BezerraI
Rosely SichieriII
I Programa de Pós-Graduação em Saúde Coletiva. Instituto de Medicina Social (IMS). Universidade do Estado do Rio de Janeiro (UERJ). Rio de Janeiro, RJ, Brasil
II Departamento de Epidemiologia. IMS-UERJ. Rio de Janeiro, RJ, Brasil
Correspondence: Ilana Nogueira Bezerra R. São Francisco Xavier 524 Pavilhão João Lyra Filho, 7º andar Bloco E, sala E7002 – Maracanã 20550-900 Rio de Janeiro, RJ, Brasil E-mail: [email protected] Received: 3/25/2009
Revised: 9/15/2009 Approved: 9/29/2009
Characteristics and spending on
out-of-home eating in Brazil
ABSTRACT
OBJECTIVE: To analyze the characteristics of out-of-home eating and spending on such consumption.
METHODS: A complex sample of 48,470 Brazilian households, selected from the 2002-2003 Household Budget Survey (HBS) was analyzed. Out-of-home eating was defi ned as the purchase of at least one type of food for consumption out of the home during seven days. Frequencies of out-of-home eating were estimated according to age, sex, level of education, monthly per capita household income, number of residents per household, Brazilian regions, situation of household (urban/rural) and capital/other city. A total of nine groups of foods were studied: alcoholic beverages, soft drinks, cookies, fruits, sweets, milk and dairy products, fast foods, sit-down meals and deep-fried snacks.
RESULTS: Frequency of out-of-home eating was 35%, being higher in the Southeast region (38.8%) and lower in the North region (28.1%) of Brazil. Frequency was higher in individuals aged between 20 and 40 years (42%), males (39% vs. 31%), with higher income (52%) and educational levels (61%). Foods most frequently consumed out of the home were as follows: soft drinks (12%), sit-down meals (11.5%), sweets (9.5%), deep-fried snacks (9.2%) and fast foods (7.2%). Consumption of food groups increased linearly with income, except for fruits and cookies. Values of weekly mean spending were lower for cookies (R$ 1.79 or US$ 0.54) and sweets (R$ 2.02 or US$ 0.67) and higher for sit-down meals (R$ 21.56 or US$ 6.53).
CONCLUSIONS: Out-of-home eating is frequent in all Brazilian regions. Public policies must incorporate this dimension when proposing healthy eating strategies.
Changes in food consumption and the increase in physical inactivity have been associated with the growth in prevalence of overweight, obesity and other non-communicable chronic diseases, with an important impact on the health of the population.10
One of the factors related to diet, which seems to have a considerable infl uence on the increase of these preva-lences is out-of-home eating.10,18,20 Foods consumed out
of the home are recognizably less healthy than those consumed at home; they have higher energy density; higher sugar, salt and fat content, especially saturated fat; and they are, in general, poor in fi bers, calcium and iron.6-8
In the United States, in 2004, 46% of spending on food was related to out-of-home eating.16 In Brazil, data
gathered from the Household Budget Survey (HBS), performed in 2002-2003, revealed that this spending totaled 24%.a
HBSs are important sources of data on food spending and have been used to obtain estimates of family food consumption.15 Although these surveys do not
inves-tigate food consumption by individuals, they provide information about the purchase of foods consumed in and out of the home.9
The last Brazilian HBS, performed in 2002-2003, included the types of food purchased for consumption out of the home for the fi rst time. There are no other data in Brazil that provide detailed information about the foods consumed by the Brazilian population, parti-cularly out of the home.
The present study aimed to analyze the characte-ristics of out-of-home eating and spending on such consumption.
METHODS
Data from the 2002-2003 HBS, conducted by the
Instituto Brasileiro de Geografi a e Estatística (IBGE – Brazilian Institute of Geography and Statistics) between July 2002 and June 2003 and obtained from interviews in a sample of 48,470 households, were used.
Sampling plan and other methodological details were described in a previous publication.a The sample
is representative of the urban and rural population, Brazilian regions and different socioeconomic levels. In the 2002-2003 HBS, 183,333 individuals were inter-viewed. In the present study, only those aged more than ten years (N=146,525), considered by the survey as
INTRODUCTION
possibly contributing to the household budget (income, expenses or purchases), were included.
Information about out-of-home eating was obtained by applying a questionnaire of individual expenses with daily records describing each product purchased, the amount paid and the place of purchase, for seven conse-cutive days. Individuals had the choice of grouping several purchases of the same item in one single record, including the total amount spent in the week. Out-of-home eating was defi ned as the purchase of at least one food consumed out of the home, aimed at the same unit of consumption of the individual who purchased the food during the week of data collection.
Selection of food groups was based on the Brazilian directives on food and nutrition, in accordance with the recommendations from the Guia Alimentar para a População Brasileira (Food Guide for the Brazilian Population).b Food items mentioned by interviewees
were grouped into alcoholic beverages, soft drinks, cookies, fruits, sweets, milk and dairy products, fast foods, deep-fried and baked snacks and sit-down meals to describe the consumption of foods out of the home. The most representative characteristics of the foods consumed were considered in the classifi cation. Rice and beans, for example, were categorized as sit-down meal, whereas sandwiches and hamburgers fell into the fast food group.
Alcoholic beverages, soft drinks, cookies, sweets, fast foods and deep-fried and baked snacks were selected as possible markers of “unhealthy” food consump-tion. All sweet and salty crackers, with fi lling and wafer, were included in the group of cookies. Drops, bonbons, chocolate, ice-cream, milk shake and party sweets, among others, fell into the group of sweets. The group of fast foods comprises all types of sandwiches, hamburgers, cheeseburgers, pizza, French fries and others. Coxinha, risole and pastel (typical Brazilian snacks, which are usually fried and include a variety of fi llings, such as meat, cheese and/or vegetables), among others, were in the group of deep-fried and baked snacks.
There are specifi c recommendations from the Brazilian Ministry of Health for the group of fruits and the group of milk and dairy products, included as possible markers of a healthy diet. Sit-down meals were also considered as a food group, once meals are traditionally based on rice and beans in Brazil and this dietary pattern has been associated with low risk of overweight and obesity.14
The group of sit-down meals included a la carte lunch and dinner, self-service meals and school meals.
The number of individuals, who reported purchasing at least one type of food consumed out of the home for one week, was divided by the total number of indivi-duals so the frequency of out-of-home eating could be calculated. Estimates of frequencies of out-of-home eating are shown according to sex, age, level of educa-tion, per capita monthly household income, number of residents in the household, Brazilian regions, situation of household and its location (capital or other city). Age was stratifi ed into the following six age groups: ten to 19 years; 20 to 29 years; 30 to 39 years; 40 to 49 years; 50 to 59 years and 60 years or older. Level of education was divided into four groups: without educa-tion, elementary school, high-school, and incomplete and complete undergraduate and postgraduate studies. Income was calculated as the ratio between all monthly household incomes (monetary and non-monetary) and the total number of individuals in the household. Income strata considered were as follows: up to ½ minimum wage, between ½ and two minimum wages, between two and fi ve minimum wages and more than
fi ve minimum wages. The value of salary considered referred to the value of one minimum wage on January 15th 2003 (R$ 200.00 or US$ 60.00). The median of
number of residents per household was equal to four. This number was used to stratify this variable into the following two groups: households with fewer than four residents and households with more than four residents. The same stratifi cation, considered in the HBS as urban or rural household, was used as the “situation of household” variable.
Associations between out-of-home eating and the sex, number of residents per household, situation of household (urban or rural) and location of household (capital or other city) variables were tested using chi-square test. Chi-chi-square test used was that with Rao-Scott second order correction, a version with design effect correction for Pearson chi-square statistics.13
Associations were calculated using logistic regression for the variables with more than two levels of classifi -cation (age, level of edu-cation and income). Age, level of education and income were included in the model as independent variables and out-of-home eating or not was included as dependent variable. The quadratic relationship found between out-of-home eating and age was calculated with the inclusion of the linear and quadratic terms of age as independent variables in the logistic regression.
The frequencies of consumption of food groups were also estimated, according to Brazilian region, age, sex, income and situation of household.
All estimates were calculated using the Statistical Analysis System (SAS) software, version 9.1. Given the complexity of the sampling design, the survey procedure was used, as it incorporates HBS expansion
factors into each household and takes into consideration both levels of sample selection.
RESULTS
The prevalence of out-of-home eating was 35.1%. The Southeast region showed the highest frequency of out-of-home eating, followed by the South and Northeast regions (38.8%; 34.8% and 32.4%, respectively), whereas the Central-West and North regions showed the lowest frequencies (30.9% and 28.1%, respectively). The state with the highest frequency was Rio de Janeiro (46.7%), followed by the Federal District (45.1%), while the states with the lowest frequencies were Mato-Grosso (20.9%) and Rio Grande do Norte (19.3%).
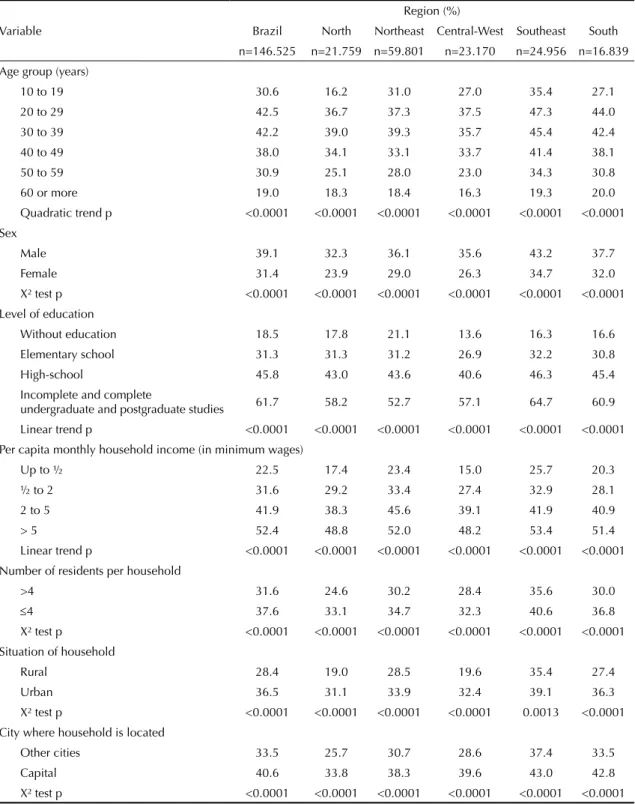
The highest frequency of out-of-home eating occurred in the 20-to-40-year age group. In all regions, males showed a higher frequency of out-of-home eating than females. This frequency increased linearly with the increase in level of education and per capita monthly household income. As regards the size of family, fami-lies with fewer than four residents (median) showed higher percentages of out-of-home eating. The urban area, when compared to the rural area, showed a higher frequency of out-of-home eating, as well as capitals, when compared to other cities (Table 1).
Mean per capita monthly household income among individuals who eat out was R$ 673.30 (US$ 202.00) for Brazil as a whole. The Northeast and North regions showed the lowest means (R$ 375.20/US$ 112.56 and R$ 412.10/US$ 123.63, respectively), whereas the means in the Central-West, South and Southeast regions were R$ 707.50 (US$ 212.25); R$ 781.50 (US$ 234.45) and R$ 829.80 (US$ 248.94), respectively.
Table 2 shows the frequency of consumption of food groups in Brazil and in each region. The highest frequency of out-of-home eating in this country concerned the group of soft drinks, varying from 9% in the Northeast region to 14% in the Southeast region. In the South region, the most frequent item was sit-down meals, while, in the Northeast region, it was sweets. In contrast, the group with the lowest frequency of out-of-home eating in all regions was fruits.
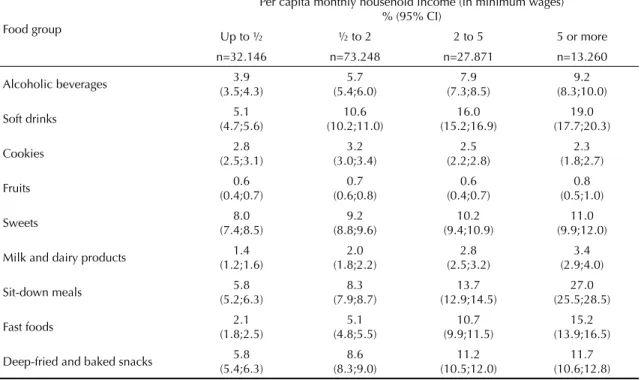
linear growth with the increase in income were cookies and fruits. In the group of cookies, individuals with lower income (up to two minimum wages) showed the highest frequencies of consumption. The group of fruits showed frequencies of consumption practically stable among income strata (Table 3).
Mean total weekly spending on out-of-home eating in Brazil was R$ 14.37 (US$ 4.31). Spending was lower for the group of cookies (R$ 1.79 or US$ 0.54) and sweets (R$ 2.02 or US$ 0.61) and higher for the group of sit-down meals (R$ 21.56 or US$ 6.47), alcoholic beverages (R$ 12.14 or US$ 3.64) and fast foods (R$
Table 1. Frequency of out-of-home eating, reported for one week, according to demographic and socioeconomic conditions
in Brazil and its regions. Brazil, 2002-2003.
Variable
Region (%)
Brazil North Northeast Central-West Southeast South
n=146.525 n=21.759 n=59.801 n=23.170 n=24.956 n=16.839
Age group (years)
10 to 19 30.6 16.2 31.0 27.0 35.4 27.1
20 to 29 42.5 36.7 37.3 37.5 47.3 44.0
30 to 39 42.2 39.0 39.3 35.7 45.4 42.4
40 to 49 38.0 34.1 33.1 33.7 41.4 38.1
50 to 59 30.9 25.1 28.0 23.0 34.3 30.8
60 or more 19.0 18.3 18.4 16.3 19.3 20.0
Quadratic trend p <0.0001 <0.0001 <0.0001 <0.0001 <0.0001 <0.0001
Sex
Male 39.1 32.3 36.1 35.6 43.2 37.7
Female 31.4 23.9 29.0 26.3 34.7 32.0
X² test p <0.0001 <0.0001 <0.0001 <0.0001 <0.0001 <0.0001
Level of education
Without education 18.5 17.8 21.1 13.6 16.3 16.6
Elementary school 31.3 31.3 31.2 26.9 32.2 30.8
High-school 45.8 43.0 43.6 40.6 46.3 45.4
Incomplete and complete
undergraduate and postgraduate studies 61.7 58.2 52.7 57.1 64.7 60.9
Linear trend p <0.0001 <0.0001 <0.0001 <0.0001 <0.0001 <0.0001
Per capita monthly household income (in minimum wages)
Up to ½ 22.5 17.4 23.4 15.0 25.7 20.3
½ to 2 31.6 29.2 33.4 27.4 32.9 28.1
2 to 5 41.9 38.3 45.6 39.1 41.9 40.9
> 5 52.4 48.8 52.0 48.2 53.4 51.4
Linear trend p <0.0001 <0.0001 <0.0001 <0.0001 <0.0001 <0.0001
Number of residents per household
>4 31.6 24.6 30.2 28.4 35.6 30.0
≤4 37.6 33.1 34.7 32.3 40.6 36.8
X² test p <0.0001 <0.0001 <0.0001 <0.0001 <0.0001 <0.0001
Situation of household
Rural 28.4 19.0 28.5 19.6 35.4 27.4
Urban 36.5 31.1 33.9 32.4 39.1 36.3
X² test p <0.0001 <0.0001 <0.0001 <0.0001 0.0013 <0.0001
City where household is located
Other cities 33.5 25.7 30.7 28.6 37.4 33.5
Capital 40.6 33.8 38.3 39.6 43.0 42.8
7.86 or US$ 2.36). Mean spending on purchase of fruits, deep-fried and baked snacks, milk and dairy products and soft drinks were R$ 2.67 (US$ 0.80); R$ 2.86 (US$ 0.86); R$ 3.08 (US$ 0.92) and R$ 3.17 (US$ 0.95), respectively.
In terms of sex, men showed higher frequency of consumption of the majority of foods, with their consumption of alcoholic beverages being ten times higher than that of women. In contrast, women showed higher prevalences of consumption of cookies, fruits and sweets (Table 4).
Participation of fruits in out-of-home eating was higher in the rural area than in the urban area. However, the proportion of individuals who eat out in terms of other food groups was higher in the urban area than in the rural one (Table 4). In the urban area, the group of soft drinks showed the highest frequency of consumption, whereas, in the rural area, sit-down meals showed the highest frequency. However, a great number of these meals occur at school (48.7%). While 46.5% of meals are in pay-per-weight restaurants in the urban area, this frequency is 19.6% in the rural area.
Different patterns of consumption of food groups charac-terize the fi ve age groups. Frequency of consumption of soft drinks, fruits, milk and dairy products, fast foods and deep-fried and baked snacks increased until the 30-to-39 year age group, subsequently decreasing. For alcoholic beverages and sit-down meals, this increase extended until the 40-to-49 year age group. A different
distribution was found for cookies and sweets, where there was a reduction in the frequencies of consumption with the increase in age (Table 5).
DISCUSSION
The characteristics of individuals who reported eating out corroborate fi ndings from other studies.3,12 Young
adults, males and those with higher level of education showed the highest frequency of out-of-home eating. It was also possible to identify higher frequencies among individuals living in households located in the urban area, in the capital and including fewer than four residents. These aspects, together with the level of education, are important markers of individuals’ socioeconomic level, confi rming the importance of income as a determinant of food consumption. Beydoun et al3 (2008), while studying spending on out-of-home
eating in the United States, found a linear association between spending and per capita household income and a reduction in the quality of diet of Americans with greater spending on out-of-home eating.
Regional differences were found in terms of per capita monthly household income of individuals who eat out. Income in the North and Northeast regions is half of the income of other regions. However, the frequencies of out-of-home eating among individuals with lower income in the North and Northeast regions were higher than the frequencies of those with lower income in the other regions. One possible explanation for this apparently contradictory fi nding is that the possible
Table 2. Frequency of consumption of food groups out of the home in Brazil and its regions, reported for one week. Brazil,
2002-2003.
Food group
Region % (95% IC)
Brazil North Northeast Central-west Southeast South
n=146.525 n=21.759 n=59.801 n=23.170 n=24.956 n=16.839
Alcoholic beverages 6.4
(6.1;6.6) 5.7 (5.3;6.2) 6.6 (6.3;6.9) 5.1 (4.7;5.4) 6.8 (6.3;7.2) 5.7 (5.3;6.1)
Soft drinks 12.0
(11.7;12.4) 11.0 (10.3;11.6) 9.2 (8.8;9.6) 11.2 (10.7;11.8) 14.1 (13.4;14.8) 12.0 (11.4;12.7)
Cookies 2.8
(2.7;3.0) 2.7 (2.4;3.1) 3.4 (3.2;3.7) 2.3 (2.0;2.6) 2.9 (2.6;3.1) 2.1 (1.8;2.3) Fruits 0.7 (0.6;0.7) 0.9 (0.7;1.2) 0.9 (0.8;1.1) 0.3 (0.2;0.4) 0.6 (0.4;0.7) 0.4 (0.3;0.5)
Sweets 9.5
(9.1;9.8) 7.2 (6.7;7.8) 10.3 (9.9;10.7) 6.1 (5.6;6.5) 10.2 (9.6;10.8) 8.4 (7.8;8.9)
Milk and dairy products 2.3
(2.1;2.4) 2.1 (1.8;2.4) 2.3 (2.1;2.5) 1.6 (1.4;1.9) 2.6 (2.3;2.9) 1.6 (1.3;1.8)
Sit-down meals 11.5
(11.1;11.8) 7.0 (6.4;7.5) 8.6 (8.3;9.0) 10.7 (10.1;11.4) 13.3 (12.6;14.0) 14.0 (13.3;14.6)
Fast foods 7.2
(6.9;7.5) 4.1 (3.7;4.5) 5.1 (4.8;5.4) 5.2 (4.8;5.6) 9.2 (8.6;9.8) 7.8 (7.3;8.3)
Deep-fried and baked snacks 9.2
consumption of certain very low cost items, such as sweets, is higher in the Northeast region.
In the analysis of types of food consumed out of the home, the group of soft drinks played an important
role in all regions of Brazil. In a study performed in Belgium with a representative sample of the popula-tion (N=3,245 individuals aged more than 15 years), Vandevijvere et al17 (2009) also found soft drinks as the
group most frequently consumed out of the home. Ayala
Table 3. Frequency of consumption of food groups out of the home, reported for one week, according to per capita monthly
household income. Brazil, 2002-2003.
Food group
Per capita monthly household income (in minimum wages) % (95% CI)
Up to ½ ½ to 2 2 to 5 5 or more
n=32.146 n=73.248 n=27.871 n=13.260
Alcoholic beverages 3.9
(3.5;4.3) 5.7 (5.4;6.0) 7.9 (7.3;8.5) 9.2 (8.3;10.0)
Soft drinks 5.1
(4.7;5.6) 10.6 (10.2;11.0) 16.0 (15.2;16.9) 19.0 (17.7;20.3) Cookies 2.8 (2.5;3.1) 3.2 (3.0;3.4) 2.5 (2.2;2.8) 2.3 (1.8;2.7) Fruits 0.6 (0.4;0.7) 0.7 (0.6;0.8) 0.6 (0.4;0.7) 0.8 (0.5;1.0) Sweets 8.0 (7.4;8.5) 9.2 (8.8;9.6) 10.2 (9.4;10.9) 11.0 (9.9;12.0)
Milk and dairy products 1.4
(1.2;1.6) 2.0 (1.8;2.2) 2.8 (2.5;3.2) 3.4 (2.9;4.0)
Sit-down meals 5.8
(5.2;6.3) 8.3 (7.9;8.7) 13.7 (12.9;14.5) 27.0 (25.5;28.5)
Fast foods 2.1
(1.8;2.5) 5.1 (4.8;5.5) 10.7 (9.9;11.5) 15.2 (13.9;16.5)
Deep-fried and baked snacks 5.8
(5.4;6.3) 8.6 (8.3;9.0) 11.2 (10.5;12.0) 11.7 (10.6;12.8)
Table 4. Frequency of consumption of food groups out of the home, reported for one week, according to sex and situation of
household. Brazil, 2002-2003.
Food group
Sex Situation of household
Male Female Urban Rural
n=71.501 n=75.024 n=113.005 n=33.520
Alcoholic beverages 11.2
(10.8;11.7) 1.7 (1.6;1.9) 6.4 (6.1;6.7) 6.1 (5.8;6.5)
Soft drinks 14.3
(13.8;14.8) 9.9 (9.5;10.3) 12.7 (12.3;13.2) 8.4 (8.0;8.9) Cookies 2.5 (2.3;2.7) 3.2 (3.0;3.4) 2.9 (2.7;3.0) 2.8 (2.6;3.1) Fruits 0.6 (0.5;0.6) 0.7 (0.6;0.8) 0.6 (0.5;0.7) 0.9 (0.7;1.0) Sweets 7.7 (7.3;8.1) 11.1 (10.7;11.5) 9.7 (9.3;10.1) 8.2 (7.7;8.7)
Milk and dairy products 2.5
(2.3;2.7) 2.0 (1.8;2.2) 2.3 (2.2;2.5) 1.9 (1.7;2.1)
Sit-down meals 13.2
(12.8;13.7) 9.8 (9.4;10.2) 11.9 (11.5;12.3) 9.3 (8.7;9.8)
Fast foods 8.0
(7.6;8.4) 6.4 (6.1;6.8) 8.0 (7.6;8.4) 3.2 (2.9;3.5)
Deep-fried and baked snacks 9.4
et al1 (2008) indicated that children from American
families who eat out (in restaurants or at relatives’ and friends’ homes) at least once a week consume more soft drinks and sweetened drinks. In Brazil, this aspect raises concern if evaluated concomitantly with the avai-lability of soft drinks at home, once this consumption increased 400% in the metropolitan areas of this country between 1974 and 2003.9 Furthermore, consumption
of soft drinks out of the home, according to income strata, follows the availability of this food at home;9 in
both cases, consumption increases substantially and continually with income.
The higher frequency of consumption of sweets in the Northeast region is also concerning, once the availa-bility of sugar at home in Brazil represents 13.7% of calories from carbohydrates.9 This value is higher than
the nutritional recommendations of 10% proposed by the World Health Organization (WHO).19
Although sit-down meals were analyzed as a possible marker of a healthy diet,14 their frequencies must be
assessed with caution. The lack of details about the types of food present in these meals, as well as the amount consumed, limits the conclusions on this group’s positive contribution. In Brazil, consumption of sit-down meals out of the home was negatively asso-ciated with overweight and obesity in women; however, it was positively associated in men.2
Other negative characteristics of out-of-home eating in Brazil were the low frequency of consumption of fruits
and the relatively high frequency of consumption of deep-fried and baked snacks. These snacks are usually fried, thus becoming sources of saturated and partially hydrogenated (trans) fat.5
One of the factors that can contribute to the consump-tion of “less healthy” foods is their low cost. Foods with high energy density are those that cost less, whereas low energy density and high nutrient density foods are more expensive and show greater variation in price.11
This was confi rmed in the present study, once mean spending on sweets was one of the lowest, this food group being the one most frequently consumed among individuals with lower income. Moreover, in Brazil, the decrease in price of fruits and vegetables is the main factor of inclusion of such foods in the diet, especially among those with lower income.4
Although this study used data from a representa-tive sample of the Brazilian population, the HBS is designed to collect data from household budgets. In addition, even if this survey represents the initial chain of consumption, estimates of consumption from the purchase of foods may not be adequate. This occurs mostly for foods purchased for out-of-home eating, once the type of food and amount consumed are not suffi ciently detailed in budget surveys.
In conclusion, the data shown here are the fi rst estimate of out-of-home eating in Brazil. This consumption was higher among young adults, males and those with higher income, with soft drinks and sit-down meals being the
Table 5. Frequency of consumption of food groups out of the home, reported for one week, according to age groups. Brazil,
2002-2003.
Food groups
Age groups % (95% CI)
10 to 19 20 to 29 30 to 39 40 to 49 50 to 59 ≥60
n=38.509 n=31.905 n=26.335 n=20.674 n=13.819 n=15.283
Alcoholic beverages 1.9
(1.7;2.1) 8.7 (8.1;9.3) 9.1 (8.5;9.8) 8.7 (8.0;9.3) 6.7 (6.0;7.5) 3.9 (3.4;4.4)
Soft drinks 11.3
(10.6;11.9) 16.5 (15.7;17.3) 14.4 (13.5;15.2) 11.4 (10.6;12.2) 8.7 (7.9;9.5) 4.6 (4.1;5.1) Cookies 4.6 (4.3;5.0) 3.4 (3.0;3.7) 2.6 (2.3;2.9) 1.7 (1.4;1.9) 1.5 (1.2;1.8) 0.8 (0.6;1.0) Fruits 0.7 (0.6;0.8) 0.9 (0.7;1.1) 0.7 (0.6;0.9) 0.5 (0.4;0.7) 0.4 (0.3;0.6) 0.4 (0.2;0.5) Sweets 13.4 (12.7;14.1) 10.2 (9.6;10.8) 10.8 (10.0;11.5) 7.4 (6.7;8.1) 5.4 (4.7;6.1) 2.8 (2.3;3.2)
Milk and dairy products 1.5
(1.3;1.7) 3.0 (2.6;3.3) 2.9 (2.5;3.2) 2.7 (2.2;3.1) 2.2 (1.8;2.7) 1.2 (0.9;1.4)
Sit-down meals 7.5
(7.0;8.0) 13.3 (12.6;14.0) 15.7 (15.0;16.6) 14.5 (13.7;15.4) 10.8 (9.9;11.7) 6.4 (5.7;7.1)
Fast foods 6.5
(5.9;7.0) 10.5 (9.8;11.3) 8.6 (7.9;9.3) 7.0 (6.3;7.7) 5.0 (4.2;5.7) 2.3 (1.8;2.7)
Deep-fried and baked snacks 9.6
food groups most frequently consumed when eating out, whereas fruits showed the lowest frequencies of consumption. Income plays an important role to determine food consumption out of the home, because the frequency of out-of-home eating increases linearly with the increase in income and may refl ect higher spending on less healthy and cheaper foods in lower income strata. Spending also plays an important role in out-of-home eating, once spending on sit-down meals were 12 times higher than spending on cookies and
1. Ayala GX, Rogers M, Arredondo EM, Campbell NR, Baquero B, Duerksen SC, et al. Away-from-home food intake and risk for obesity: examining the infl uence of
context. Obesity (Silver Spring). 2008;16(5):1002-8.
DOI:10.1038/oby.2008.34
2. Bezerra IN, Sichieri R. Eating out of home and obesity:
a Brazilian nationwide survey. Public Health Nutr.
2009;12(11):2037-43.
3. Beydoun MA, Powell LM, Wang Y. Reduced away-from-home food expenditure and better nutrition knowledge and belief can improve quality of
dietary intake among US adults. Public Health Nutr.
2009;12(3):369-81.
4. Claro RM, Carmo HCE, Machado FMS, Monteiro CA. Renda, preço dos alimentos e participação
de frutas e hortaliças na dieta. Rev Saude Publica.
2007;41(4):557-64. DOI:10.1590/S0034-89102007000400009
5. Guallar-Castillón P, Rodríguez-Artalejo F, Fornés NS, Banegas JR, Etxezarreta PA, Ardanaz E, et al. Intake of fried foods is associated with obesity in the cohort of Spanish adults from the European Prospective
Investigation into Cancer and Nutrition. Am J Clin
Nutr. 2007;86(1):198-205.
6. Guthrie JF, Lin BH, Frazao E. Role of food prepared away from home in the American diet, 1977-78 versus
1994-96: changes and consequences. J Nutr Educ
Behav. 2002;34(3):140-50. DOI:10.1016/S1499-4046(06)60083-3
7. Kant AK, Graubard BI. Eating out in America,
1987-2000: trends and nutritional correlates. Prev Med.
2004;38(2):243-9. DOI:10.1016/j.ypmed.2003.10.004
8. Kearney JM, Hulshof KF, Gibney MJ. Eating patterns--temporal distribution, converging and diverging foods, meals eaten inside and outside of the
home--implications for developing FBDG. Public Health Nutr.
2001;4(2B):693-8. DOI:10.1079/PHN2001156
9. Levy-Costa RB, Sichieri R, Pontes NS, Monteiro CA. Disponibilidade domiciliar de alimentos no Brasil:
distribuição e evolução (1974-2003). Rev Saude
Publica. 2005;39(4):530-40. DOI:10.1590/S0034-89102005000400003
10. Mendonça CP, Anjos LA. Aspectos das práticas alimentares e da atividade física como determinantes
do crescimento do sobrepeso/obesidade no Brasil. Cad
Saude Publica. 2004;20(3):698-709. DOI:10.1590/ S0102-311X2004000300006
11. Monsivais P, Drewnowski A. The rising cost
of low-energy-density foods. J Am Diet
Assoc. 2007;107(12):2071-6. DOI:10.1016/j. jada.2007.09.009
12. Orfanos P, Naska A, Trichopoulos D, Slimani N, Ferrari P, van Bakel M, et al. Eating out of home and its correlates in 10 European countries. The European Prospective Investigation into Cancer and Nutrition
(EPIC) study. Public Health Nutr. 2007;10:1515-25.
DOI:10.1017/S1368980007000171
13. Rao JNK, Scott AJ. On chi-squared tests for multiway contingency tables with cell proportions estimated
from survey data. Ann Stat. 1984;12(1):46-60.
DOI:10.1214/aos/1176346391
14. Sichieri R. Dietary patterns and their associations with
obesity in the Brazilian city of Rio de Janeiro. Obes
Res. 2002;10(1):42-8. DOI:10.1038/oby.2002.6
15. Sichieri R, Pereira RA, Martins A, Vasconcellos A, Trichopoulou A. Rationale, design, and analysis of combined Brazilian household budget survey and food
intake individual data. BMC Public Health. 2008;8:89.
DOI:10.1186/1471-2458-8-89
16. Variyam JN. Do nutrition labels improve dietary
outcomes? Health Econ. 2008;17(6):695-708.
DOI:10.1002/hec.1287
17. Vandevijvere S, Lachat C, Kolsteren P, Van Oyen H. Eating out of home in Belgium: current situation and
policy implications. Br J Nutr. 2009;102(6):921-8.
DOI:10.1017/S0007114509311745
18. World Health Organization. Obesity: preventing and
managing the global epidemic: report of a WHO
consultation on obesity. Geneva; 1998. (WHO/NUT/
NCD/98.1).
19. World Health Organization. Diet, nutrition and
the prevention of chronic diseases. Geneva; 2003.
(Technical report series, 797).
20. Young LR, Nestle M. The contribution of expanding
portion sizes to the US obesity epidemic. Am J
Public Health. 2002;92(2):246-9. DOI:10.2105/ AJPH.92.2.246
REFERÊNCIAS
Article based on the master’s dissertation by Bezerra IN, presented to the Programade Pós-Graduação em Saúde Coletiva do
Instituto de Medicina Social da Universidade do Estado do Rio de Janeiro (Postgraduate Program in Collective Health of the Rio de Janeiro State University Institute of Social Medicine) in 2009.
Bezerra IN was granted a master’s degree scholarship by the Fundação de Amparo à Pesquisa do Estado do Rio de Janeiro
(FAPERJ – State of Rio de Janeiro Research Support Foundation/Process 26/100.79).