Validation of a microsatellite panel for parentage testing of locally adapted
and commercial goats in Brazil
Elizabete Cristina da Silva
1,3, Concepta Margaret McManus
1,2,
Maria Pia Souza Lima Mattos de Paiva Guimarães
4, Aurora M.G. Gouveia
5, Olivardo Facó
6,
Daniel M. Pimentel
7, Alexandre Rodrigues Caetano
1,3and Samuel Rezende Paiva
1,3,81
Pós-graduação em Ciências Animais, Universidade de Brasília, Brasília, DF, Brazil.
2
Departamento de Zootecnia, Universidade Federal do Rio Grande do Sul, Porto Alegre, RS, Brazil.
3Embrapa Recursos Genéticos e Biotecnologia, Brasília, DF, Brazil.
4
Caprileite/Associação dos Criadores de Caprinos e Ovinos de Minas Gerais, Belo Horizonte, MG, Brazil.
5
Escola de Veterinária, Universidade Federal de Minas Gerais, Belo Horizonte, MG, Brazil.
6Embrapa Caprinos e Ovinos, Sobral, CE, Brazil.
7
Faculdade de Agronomia e Medicina Veterinária, Universidade de Brasília, Brasília, DF, Brazil.
8
Embrapa Sede, Secretaria de Relações Internacionais, Brasília, DF, Brazil.
Abstract
Brazilian goats are generally kept in small herds and extensive rearing systems, mainly in the northeastern region of the country. Despite production improvement in recent years, the lack of pedigree control has affected genetic prog-ress. This study aimed to validate a panel of 16 microsatellites for parentage testing in locally adapted and commer-cial goats breeds raised in Brazil, as well as to compare its efficiency with the panel recommended by the Brazilian Ministry of Agriculture, Livestock and Supplies (MAPA) in 2004. The number of alleles and expected heterozygosity (He) per marker ranged from four to 18, and from 0.051 to 0.831, respectively. Using all markers, 100% of parentage cases of the validation dataset were resolved with a strict confidence level of 95%. The 16 microsatellites panel showed adequate exclusion power (99.99%) and identity accuracy (99.99%). Suggestions for improvement of the marker panel endorsed by MAPA are provided.
Key words:parentage errors, animal breeding, animal genetic resources,Capra hircus. Received: July 25, 2013; Accepted: December 3, 2013.
Introduction
Goats are one of the most important livestock species in the world, mostly because of their meat and milk produc-tion. According to IBGE (2010), the Brazilian goat popula-tion was estimated at 9.31 million heads, with 90% of the animals being raised in the northeastern region of the coun-try. In recent years, there have been increases in herd size and productivity (Lopes et al., 2012), but management practices still face many challenges, particularly with pedi-gree record keeping, which is of fundamental importance for adequate operation of production farms and genetic im-provement programs.
Correct pedigree information is essential for perform-ing genetic evaluations, as errors lead to incorrect estimates and low accuracies of estimated breeding values (see Mai-chomoet al., 2008). Pedigree errors of about 10% may lead
to reductions in selection response of two to three percent in dairy cattle (Visscheret al., 2002), while different studies have reported observed pedigree errors of up to 23% in cat-tle in several countries (Christensenet al., 1982; Ronet al., 1996; Banos et al., 2001; Weller et al., 2004; Jiménez-Gameroet al., 2006).
Microsatellite markers have been used extensively for parentage control in different species and are recom-mended by the International Society for Animal Genetics (ISAG) as they are highly abundant and informative, rela-tively inexpensive to use, and generate satisfactory results in tests for paternity exclusion (Luikartet al., 1999; Arruga
et al., 2001; Curi and Lopes, 2002; Carneiroet al., 2007; Glowatzki-Mulliset al., 2007; Bolormaaet al., 2008; Reis
et al., 2008; Carolino et al., 2009; Araújo et al., 2010; Stevanovicet al., 2010; Zhanget al., 2010; Adamovet al., 2011; Saberivandet al., 2011; Visseret al., 2011).
In Brazil, estimated pedigree errors of more than 25% in Gir cattle have been observed (Baronet al., 2002), while in sheep these have reached 15.5% (Barnettet al., 1999).
Due to this, the Brazilian Ministry of Agriculture Livestock and Supply (MAPA) issued in 2004 norms requiring DNA testing for herdbook registration of livestock, along with accreditation instructions for laboratories performing ani-mal genetic identification with DNA fingerprinting meth-ods. Eight microsatellite markers (OarCP49; OarFCB11; OarAE129; OarFCB304; MAF214; OMHC1; SPS0113; D5S2) were listed at the time as required for both sheep and goat genotyping. Souza et al. (2012) evaluated the effi-ciency of this panel in a sample of Santa Inês hair sheep and obtained lower combined probabilities of exclusion (PEC) than with other panels proposed by the authors.
Araújoet al.(2010) validated a panel of 11 micro-satellite markers for paternity testing of Brazilian goats, with combined probabilities of exclusion (PEC) of pater-nity of 0.999591 and 0.988375, in cases where the maternal genotype was known or unknown, respectively. When used to evaluate a group of registered goats, this particular set of markers detected 10% of paternity errors. Although this was a recent study, none of the markers used are present in the list sanctioned by MAPA in 2004.
The present study was performed to evaluate the effi-ciency of a panel of 16 microsatellite markers, including the eight recommended by MAPA (2004), in parentage testing of Brazilian goats from four commercial and four natural-ized breeds. This study is part of the Brazilian Dairy Goat Breeding Plan (DGBP), an initiative coordinated by Em-brapa Goat and Sheep, and has as partners universities and the Association of Goat and Sheep Breeders of Minas Gerais State (CAPRILEITE/ACCOMIG). The main objec-tive of this plan is to structure a community based dairy goat national databank and conduct progeny tests for the main dairy goat breeds raised in the country (Facóet al., 2011; Lôboet al., 2010).
Materials and Methods
A total of 120 samples of genomic DNA from locally adapted goat breeds: Canindé (CA, N = 16), Marota (MA, N = 23), Moxotó (MO, N = 22) and Repartida (RE, N = 16); as well as samples from commercial breeds: Saanen (SA, N = 17); Alpine (AL, N = 06), Anglo Nubian (AN, N = 04) and Mambrina (MB, N = 16); were used. Of these, 102 samples were derived from the DNA and tissue Gene Bank maintained by Embrapa Recursos Genéticos e Biotecnolo-gia and were used to create the allele frequency databank (training dataset) for obtaining the parentage estimates. The remaining 18 samples were obtained from the Association of Goat and Sheep Breeders of Minas Gerais (CAPRI-LEITE/ACCOMIG). A total of six known trios from the Saanen (N = 4) and Alpine (N = 2) breeds were also in-cluded. The trios were formed each by a buck, doe and kid, and the trios were independently sampled throughout the farms covered by ACOOMG. Genomic DNA was ex-tracted using an adapted protocol described by Milleret al.
(1989).
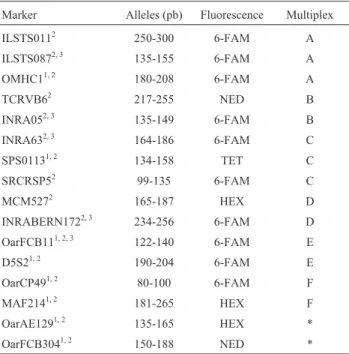
A total of 16 microsatellites were used in the study: eight markers were recommended by MAPA (MAPA, 2004), five were derived from the FAO/ISAG panel (ISAG, 2010) for goat parentage testing, and three were derived from the FAO (2011) panel recommended for studies with genetic diversity in sheep and goats (Table 1). Amplification of the markers was carried out using the Master Mix Kit for PCR-multiplex (Qiagen), following manufacturer’s recommendations, using 4.5 ng genomic DNA and 0.05-0.15mM of each primer, at a final volume of 5mL. Amplification conditions were: 95 °C for 15 min, 35 cycles at 95 °C for 5 min, 57 °C for 90 s and 72 °C for 1 min, followed by a final extension step of 72 °C for 30 min. Information regarding expected allele sizes for each marker, fluorescent label, multiplex and type of marker in the MAPA-2004 and complementary panels (PC) are presented in Table 1.
Amplified fragments were separated in an automated sequencer (ABI Prism 3100, Applied Biosystems), and generated data was analyzed with GeneScan v.3.1 and Genotyper v.3.7.0.1 (Applied Biosystems) software for al-lele and genotype calling. Allelic class determination was carried out using FlexBin v.2.0 software (Amos et al., 2006).
Cervus v.3.0.3 software (Marshallet al., 1998) was used to obtain estimates of allele number (Na), observed (Ho) and expected (He) heterozygosity (Nei, 1978), poly-morphism information content (PIC) (Botstein et al., 1980), and frequency of null alleles (FAN) for each marker.
Table 1- Marker code, expected allele size, type of fluorescence and mul-tiplex.
Marker Alleles (pb) Fluorescence Multiplex
ILSTS0112 250-300 6-FAM A
ILSTS0872, 3 135-155 6-FAM A
OMHC11, 2 180-208 6-FAM A
TCRVB62 217-255 NED B
INRA052, 3 135-149 6-FAM B
INRA632, 3 164-186 6-FAM C
SPS01131, 2 134-158 TET C
SRCRSP52 99-135 6-FAM C
MCM5272 165-187 HEX D
INRABERN1722, 3 234-256 6-FAM D
OarFCB111, 2, 3 122-140 6-FAM E
D5S21, 2 190-204 6-FAM E
OarCP491, 2 80-100 6-FAM F
MAF2141, 2 181-265 HEX F
OarAE1291, 2 135-165 HEX *
OarFCB3041, 2 150-188 NED *
The probability of exclusion considering only offspring and probable sire (PE1) and a known parent (PE2), and the probability of identity (PI) were estimated for each marker and for three distinct marker panels: Panel 1 - all 16 mark-ers; Panel 2 - eight markers recommended by MAPA (2004); and Panel 3 - seven markers with highest PIC and PI (ILSTS87; OMHC1; TCRVB6; MCM527; INRA172; OarFCB11; OarAE129).
An exact test using a Markov chain implemented in Genepop software (Raymond and Rousset, 1995) was used to test for Hardy-Weinberg equilibrium (HWE) at each marker (Guo and Thompson, 1992). TheDtest (Delta) in Cervus (Marshallet al., 1998) was used to estimate the con-fidence of informed paternity. Two simulations for each panel were carried out for correct identification of the prob-able sire: (1) identification of sire without dam information, and (2) no parental information. In the simulations, 10,000 progeny were used considering the same number of male and female candidates (n = 5) and with 100% of candidate parents sampled. The proportion and minimum quantity of markers genotyped were 91% and 10 markers, respectively, when considering the full panel. For the reduced panels, the minimum number of markers genotyped was six (MAPA, 2004) and five (most informative markers), respectively. The genotyping error was set at 1%, and strict and relaxed confidence levels were specified as 95% and 80%, respec-tively. A paternity test was carried out wherein the most probable sire was confirmed based on LOD scores greater than zero and the true sire presenting the highest LOD score.
Results
All 16 markers amplified polymorphic fragments in the eight tested breeds (Table 2) of the training dataset. In some breeds, the markers SPS0113 (Alpine), OarCP49 (Moxotó, Anglo Nubian, Marota and Mambrina), ILSTS11 (Repartida), and D5S2 (Marota and Mambrina) showed amplification problems, generating outlier allelic patterns. To avoid genotyping errors, some genotypes of the referred markers were excluded from further statistical analysis.
The number of alleles varied from four (SPS0113, D5S2 and OarCP49) to 18 (OarFCB11). D5S2 presented the lowest values for all parameters analyzed and was the only marker which remained in HWE (p > 0.05), while all other markers showed significant deviations from HWE (p < 0.05). The highest expected heterozygosity (He) was found for markers TCRVB6 (0.83) and OMHC1 (0.83). Three markers were found to be the most informative, with highest probabilities of exclusion and identity, and PIC (OarFCB11, OMHC1, and TCRVB6). Conversely, D5S2 and OarCP49 showed the lowest information content.
Panel 3 showed the highest number of alleles (10.43), Ho (0.66), He (0.80), PIC (0.77) and PIT (87.26%). Al-though Panel 1 showed a lower estimated mean number of alleles, higher Ho, He, and PIC estimates were observed in comparison with Panel 2. Estimated PEC1 and PEC2 were higher for Panel 1 than for Panels 2 and 3 (Table 3).
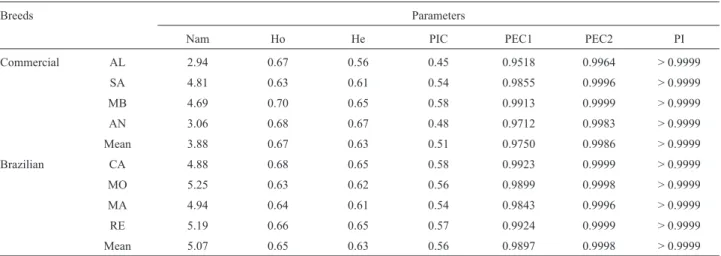
In general it was observed that locally adapted Brazil-ian breeds showed higher values than commercial breeds for every genetic index used (Table 4). For the probability
Table 2- Combined genetic variability parameters for each microsatellite marker analysed in eight goats breeds.
Marker Na Ho He PIC PE1 PE2 PI HWE FAN
ILSTS011 7 0.52 0.71 0.67 0.30 0.49 0.88 0.0024** +0.14
ILSTS087 7 0.68 0.77 0.73 0.38 0.56 0.91 0.00001*** +0.06
OMHC1 10 0.83 0.83 0.81 0.5 0.67 0.95 0.00001*** -0.01
TCRVB6 11 0.70 0.83 0.80 0.49 0.66 0.95 0.0009*** +0.08
INRA05 5 0.88 0.63 0.56 0.21 0.36 0.79 0.00001*** -0.19
INRA63 7 0.56 0.68 0.63 0.27 0.44 0.85 0.00001*** +0.09
SPS0113 4 0.50 0.58 0.53 0.18 0.35 0.78 0.00001*** +0.08
SRCRSP5 8 0.86 0.72 0.67 0.31 0.48 0.88 0.0013*** -0.09
MCM527 7 0.71 0.76 0.73 0.37 0.56 0.91 0.00001*** +0.03
INRABERN172 6 0.62 0.74 0.70 0.34 0.51 0.89 0.00001*** +0.08
D5S2 4 0.05 0.05 0.05 0.09 0.03 0.10 1.0000ns -0.01
OarCP49 4 0.94 0.51 0.39 0.13 0.20 0.64 0.00001*** -0.30
MAF214 10 0.86 0.70 0.66 0.30 0.49 0.87 0.00001*** -0.16
OarFCB11 18 0.61 0.82 0.80 0.5 0.67 0.95 0.00001*** +0.14
OarAE129 8 0.61 0.78 0.75 0.40 0.58 0.92 0.00001*** +0.13
OarFCB304 12 0.51 0.81 0.79 0.48 0.65 0.95 0.00001*** +0.23
of identity, commercial breeds showed values higher than 99.99%. Brazilian Caninde (CA) and Repartida (RE) breeds showed values higher than the mean for He, PIC, for He, PIC, as well as PEC1 and 2 (probability of exclusion 1 and probability of exclusion 2), while the Moxoto (MO) breed showed the highest number of alleles (5.25).
For the parentage test validation it was possible to ob-tain results from five of the six trios analyzed, and in 100% of the cases the correct father was assigned for each of the five trios with a strict level of confidence (95%), and with either Panel 1 or 2. Panel 3 could only be used to solve 80% of the cases (four trios) at a 95% restricted confidence level. No incompatibilities between genotypes of all five trios were observed with Panel 2, while for the other two panels, the marker OarFCB304 showed small inconsistencies in two trios. Nevertheless, these issues did not significantly affect the combined exclusion power of the panels (Ta-ble 3).
Discussion
Goat parentage verification tests are becoming rou-tine in Brazil as the sector is experiencing a production growth and a re-organization of the main actors of the sup-ply chain (farmers, government and breed associations). The microsatellite panel sanctioned by MAPA in 2004 for
sheep and goat parentage verification in Brazil was based on available literature at the time (Luikart et al., 1999; Arranzet al., 2001; Crawford et al., 2000; Farid et al., 2000; Stahlberger-Saitbekovaet al., 2001; Tomascoet al., 2002; Rychliket al., 2003) and did not consider updates de-veloped by the International Society of Animal Genetics and the genetic diversity of Brazilian breeds. Souzaet al.
(2012) evaluated this panel in Santa Inês sheep and found that some of the used markers were not very informative due to the low number of observed alleles, PIC, and conse-quently, the low individual and combined probability of ex-clusion of the markers in the panel. Markers SPS0113, D5S2 and OarCP49, which are part of the MAPA 2004 rec-ommended panel, showed the lowest numbers of observed alleles in the present study (Table 2), and therefore should be replaced by more informative markers.
The lowest number of alleles (Na = 4) was observed for markers D5S2, SPS0113 and OarCP49, which were all part of the MAPA 2004 recommended panel. Markers ILSTS11, ILSTS87, TCRVB6, INRA63, INRABERN172, SPS0113, OarFCB11, OarAE129 and OarFCB304, five of which are included in the MAPA 2004 panel, showed FAN greater than 0.05 (Table 2) and, according to Marshallet al.
(1998), should not be used for paternity testing as they tend to have reduced heterozygosity. High frequencies of null alleles lead to high rates of genotyping errors of
heterozy-Table 4- Genetic variability parameters estimates per breed using a panel of 16 microsatellite markers.
Breeds Parameters
Nam Ho He PIC PEC1 PEC2 PI
Commercial AL 2.94 0.67 0.56 0.45 0.9518 0.9964 > 0.9999
SA 4.81 0.63 0.61 0.54 0.9855 0.9996 > 0.9999
MB 4.69 0.70 0.65 0.58 0.9913 0.9999 > 0.9999
AN 3.06 0.68 0.67 0.48 0.9712 0.9983 > 0.9999
Mean 3.88 0.67 0.63 0.51 0.9750 0.9986 > 0.9999
Brazilian CA 4.88 0.68 0.65 0.58 0.9923 0.9999 > 0.9999
MO 5.25 0.63 0.62 0.56 0.9899 0.9998 > 0.9999
MA 4.94 0.64 0.61 0.54 0.9843 0.9996 > 0.9999
RE 5.19 0.66 0.65 0.57 0.9924 0.9999 > 0.9999
Mean 5.07 0.65 0.63 0.56 0.9897 0.9998 > 0.9999
Nam = mean number of alleles; Ho = observed heterozygosity; He = expected heterozygosity; PIC = polymorphism information content; PEC1 = com-bined probability of exclusion 1; PEC2 = comcom-bined probability of exclusion 2; PI = probability of identity; Alpine (AL); Saanen (SA); Mambrina (MB); Anglo Nubian (AN); Canindé (CA); Moxotó (MO); Marota (MA); and Repartida (RE).
Table 3- Genetic variability parameters estimated for three different microsatellite panels used in goats sampled in Brazil.
Panel Number of markers Nam Ho He PIC PEC1 PEC2 PI % PIT %
1 16 8.00 0.66 0.68 0.64 0.99 > 0.9999 > 99 85.99
2 (MAPA 2004) 8 8.75 0.62 0.64 0.6 0.96 0.9958 > 99 85.83
3 7 10.43 0.67 0.80 0.77 0.98 0.9989 > 99 87.26
gotes, resulting in incorrect exclusions of dam-offspring or sire-offspring pairs.
Heterozygosity estimates were high for most of the tested markers (Luikartet al., 1999; Menezeset al., 2006; Carolino et al., 2009; Araújo et al., 2010; Zhang et al., 2010). Panel 3 showed a He of 80%, while in Panels 1 and 2 observed values were close to 70% (Table 3). The lowest heterozygosity estimates (Ho and He) were seen for D5S2 (0.053 and 0.054), which remained in a state of HWE, while the other markers showed differences in observed and expected genotype frequencies that led to significant HWE deviations (p < 0.05; Table 2). These deviations may be due to matings of closely related animals, as well as other unknown population sub-structuring.
The mean PIC value was highest for Panel 3 (0.77), which also showed the highest mean number of observed alleles (10.43, Table 3). As the PIC value is totally depend-ent on microsatellite frequencies this should not be the only parameter used for selection or exclusion of a marker for use in a panel for genetic analysis (Moazami-Goudarziet al., 1994).
The effectiveness of the panel was also analyzed by the probability of exclusion (PE) which is a parameter widely used for verification of pedigree (Araújo et al., 2010; Stevanovicet al., 2010; Zhanget al., 2010; Adamov
et al., 2011; Saberivandet al., 2011; Souza et al., 2012). The analysis for the panel of 16 markers confirmed pater-nity with PEC1 and PEC2 equal to 99.98% and 99.99%, re-spectively (Table 3). In the other evaluated panels, PEC1 and PEC2 were less than 99.98%, confirming exclusion probabilities obtained by Souzaet al.(2012) for Santa Inês sheep (99.708% and 99.799 for PEC1 and PEC2, respec-tively) using the MAPA 2004 panel, and above 99.99% for both probabilities when the number of markers was in-creased to 23.
In commercial goat breeds, the lower values obtained for the parameters studied (Nam, He, PIC, PEC1 and PEC2) may be the result of selection pressure that resulted in a loss of genetic diversity when compared with these pa-rameters in Brazilian local adapted goat breeds, as well the low number of founder animals analyzed. Among special-ized goat breeds, only the Mambrina (MB) showed optimal PEC2 (99.99%), while for all Brazilian goat breeds PEC2 was above 99.9% (Table 4). Luikartet al.(1999) found that the probability of exclusion reached 99.99% for Saanen (SA). Araújoet al.(2010) observed an exclusion probabil-ity greater than 99.99% with 11 markers in three goat breeds (Saanen, Alpine and Moxotó).
The obtained probability of identification (PI) esti-mates were > 99.99% in all studied breeds. Therefore, the three panels may be useful for identification of any individ-ual belonging to these breeds (Table 4). However, to mini-mize costs and time, markers with the lowest probabilities of identity (D5S2 and OarCP49) should be excluded from further studies.
Panel 1 showed adequate paternity exclusion power in the evaluated goat breeds and could be used efficiently to verify and estimate parentage error rates in herds included in the National Dairy Goat Genetic Evaluation and Bree-ding programs led by Embrapa. In addition, any of the three evaluated panels could be efficiently used for individual identification, as all three panels showed accuracy above 99.9%.
In the second semester of 2012, MAPA published a new list of 17 microsatellites (MAPA, 2012) from which a minimum of eleven markers should be used for parentage testing. This new panel maintained three markers used in the original panel and contains five markers from the FAO diversity (2011) or ISAG paternity (2011) panels. Three of the markers in the full panel studied here (OarFCB11, ILSTS087 and MCM527) are included in this new MAPA panel. However, three other makers (OMHC1, OarE129 and OarFCB304), which were part of the original MAPA 2004 panel, have been removed from the newer list. Mar-kers included in the MAPA 2012 panel, such as SRCRSP5, INRABERN172 and INRA63 presented low PIC (< 0.7) and PI (< 0.9) in the present study, which corroborates re-sults reported by Araújoet al.(2010). Markers (OarCP49 and D5S2) indicate in our study to be highly informative in the tested breeds, were removed from the new panel (MAPA 2012), while other markers found to be less infor-mative (SRCRSP5, ILSTS005, INRABERN172 and INRA63) were maintained. Changes in established parent-age verification panels can lead to major financial impacts for farmers, as reproductively active animals that have been genotyped with the old panel have to be re-tested with the new additional markers. McClureet al.(2012) addressed these issues, emphasizing that new genotyping require-ments can face major limitations, especially when consid-ering historic animals without a viable DNA source due to culling, death, or change in ownership of the animal.
Recent advances in the use of genomic technologies are profoundly impacting several livestock industries around the world. The widespread use of low-cost high density SNP marker panels in routine genetic evaluations and breeding programs are driving a paradigm shift to a new structure in which microsatellite marker data is no lon-ger needed for paternity testing. Studies validating imputa-tion methods to transpose microsatellite data from histori-cal animals to SNPs contained in commercial panels now routinely used for testing registered cattle and sheep have been reported (McClureet al., 2012). Although this transi-tion should be slower for goats, it can be expected that these new technologies should be fully embraced within less than ten years.
Acknowledgments
to thank the anonymous reviewers for their suggestions to improve this manuscript.
References
Adamov N, Mickov L, Petkov V and Adamov M (2011) Micro-satellite markers for pedigree vårification in cattle. Mac J Anim Sci 1:9-15.
Amos W, Hoffman JI, Frodsham A, Zhang L, Best S and Hill AVS (2006) Automated binning of microsatellite alleles: Problems and solutions. Mol Ecol Notes 7:10-14.
Araújo AM, Guimarães SEF, Pereira CS, Lopes OS, Rodrigues MT and Machado TMM (2010) Paternity in Brazilian goats through the use of DNA microsatellites. Rev Bras Zootec 39:1011-1014.
Arranz J, Bayón Y and San Primitivo F (2001) Differentiation among Spanish sheepbreeds using microsatellites. Genet Sel Evol 33:529-542.
Arruga MV, Monteagudo LV, Tejedor MT, Barrao R and Ponz R (2001) Analysis of microsatellites and paternity testing in Rasa Aragonesa sheep. Res Vet Sci 70:271-273.
Banos G, Wiggans GR and Powell RL (2001) Impact of paternity errors in cow identification on genetic evaluations and inter-national comparisons. J Dairy Sci 84:2523-2529.
Barnett NL, Purvis IW, Van HB and Franklin IR (1999) The accu-racy of current dam pedigree recording strategies employed by stud Merino breeders. In: Proceedings of the Association for the Advancement of Animal Breeding and Genetics. Mandurah Western Australia, 13:373-376.
Baron EE, Martinez ML, Verneque RS and Coutinho LL (2002) Parentage testing and effect of misidentification on the esti-mation of breeding value in Gir cattle. Genet Mol Biol 25:389-394.
Bolormaa S, Ruvinsky A, Walkden-Brown S and van der Werf J (2008) DNA-based parentage verification in two Australian goat herds. Small Rumin Res 80:95-100.
Botstein D, White RL, Skolnick M and Davis RW (1980) Con-struction of a genetic linkage map in man using restriction fragment length polymorphisms. Am J Hum Genet 32:314-331.
Carneiro TX, Gonçalves EC, Schneider MPC and Silva A (2007) Diversidade genética e eficiência de DNA microssatélites para o controle genealógico da raça Nelore. Arq Bras Med Vet Zootec 59:1257-1262.
Carolino I, Sousa CO, Ferreira S, Carolino N, Fátima, SS and Luís TG (2009) Implementation of a parentage control system in Portuguese beef-cattle with a panel of microsatellite mark-ers. Genet Mol Bio 32:306-311.
Christensen LG, Madsen P and Petersen J (1982) The influence of incorrect sire identification on the estimates of genetic pa-rameters and breeding values. Proc. 2nd World Congress on Genetics Applied to Livestock Production, Madrid, Spain 7:200-208.
Crawford AM, Diez-Tascon C, Littlejohn RP and Crawford AM (2000) Genetic variation within the Merino sheep breed: Analysis of closely related populations using microsatel-lites. Anim Genet 31:243-251.
Curi RA and Lopes CR (2002) Evaluation of nine microsatellite loci and misidentification paternity frequency in a popula-tion of Gyr breed bovines. Braz J Vet Res Anim Sci 39:129-135.
FAO (2011) Thirteenth Regular Session. Draft Guidelines on Mo-lecular Genetic Characterization of Animal Genetic Re-sources. Rome, July18-22, 2011.
Facó O, Lôbo RNB, Gouveia AMG, Guimarães MPSLMP, Fon-seca JF, dos Santos TNM, da Silva MAA and Vasques LCV (2011) Breeding plan for commercial dairy goat production systems in southern Brazil. Small Rum Res 98:164-169. Farid A, O’Reilly E, Dollard C and Kelsey Jr CR (2000) Genetic
analysis of ten sheep breeds using microsatellite markers. Can J Anim Sci 80:9-18.
Glowatzki-Mullis ML, Muntwyler J and Gaillard C (2007) Cost-effective parentage verification with 17-plex PCR for goats and 19-plex PCR for sheep. Anim Genet 38:86-88. Guo SW and Thompson EA (1992) Performing the exact test of
Hardy-Weinberg proportion for multiple alleles. Biometrics 48:361 372.
Jiménez-Gamero I, Dorado G, Muñoz-Serrano A, Analla M and Alonso-Moraga A (2006) DNA microsatellites to ascertain pedigree-recorded information in a selecting nucleus of Murciano-Granadina dairy goats. Small Rum Res 65:266-273.
Lôbo RNB, Facó O, Lôbo AMBO and Villella LCV (2010) Bra-zilian goat breeding programs. Small Rum Res 89:149-154. Lopes FB, Silva MC, Miyagi ES, Borjas AR, Fiorvanti MCS,
Facó O, Guimaraes RF, Carvalho Jr OA and McManus C (2012) Spatialization of climate, physical and socioeco-nomic factors that affect the dairy goat production in Brazil and their impact on animal breeding decisions. Pesq Vet Bras 11:1073-1081.
Luikart G, Biju-Duval MP, Ertugrul O, Zagdsuren Y, Maudet C and Taberlet P (1999) Power of 22 microsatellite markers in fluorescent multiplexes for parentage testing in goats (Capra hircus). Anim Genet 30:431-438.
Maichomo KM, Gitau WGK, Gathuma JM, Ndung’u JM, Kosura O and Olivier HO (2008) Extent and implications of incor-rect offspring-sire relationships in pastoral production sys-tem in Kajiado District, Kenya. Livest Res R Dev 20:e80. MAPA (2004) White paper nº 74, October 20, 2004, of the
Minis-try of Agriculture, Brazil.
MAPA (2012) White Paper no17, August 9, 2012, of the Ministry of Agriculture, Brazil.
Marshall TC, Slate J, Kruuk L and Pemberton JM (1998) Statisti-cal confidence for likelihood - based paternity inference in natural populations. Mol Ecol 7:639-655.
McClure M, Sonstegard T, Wiggans G and Van Tassell CP (2012) Imputation of microsatellite alleles from dense SNP geno-types for parental verification. Frontiers Genet 3:e140. Menezes MPC, Martinez AM, Ribeiro MN, Pimenta Filho EC and
Bermejo, JVD (2006) Caracterização genética de raças ca-prinas nativas brasileiras utilizando-se 27 marcadores mi-crossatélites. Rev Bras Zootec 35:1336-1341.
Miller SA, Dykes DD and Polesky HF (1989) A simple salting out procedure for extracting DNA from human nucleated cells. Nucleic Acids Res 16:1215-1998.
Moazami-Goudarzi K, Vaiman D, Mercier D, Grohs C, Furet JP, Levéziel H and Martin P (1994) Emploi de microsatellites pour l’analyse de la diversité genétique des races bovines francaises: Premiers resultants. Genet Sel Evol 26:155-165. Nei M (1978) Estimation of average heterozygosity and genetic
Raymond M and Rousset F (1995) Population genetics software for exact tests and ecumenicism. J Hered 86:248-249. Reis SP, Gonçalves EC, Schneider AS, Silva A and Schneider
MPC (2008) Genetic variability and efficiency of DNA microsatellite markers for paternity testing in horse breeds from the Brazilian Marajó archipelago. Genet Mol Biol 31:68-72.
Ron M, Blanc Y, Band M, Ezra E and Weller JI (1996) Misidenti-fication rate in the Israeli dairy cattle population and its im-plications for genetic improvement. J Dairy Sci 79:676-681. Rychlik T, Radko A and Duniec M (2003) Evaluating the
useful-ness of polymorphism of some genetic markers for parent-age control of sheep. Med Weter 59:1016-1018.
Saberivand A, Javanmard A and Safdari M (2011) Parentage veri-fication and identity test of Ghezel sheep using microsatel-lite markers. Afr J Biotech 31:5815-5819.
Souza C, Paiva SR, McManus C, Azevedo HC, Mariante AS and Grattapaglia D (2012) Genetic diversity and assessment of 23 microsatellite markers for parentage testing of Santa Inês hair sheep in Brazil. Genet Mol Res 11:1217-1229. Stahlberger-Saitbekova N, Schlapfer J, Dolf G and Gaillard C
(2001) Genetic relationships in Swiss sheep breeds based on microsatellite analysis. J Anim Breed Genet 118:379-387. Stevanovic J, Stanimirovic Z, Dimitrijevic V and Maletic M
(2010) Evaluation of 11 microsatellite loci for their use in paternity testing in Yugoslav Pied cattle (YU Simmental cattle). Czech J Anim Sci 55:221-226.
Tomasco I, Wlasiuk G and Lessa EP (2002) Evaluation of poly-morphism in ten microsatellite loci in Uruguyan sheep flocks. Genet Mol Biol 25:37-41.
Visscher PM, Woolliams JA, Smith D and Williams JL (2002) Es-timation of pedigree errors in the UK dairy population using microsatellite markers and the impact on selection. J Dairy Sci 85:2368-2375.
Visser CE, Marle-Köster V and Friedrich H (2011) Parentage ver-ification of South African Angora goats, using microsatellite markers. South Afr J Anim Sci 41:250-255.
Weller JI, Feldmesser E, Golik M, Tager-Cohen I, Domochovsky R, Alus O, Ezra E and Ron M (2004) Factors affecting incor-rect paternity assignment in the israeli Holstein population. J Dairy Sci 87:2627-2640.
Zhang Y, Wang Y, Sun D, Yu Y and Zhang Y (2010) Validation of 17 microsatellite markers for parentage verification and identity test in Chinese Holstein cattle. J Anim Sci 23:425-429.
Internet Resources
IBGE (2010) Produção da Pecuária Municipal. Instituto Brasileiro de Geografia e Estatística, Rio de Janeiro, v. 38, 65 pp, http://www.ibge.gov.br/home/estatistica/economia/ ppm/2010/ppm2010.pdf (accessed March, 2013).
ISAG (2010) Applied Genetics in Sheep and Goats Workshop. In: 32th International Conference on Animal Genetics - ISAG,
Edinburgh. http://
www.isag.us/Docs/Ap-plied_GeneticsSheepGoats_CT.pdf (accessed April, 2012).
Associate Editor: Bertram Brenig