Genetic parameters for five traits in Africanized honeybees using Bayesian
inference
Alessandro Haiduck Padilha
1, Aroni Sattler
2, Jaime Araújo Cobuci
1and Concepta Margaret McManus
1,3 1Departamento de Zootecnia, Universidade Federal do Rio Grande do Sul, Porto Alegre, RS, Brazil.
2
Laboratório de Apicultura, Departamento de Fitossanidade, Universidade Federal do Rio Grande do Sul,
Porto Alegre, RS, Brazil.
3
Instituto Nacional em Ciência e Tecnologia, Informação Genético-Sanitária da Pecuária Brasileira,
Belo Horizonte, MG, Brazil.
Abstract
Heritability and genetic correlations for honey (HP) and propolis production (PP), hygienic behavior (HB), syrup-collection rate (SCR) and percentage of mites on adult bees (PMAB) of a population of Africanized honeybees were estimated. Data from 110 queen bees over three generations were evaluated. Single and multi-trait models were an-alyzed by Bayesian Inference using MTGSAM. The localization of the hive was significant for SCR and HB and highly significant for PP. Season-year was highly significant only for SCR. The number of frames with bees was significant for HP and PP, including SCR. The heritability estimates were 0.16 for HP, 0.23 for SCR, 0.52 for HB, 0.66 for PP, and 0.13 for PMAB. The genetic correlations were positive among productive traits (PP, HP and SCR) and negative between productive traits and HB, except between PP and HB. Genetic correlations between PMAB and other traits, in general, were negative, except with PP. The study permitted to identify honeybees for improved propolis and honey production. Hygienic behavior may be improved as a consequence of selecting for improved propolis produc-tion. The rate of syrup consumption and propolis production may be included in a selection index to enhance honey-bee traits.
Keywords: heritability, genetic correlations, environmental effects,Apis mellifera.
Received: December 3, 2012; Accepted: March 11, 2013.
Introduction
Apiculture in Brazil is based on the well adapted and productive Africanized honeybee (Silva and Freitas, 2004). The world leaders in honey production are China, USA, Ar-gentina and Mexico (Bölke and Palmeira, 2006). Brazil, ac-cording to same authors, is the eleventh largest honey producer and the fifth exporter in worldwide, but has poten-tial to increase both production and productivity. Accord-ing to Aizen and Harder (2009), the global population of managed honeybee hives has increased ~45% during the last 50 years, but no data are available on feral populations. These authors state that increasing demands for agricultural pollination services are driving the increase in honeybee populations, but there has been a much more rapid (> 300%) increase in the fraction of agriculture that de-pends on animal pollination in the same period, stressing a need for global pollination capacity. This implies a need to
increase honeybee numbers, survival and productivity, and this can be achieved through applying animal breeding the-ory to managed populations. This situation also exists in Brazil (Guedeset al., 2011). However, information on en-vironmental and genetic factors that affect economic traits in the different genotypes of honeybees across the country is limited.
The Africanized honeybee is considered more resis-tant to diseases and more tolerant toVarroa destructorthan the European honeybees, breeding for improvement in pro-ductive and resistance/tolerance traits should have signifi-cant economic impact on this activity (Büchleret al., 2010). Honey production, production of propolis, foraging behav-ior, hygienic behavior and lower percentages of mites on adult bees (or grooming behavior) should be included in ge-netic evaluations and selection programs in order to choose the best queens to increase honey or propolis production and productivity (Milne Jr, 1985; Bienefeld and Pirchner, 1990; Thimann and Manrique, 2002; Stanimirovicet al., 2010; Wilson-Richet al., 2010). However, before selection can be carried out, it is necessary to estimate the herita-bilities and the genetic correlations between productive and
www.sbg.org.br
Send correspondence to Alessandro Haiduck Padilha. Departa-mento de Zootecnia, Faculdade de Agronomia, Universidade Fe-deral do Rio Grande do Sul, Avenida Bento Gonçalves 7712, 91540-000 Porto Alegre, RS, Brazil. E-mail: [email protected].
resistance/tolerance traits to predict the response to selec-tion for a given trait.
There are few reports on parameter estimates in Afri-canized honeybees in Brazil (Faquinello et al., 2011; Costa-Maiaet al.,2011). Therefore, the objective of this study was to estimate the heritabilities and genetic correla-tions for honey production, propolis production, syrup-collection rate, hygienic behavior and percentage of mites on adult bees in a population of Africanized honeybees in southern Brazil.
Material and Methods
The study was conducted from April 2009 to October 2010 at the Agronomic Experimental Station of the Federal University of Rio Grande do Sul (EEA/UFRGS), in Eldo-rado do Sul, Rio Grande do Sul, Brazil. Africanized honey bee queens used in this study were donated by a local beekeepers association. A total of 110 queens were evalu-ated over three generations (40, 40 and 30 queens per gen-eration). The queens were raised from each of the first 40 colonies for the second generation, and from each of the second generation colonies for the third one. Missing re-cords in the third generation were due to problems in an in-cubator for queen rearing and loss of some colonies over winter because of falling trees in an apiary. Queen rearing was realized by the larval transference method. The new queens were marked with enamel paint and introduced into the colonies two days after the laying queen had been re-moved. The new queens were mated naturally. The first measurement was carried out at least 65 days after the new queens started to lay eggs.
Honey production was measured twice, in May 2009 and March 2010. To measure honey production, frames were weighed before and after centrifugation. Syrup-collection rate, used as a proxy for estimating hoarding be-havior, was measured in July/August 2009, February and August 2010, totalling three measurements. All the hives had the same numbers of empty combs, but syrup storage was not measured, because the objective was to determine the rate of consumption. Glass recipients (600 mL) covered by metal lids with eight holes (1.5 mm width) were used. Each recipient was completely filled with water:sugar:ho-ney syrup in a 4:4:2 proportion. Two (July/August) to three (on February) recipients were introduced into the hive in the afternoon. After 12 hours, leftover syrup was measured to determine the rate of consumption.
Measurements of propolis production were carried out in July and August 2009 (winter), April and May 2010 (autumn) and September/October 2010 (spring). Produc-tion was measured using propolis collectors on two sides of the hive (22 cm x 3 cm). These were covered with a trans-parent adhesive tape. This tape was used to protect honey-bees from environmental conditions and predators. The collectors remained in the hives for 25 days before the propolis was cut and weighed.
Measurement of hygienic behaviour was realized by the Needle Test (Olszewski and Paleolog, 2007). On a comb containing pupae in the initial phase of eye pigmenta-tion or light pink colour (10 to 14 days age) 100 cells were pricked simultaneously with a “brush” containing 100 nee-dles. In cases of irregulary constructed combs, the cells were pricked individually with a single needle. A similar nearby area (not pricked) of the comb was used to correct for natural cleaning of parasitized or sick pupae. The comb was photographed before the test and 24 hours thereafter to count the number of perforated cells and (un)cleaned combs. To guarantee the quality of images, the same comb was photographed in the field four times to evidence the difference between eventual loads of pollen and perforated pupae that were not cleaned by the bees. Thus hygienic be-haviour was evaluated as:
HB EC EC
OC = é
-ë
ê ù
û ú ´ ì
í î
ü ý þ
-ìí - ´ î
ü ý þ
1 2
100 C B 100
A ,
where A is the number of cells with operculated pupae (wit-ness area; not pricked); B is the number of empty cells of the witness area before the needle test; C is the number of empty cells of witness area after the needle test;EC1is the
number of empty cells in the test area 24 h after the needle test;EC2is the number of empty cells in test area before the
needle test;OCis the number of operculated cells (with pu-pae) in the test area before the needle test.
The measurement of percentage of mites on adult bees was adapted from De Jonget al.(1982). A solution of a neutral commercial detergent in water was prepared (0.5 mL/L). Recipients (250 mL) were filled with 100 mL of this solution and taken to the field. Samples of adult hon-eybees from the brood area of the combs were picked at the same time as the hygienic behaviour test. The samples were shaken for 1 min in a glass recipient (600 mL) and sieved to separate mites and honeybees.
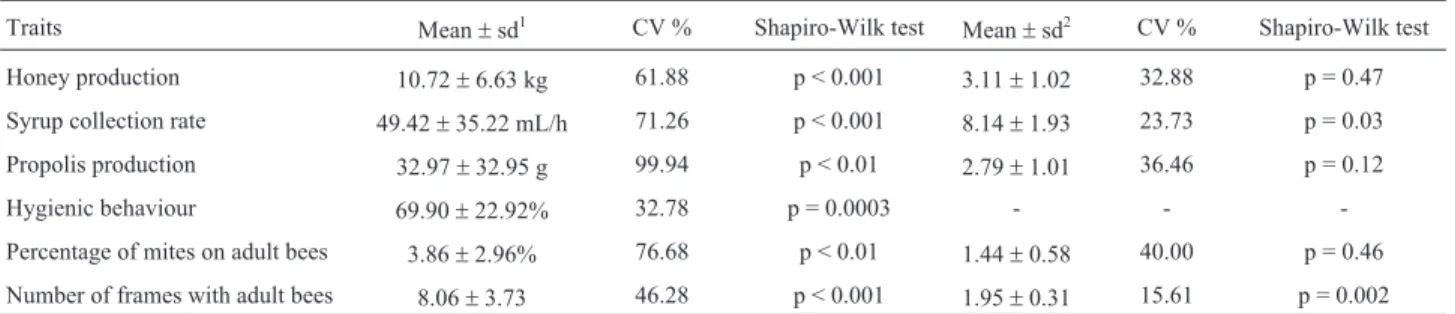
The quantity of honeybees in a hive may influence the performance of the colony (Topalet al., 2008) and is refer-enced in literature as colony strength (Nasret al., 1990). The strengh of the colony was measured by counting the number of frames covered with adult bees. This measure-ment was taken for all traits to be used as covariate in the statistic models. Data were analyzed to verify normality us-ing the Univariate Procedure of the SAS program (SAS In-stitute Inc, Cary, North Carolina). Phenotypic records were transformed (Square root for honey production, cubic root for propolis production and syrup collection rate, and loga-rithm of percentage of mite + 1). The GLM Procedure was used to check the influence of non-genetic effects on traits, and which ones were to be considered in the models to esti-mate genetic parameters. The description of the data set used in the study is shown in Table 1.
among queens. Models included non-genetic effects of lo-cation of the hive, season-year, and number of frames cov-ered with bees for honey production, syrup collection rate, and percentage of mites on adult bees. For propolis produc-tion and hygienic behaviour the localizaproduc-tion of the hive and the number of frames covered with bees were considered. The genetic and residual effects were considered for all traits.
The matricial model used to estimate genetic parame-ters in a single-trait analysis was:
y=Xb+Za+e,
wherey is the vector of observations;bis the vector of non-genetic effects;ais the vector of animal effects;eis the vector of residual effects;Xis the design matrix of order n´p, which relates records to non-genetic effects;Zis the design matrix of the order n´q, which relates records to an-imal effects. The matricial model used to estimate genetic parameters in multi-trait analysis was:
y y X X b b Z Z u u 1 2 1 2 1 2 1 2 1 2 0 0 0 0 é ë ê ù û ú =é
ë ê ù û úé ë ê ù û ú +é
ë ê ù û úé ë ê ù û ú +é
ë ê ù û ú e e 1 2 ,
whereyiis the vector of observations to the i-th trait;bis
the vector of non-genetic effects to thei-th trait;uiis the
vector of animal effects to the i-th trait;eiis the vector of
re-sidual effect of thei-th trait;XiandZiare incidence
matri-ces that relate the observations of thei-th trait to environ-mental and animal effects. It was assumed that:
var
a
a
e
e
g A g A
g A g A
r r 1 2 1 2 11 12 21 22 11 0 0 0 0 0 0 é ë ê ê ê ê ù û ú ú ú ú = 12 21 22
0 0 r r
é ë ê ê ê ê ù û ú ú ú ú ,
whereg11is the additive genetic variance to direct effects of the trait 1;g12=g21are the additive genetic covariance be-tween traits;g22is the additive genetic variance to direct ef-fects of the trait 2;rijare the elements ofR, the (co)variance matrix to residual effects.
Components of variance and genetic parameters were estimated using Bayesian Inference by MTGSAM software
(Multiple Trait Gibbs Sampling in Animal Models) developed by Van Tassell and Van Vleck (1995). The ini-tial values for the components of variance were obtained using REML analysis and values published in the literature (Rothenbuhleret al., 1979; Bienefeld and Pirchner, 1990; Stanimirovicet al., 2008). In the MTGSAM analyses, the initial distribution was assumed as symmetric and the defi-nition parameter of the initial distribution was assumed as 4 (single-trait analysis) and 5 (multi-trait analysis).
The models were analyzed, first by generating two “pilot-samples”, which were monitored by the Raftery and Lewis (1992) diagnostic test to verify convergence. The test, implemented in the BOA software package (Bayesian Output Analysis) generated indications of burn-in, number of iterations and thinning interval. These indications were used to generate 20,000,000 (single-trait) and 100,000,000 (multi-trait) total iterations, a burn-in of 3,000,000 (single and multi-trait analysis) and thinning interval of 1,000 (sin-gle-trait) and 2,000 (multi-trait) iterations, which resulted in 48,500 (single-trait) and 17,000 (multi-trait) final sam-ples. The convergence criterion used was 10-12. Conver-gence of samples was monitored using values of serial correlation by graphical analysis and diagnostic tests of Raftery and Lewis (1992), Geweke (1992) and Heidel-berger and Welch (1983), and values of Markov Chain Er-ror, calculated by the package BOA (Bayesian Output Analysis) (Smith, 2005), implemented in R software (R Development Core Team, 2010). The highest probability density interval for estimation of components of variance and genetic parameters was tested.
Results
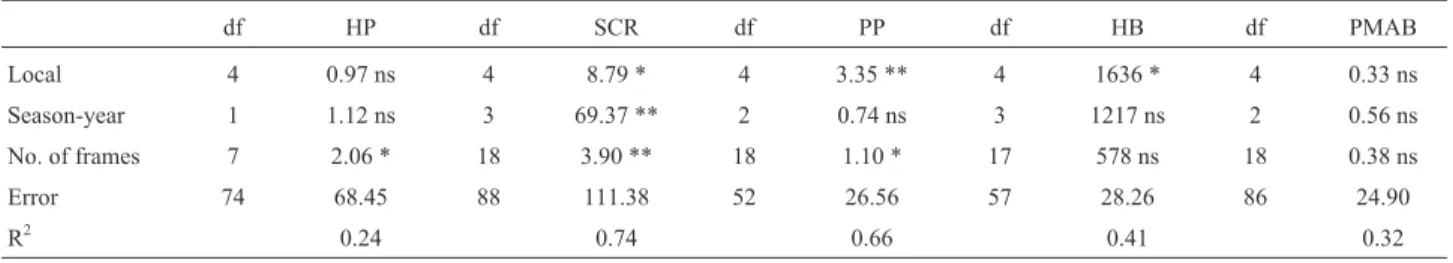
The local effect (Table 2) influenced syrup collection rate, propolis production and hygienic behavior (p < 0.05). The season-year effect was significant (p < 0.001) only for syrup-collection rate. The number of frames with adult bees, fitted as a covariate, was significant (p < 0.05) for honey production, syrup collection rate and propolis pro-duction. The effects in the model explained 24%, 32%, 41%, 66% and 74% of the total variation for honey produc-tion (HP), percentage of mites on adult bees (PMAB),
hy-Table 1- Description of the data set used in the analysis.
Traits Mean±sd1 CV % Shapiro-Wilk test Mean±sd2 CV % Shapiro-Wilk test
Honey production 10.72±6.63 kg 61.88 p < 0.001 3.11±1.02 32.88 p = 0.47
Syrup collection rate 49.42±35.22 mL/h 71.26 p < 0.001 8.14±1.93 23.73 p = 0.03
Propolis production 32.97±32.95 g 99.94 p < 0.01 2.79±1.01 36.46 p = 0.12
Hygienic behaviour 69.90±22.92% 32.78 p = 0.0003 - -
-Percentage of mites on adult bees 3.86±2.96% 76.68 p < 0.01 1.44±0.58 40.00 p = 0.46
Number of frames with adult bees 8.06±3.73 46.28 p < 0.001 1.95±0.31 15.61 p = 0.002
1
gienic behavior (HB), propolis production (PP) and syrup collection rate (SCR), respectively.
Heritability estimates (Table 3) were 0.16 for HP, 0.23 for SCR, 0.66 for PP, 0.52 for HB and 0.13 for PMAB on non-transformed data, and 0.17 for HP, 0.29 for SCR, 0.67 for PP and 0.14 for PMAB for transformed data (Table 4). The transformation of data did not influence the results for the mean heritability and highest probability density intervals (HPDI). Thus, non-transformed data were used to estimate heritability and genetic correlations. In
general, HPDI showed large intervals for variance compo-nents and heritability. These results may be due to the low number of queens evaluated and/or to the natural mating scheme used.
The means of the posterior distributions of the genetic correlations (Table 5) were negative between HP/SCR, HB and PMAB. On the other hand, the residual correlations be-tween these same traits were positive. The genetic correla-tions between HP, SCR and PP, and between PP with HB and PMAB were positive. In general, residual correlations
Table 2- Mean squares and significance levels for traits in Africanized honey bees.
df HP df SCR df PP df HB df PMAB
Local 4 0.97 ns 4 8.79 * 4 3.35 ** 4 1636 * 4 0.33 ns
Season-year 1 1.12 ns 3 69.37 ** 2 0.74 ns 3 1217 ns 2 0.56 ns
No. of frames 7 2.06 * 18 3.90 ** 18 1.10 * 17 578 ns 18 0.38 ns
Error 74 68.45 88 111.38 52 26.56 57 28.26 86 24.90
R2 0.24 0.74 0.66 0.41 0.32
* = significant (p < 0.05), ** = highly significant (p < 0.001), ns = non-significant, df = degree of freedom, R2= coefficient of determination, HP = honey
production, PMAB = percentage of mites on adult bees, HB = hygienic behavior, PP = propolis production, SCR = syrup-collection rate.
Table 3- Posterior distributions of the variance components for five traits in Africanized honey bees (not transformed) with highest probability density.
HP SCR PP HB PMAB
s2a 6.53 (0.58; 20.48) 1.58 (0.19; 4.32) 470.55 (118.86; 773.35) 303.06 (46.92; 572.81) 0.99 (0.08; 3.38)
s2e 33.34 (15.41; 50.21) 5.33 (2.23; 7.9) 234.36 (35.05;546.28) 276.13 (43.19; 536.06) 6.65 (3.43; 9.45) s2p 40.27 (28.9; 52.65) 6.92 (5.31; 8.76) 704.91 (500.22;933.09) 579.19 (411.1; 768.44) 7.64 (5.78; 9.73)
h2 0.16 (0.02; 0.52) 0.23 (0.03; 0.61) 0.66 (0.24;0.94) 0.52 (0.12; 0.89) 0.13 (0.01; 0.45)
HP = honey production, SCR = syrup collection rate, PP = propolis production, HB = hygienic behavior, PMAB = percentage of mites on adult bees.
Table 4- Posterior distributions of the variance components for four traits in Africanized honey bees (transformed) with highest probability density
inter-vals.
HP SCR PP PMAB
s2a 0.17 (0.02; 0.52) 0.47 (0.06; 1.17) 0.39 (0.09; 0.64) 0.04 (0.004; 0.12) s2e 0.80 (0.35; 1 19) 1.15 (0.40; 1.78) 0.19 (0.03; 0.45) 0.24 (0.13; 0.33) s2p 0.96 (0.70; 1.27) 1.62 (1.23; 2.04) 0.59 (0.42; 0.78) 0.28 (0.21; 0.35)
h2 0.17 (0.002; 0.54) 0.29 (0.04; 0.69) 0.67 (0.25; 0.94) 0.14 (0.02; 0.42)
HP = honey production, SCR = syrup collection rate, PP = propolis production, PMAB = percentage of mites on adult bees.
Table 5- Means of posterior distributions of the genetic (superior diagonal) and residual correlations (inferior diagonal) with the highest probability
den-sity intervals.
HP SCR PP HB PMAB
HP - 0.48 (-0.35; 0.96) 0.58 (-0.04; 0.94) -0.34 (-0.9; 0.47) -0.52 (-0.98; 0.63)
SCR -0.13 (-0.75; 0.35) - 0.67 (0.23; 0.94) -0.24 (-0.8; 0.45) -0.66 (-0.98; 0.04)
PP -0.44 (-0.87; 0.09) -0.09 (-0.70; 0.92) - 0.15 (-0.41; 0.63) 0.49 (-0.15; 0.91)
HB 0.36 (-0.30; 0.87) 0.80 (0.45; 0.97) 0.65 (0.03; 0.97) - -0.82 (-0.98; -0.44)
PMAB 0.09 (-0.49; 0.57) 0.30 (-0.07; 0.76) -0.59 (-0.92; -0.14) 0.30 (-0.30; 0.85)
were negative, except between PP and PMAB. The genetic correlations between PP and SCR and between HB and PMAB were more precisely estimated, showing the small-est intervals in HPDI. The same precision was observed in residual correlations between HB and SCR, between HB and PP and between PP and PMAB.
Discussion
As there is little information on environmental and genetic parameters for Africanized honeybees in the litera-ture we compared our results with studies on European honeybees, although these used different methods and number of queens or records. Bar-Cohenet al. (1978) eval-uated 562 colonies of European honeybees, using regres-sion methods. Bienefeld and Pirchner (1990) evaluated 5581 records of European bees, using the REML method. In Brazil, Costa-Maiaet al. (2011) and Faquinello et al. (2011) used Bayesian inference to evaluate 40 and 193 Africanized honeybees, respectively.
The location of the hive influenced PP, HB and SCR and the season-year was an important effect for SCR. These effects are related to the distance between the hive and the source of pollen or nectar (Sandeet al., 2009), as well as meteorological factors (rain, temperature, clouds) (Hol-mes, 2002). Although the location was not significant for all traits in this study, it was used in all models, because analyses including this effect showed higher precision in the estimates of heritability and HPDI. Year-season was in-cluded in models for HP and PMAB. The number of frames covered with bees influenced PP, HP and SCR, which are traits related to production. Topalet al.(2008) reported that the number of frames with bees had a significant positive relationship with honey yield. Thus, this effect was in-cluded in all models as linear covariate.
The heritability (0.16) for HP was lower than the value reported by Bar-Cohenet al.(1978) for Italian bees (0.54), but higher than the low value found by Praaghet al. (2006)for Carnolian honeybees (0.03). While these param-eters were obtained by regression methods, Bienefeld and Pirchner (1990) used the Restricted Maximum Likelihood method (REML) forApis mellifera carnicaand found 0.15 and 0.26 for effects of queen and worker bees, respectively. These differences among parameter estimates may be due to different strains or races of honeybees, different methods of estimation and/or environmental effects considered in the models. Honey production is one of many economically valuable traits, being greatly influenced by environmental factors such as a regular supply of pollen and nectar over the season, a hive fully populated with worker bees, the weather, and the quality of care that honeybees receive from beekeepers (Holmes, 2000). The low heritability found in this study may be explained by the residual vari-ance, which was five times higher than the genetic variance (Table 3).
The heritability estimate (0.23) for SCR was lower than that reported for rapid (0.55) and slow (0.32) lines se-lected for syrup collection under laboratory conditions by Rothenbuhleret al.(1979) and higher than the heritability (0.187±0.029) found by Milne Jr (1985) for the removal of sugar syrup from vials and the storage in combs by caged honey bees. Despite the methodological difference be-tween the field test in the present study and field tests using flight cages or laboratory tests (Olszewski and Paleolog, 2005), the result (heritability) appears to be quite similar, this indicating that it is possible to obtain genetic progress using this kind of hoarding behavior measure as a selection criterion.
Some studies have shown that selection for improv-ing propolis production in Africanized bees is feasible (Manrique and Soares, 2002; Thimann and Manrique, 2002). However, numerous studies have focused mainly on the chemical components of propolis that could be used to treat human diseases (Simone-Fingstron and Spivak, 2010), and others on the importance of propolis to bee health (Simoneet al., 2009). The heritability (0.66) esti-mated for PP is high and should permit genetic improve-ment through selection.
The heritability estimate (0.52) for HB was lower than the value (0.63) found for Carnolian honeybees by Stanimirovicet al. (2008). Costa-Maiaet al.(2011), using Bayesian inference, estimated a lower heritability value (0.28) for Africanized bees in Brazil. Hygienic behavior is widely studied and documented in the literature (Wilson-Rich et al., 2009). There are several breeding programs and/or institutions involved in the selection for more hy-gienic queens/worker bees to obtain more healthy and pro-ductive colonies (Stanimirovicet al., 2008; Bourgeois and Rinderer, 2009; Costa-Maiaet al., 2011).
The low heritability estimated for PMAB (0.13) is ex-plained by the low genetic variance, which was 6.7 times lower than the residual variance. Despite the slow genetic progress that may be achieved, the selection of honeybees with low levels of mites or with tolerance toVarroa de-structoris economically very important (Spivak and Reu-ter, 1998; Martin and Medina, 2004; Rindereret al., 2010). While this mite has killed millions of colonies of European honeybees in Europe and North America, the Africanized bee has a certain tolerance to this mite (Martin and Medina, 2004). Nevertheless, the presence of the mite may decrease the productivity of the colony.
in Africanized honeybees, with r = 0.422 (p = 0.00001256), showing that the bees that produced more propolis also pro-duced more honey (Manrique and Soares, 2002). The nega-tive residual correlations among the same traits (-0.13, -0.44, -0.09) indicate that the improvement of environmen-tal conditions will have an antagonistic effect.
Genetic correlations between HP and HB (-0.34) and between SCR and HB (-0.24) were antagonistic, which suggest a negative response in selection. Furthermore, the residual correlations (0.36, 0.8) were positive, which indi-cates that environmental conditions WERE shared. These results are different from those reported by Spivak and Reuter (1998). These authors compared naturally mated queens from a hygienic line of Italian honey bees (Apis mellifera ligustica) with colonies of a commercial line of Italian bees not selected for hygienic behavior. They found that the hygienic colonies removed more freeze-killed brood (hygienic behavior) and produced significantly more honey than the commercial lines.
The positive genetic correlation between PP and HB (0.15) differs from other estimates in this study and was not expected. Although the two traits represent different trends, and at least apparently the genetic association is not clear or not documented in the literature, these results suggest that the selection for more hygienic bees may increase propolis production. Moreover, the positive residual correlation (0.65) was high and suggests that environmental effects af-fect both traits.
The genetic correlations between PMAB with HP, SCR and HB (-0.52, -0.66, -0.82) were high and favorable, except between PMAB and PP (0.49), which was in oppo-site direction. The results indicate that selection for HB, HP/SCR should decrease PMAB, but the selection for PP should increase PMAB. Many studies have shown the same relationship between HB, the tolerance toVarroa destruc-tor,and HP (Spivak and Reuter, 1998; Harris, 2008). These same studies reported that HB in general and HB towards to Varroa destructor (Varroa-Sensitive Hygienic Behavior) are mechanisms of tolerance against diseases and varroa mites. Spivak and Reuter (1998) reported that hygienic bees (genetically selected) also had significantly less chalkbrood, no American foulbrood, fewer mites, and pro-duced more honey than commercial (not selected) bees. Ba-sically, there are two mechanisms that affect the levels of infestation of mites: grooming behavior (adult bees detect and remove mites from themselves and from nestmates) and HB (the detection and removal of dead/ill or infested pupae from capped brood cells by adult bees). Residual cor-relations (0.09, 0.30 and 0.30) between PMAB with HP, SCR and HB were in opposite direction and between PP and PMAB (-0.59) they were in the same direction.
In conclusion, the studied population of Africanized honeybees showed sufficient genetic variation to begin a breeding program. Depending on the breeding approach in a future program, commercial stocks of Africanized
honey-bees that produce more propolis and honey may be achieved. Moreover, hygienic behavior may be improved as a consequence of selecting for improved propolis pro-duction, but additional studies should be realized to better understand the genetic association between these traits. On the other hand, the rate of syrup consumption and propolis production may be used as selection criteria, preferably by including these traits in a selection index to improve traits of honeybees in breeding programs.
Acknowledgments
We would like to thank Jose Adair de Souza, Federal University of Rio Grande do Sul and the beekeepers of COOAPISUL (Cooperativa Apícola do Sul).
References
Aizen MA and Harder LD (2009) The global stock of domesti-cated honey bees is growing slower than agricultural de-mand for pollination. Curr Biol 19:1-4.
Bar-Cohen R, Alpern G and Bar-Anan R (1978) Progeny testing and selecting Italian queens for brood area and honey pro-duction. Apidologie 9:95-100.
Bienefeld K and Pirchner F (1990) Heritabilities for several col-ony traits in the honeybee (Apis melliferacarnica). Api-dologie 21:175-183.
Böhlke PB and Palmeira EM (2006) Inserção competitiva do pequeno produtor de mel no mercado internacional. Rev Acad Economía 71:1-7.
Bourgeois AL and Rinderer TE (2009) Genetic characterization of Russian honey bee stock selected for improved resistance toVarroa destructor. J Econ Entomol 102:1233-1238. Büchler R, Berg S and Le Conte Y (2010) Breeding for resistance
toVarroa destructorin Europe. Apidologie 41:393-408. Costa-Maia FM, Toledo VAA, Martins EM, Lino-Lourenço DA,
Sereia MJ, Oliveira CAL, Faquinello P and Halak AL (2011) Estimates of covariance components for hygienic be-havior in Africanized honeybees (Apis mellifera). Rev Bras Zootec 40:1909-1916.
De Jong D, Roma DA and Gonçalves LS (1982) A comparative analysis of shaking solutions for the detection ofVarroa jacobsonion adult honey bees. Apidologie 13:297-306. Faquinello P, Toledo VAA, Martins EN, Oliveira CAL, Sereia
MJ, Costa-Maia FM and Ruvolo-Takasusuki MCC (2011) Parameters for royal jelly production in Africanized honey-bees. Sociobiology 57:495-510.
Geweke J (1992) Evaluating the accuracy of sampling-based ap-proaches to calculation of posterior moments. In: Bernardo JM, Berger JO, Dawid AP and Smith AFM (eds) Proceed-ings of the International Meeting on Bayesian Statistics. Ox-ford University Press, OxOx-ford, pp 169-194.
Guedes RS, Zanella FCV, Martins CF and Schlindwein C (2011) Déficit de polinização da aceroleira no período seco no semiárido paraibano. Rev Bras Frutic 33:465-471.
Heidelberger P and Welch P (1983) Simulation run length control in the presence of an initial transient. Oper Res 31:1109-1144.
Holmes W (2000) A survey of factors influencing honey yields. Scot Beekeeper Assoc 77:248-250.
Holmes W (2002) The influence of weather on annual yields of honey. J Agric Sci 139:95-102.
Manrique AJ and Soares AEE (2002) Start of africanized honey bee selection program for increased propolis production and its effect on honey production. Interciencia 27:312-316. Martin SJ and Medina LM (2004) Africanized honeybees have
unique tolerance to Varroa mites. Trends Parasitol 20:112-114.
Milne Jr CP (1985) A heritability estimate of honey bee hoarding behavior. Apidologie 16:413-420.
Nasr ME, Thorp RW, Tyler TL and Briggs DL (1990) Estimating honey bee (Hymenoptera, Apidae) colony strength by a sim-ple method: Measuring cluster size. J Econ Entomol 83:748-754.
Olszewski K and Paleolog J (2005) Foraging and hoarding effi-ciency in Buckfast purebreds and Norwegian black bee (A. m. mellifera) hybrids part 1. Annual honey yieldvs.results of field flying cage and laboratory tests. J Apic Sci 49:17-25. Olszewski K and Paleolog J (2007) Study on an easy method of hygienic behaviour evaluation in honey bee. Med Weter 63:165-166.
Praagh JP, Kock K and Schell HG (2006) Twelve years breeding with Carnolian honeybees at LAVES Bienenkunde Celle. Proc Neth Entomol Soc Meet 17:87-91.
R Development Core Team (2010) R: A Programming Environ-ment for Data Analysis and Graphics, R Foundation for Sta-tistical Computing, Vienna (Austria). User’s Manual. Raftery AL and Lewis S (1992) Comment: One long run with
di-agnostics: Implementation strategies for Markov chain Monte Carlo. Stat Sci 7:493-497.
Rinderer TE, Harris JW, Hunt GJ and Guzman LI (2010) Bree-ding for resistance to Varroa destructor in North America. Apidologie 41:409-424.
Rothenbuhler WC, Kulincevic JM and Thompson VC (1979) Suc-cessful selection of honeybees for fast and hoarding of sugar syrup in the laboratory. J Apic Res 18:272-278.
Sande SO, Crewe RM, Raina SK Nicolson SW and Gordon I (2009) Proximity to a forest leads to higher honey yield: An-other reason to conserve. Biol Conserv 142:2703-2709. SAS Institute Inc. (2004). SAS/STAT User’s Guide, ver. 9.1. SAS
Institute Inc, Cary.
Silva RHD and Freitas BM (2004) Produção e desenvolvimento de colônias de abelhas africanizadas (Apis melliferaL.) a partir de diferentes áreas e idades de cria. Cienc Rural 34:545-549.
Simone M, Evans JD and Spivak M (2009) Resin collection and social immunity in honey bees. Evolution 63:3016-3022. Simone-Finstrom M and Spivak M (2010) Propolis and bee
health: The natural history and significance of resin use by honey bees. Apidologie 41:295-311.
Smith BJ (2005) Bayesian output analysis program (BOA). User’s Manual, ver. 1.1.
Spivak M and Reuter GS (1998) Performance of hygienic honey bee colonies in a commercial apiary. Apidologie 29:291-302.
Stanimirovic Z, Stevanovic J, Mirilovic M and Stojic V (2008) Heritability of hygienic behaviour in grey honey bees (Apis melliferacarnica). Acta Vet Brno 58:593-601.
Stanimirovic Z, Stevanovic J, Aleksic N and Stojic V (2010) Heritability of grooming behaviour in grey honey bees (Apis melliferacarnica). Acta Vet Brno 60:313-323.
Thimann R and Manrique A J (2002) Honey production by two types of Africanized honey bees (hybrids ofApis mellifera scutellata) in western plains of Venezuela. Zootec Trop 20:259-266.
Topal M, Emsen B and Dodologlu A (2008) Path analysis of honey yield components using different correlation coeffi-cients in Caucasian honey bee. J Anim Vet Adv 7:1440-1443.
Van Tassell CP and Van Vleck LD (1995) A Manual for Use of MTGSAM. A Set of Fortran Programs to Apply Gibbs Sam-pling to Animal Models for Variance Component Estima-tion [DRAFT]. U.S. Department of Agriculture, Agricul-tural Research Service.
Wilson-Rich N, Spivak M, Fefferman NH and Starks PT (2009) Genetic, individual, and group facilitation of disease resis-tance in insect societies. Annu Rev Entomol 54:405-23. Zárate O, Araujo-Freitas C, Medina LA, Velasquez A and
Que-zada-Euán JJG (2008) Phenotypic correlations of field and laboratory tests with honey production in Africanized honey bees (Apis mellifera). Apidologie 39:523-530.
Associate Editor: Klaus Hartfelder