Article
4
Dynamic Visual Acuity Training in Cricket Players
Renée Edgar, B.Optom (Hons) Cert. Oc. Pharm (TPA), Auckland, New Zealand Ian Russell, B.Optom (Hons) Cert. Oc. Pharm (TPA), Auckland, New Zealand Diana Sluyter, B.Optom, Christchurch, New ZealandAndrew V. Collins, B.Optom, MSc, The University of Auckland, Auckland, New Zealand
ABSTRACT
Background: Dynamic visual acuity (DVA) is the ability of an observer to correctly identify details of a moving target and is considered to be important for tasks like driving. Dynamic Visual Acuity is better in athletes involved in sports such as basketball and baseball; however, no previous studies have considered the sport of cricket. We conducted a study to determine whether there was any difference in DVA between cricket and non-cricket players.
Method: Dynamic visual acuity was measured by asking subjects to identify the orientation of the gap of a moving Landolt C target as a four-alternative forced-choice task. The Landolt C targets had confusion bars surrounding them. The participants in the study were tested twice with a break of seven weeks. In between the two measurements, participants underwent two training sessions (similar to the testing sessions), each three weeks apart.
Results: The initial mean DVA for cricket players was 107.7 deg/sec, and the mean DVA
for non-cricket players was 105.5 deg/sec, with a target size of 6/15. The subjects who participated in training (cricketers and non-cricketers) improved in DVA by 41 deg/sec in contrast to the improvement in the non-training subjects of 18 deg/sec (p=0.0032). The cricketers who participated in the training improved in DVA by 44 deg/sec, whereas the cricketers who did not participate in the training improved by 19 deg/sec (p=0.0167).
Conclusions: We found no significant difference in initial DVA between the cricket players and the non-cricket players. The training resulted in an extremely significant improvement in DVA performance by both the cricketers and non-cricketers.
Keywords: cricket, dynamic visual acuity, sports vision, vision training
Introduction
Sports vision is still a fairly new area of optometric research. Although there are many different visual attributes to consider, dynamic visual acuity (DVA) has been proven repeatedly to be important when considering sports vision.1-8 Dynamic visual acuity is the ability of an
observer to correctly identify details of a moving target. Factors that can influence DVA fall into two main categories: stimulus parameters and
on the fovea.1,9 This is the main reason why
DVA reduces as the angular velocity increases. If the subject is able to move their head, this reduces the need for saccadic movements, and DVA improves in comparison to fixed head measurements.1
In many parts of the world, cricket is a major summer sport with a very strong following. It involves people of all ages, and it is considered quite an honour to represent your school, province, or country. As with baseball, basketball, and many other sports which require hand-eye coordination, the visual demands of cricket need to be considered so that relevant visual testing can be conducted.
The most visually demanding cricketing skill is batting. A batsman needs to be able to identify qualities of a cricket ball coming at them at speeds of up to 150 km/h. The direction and positioning of the seam coupled with where the ball comes out of the bowler’s hand can directly influence the path of the delivery. Anticipation of where the ball will land and what direction it will bounce influences
the shot selection for batsmen.10 Coaches
often advise their batsmen of the importance of watching the bowler just before and during his run-up to pick up any postural cues to identify the position of the seam and shiny or rough side of the ball in order to be able to predict what delivery is about to be bowled.11
Graham Gooch, former England cricket captain and batting coach, suggests that batters A video explaining the basics of cricket.
concentrate on looking at the bowler as he runs in, look at his arm, then look at the ball.10
As there is relative movement between the observer (batsman) and the object of interest (cricket ball), DVA has been reported in the literature as being the most important aspect to consider in sports vision.2 It has been said that a good batsman must have “fast eyes.”10
Another important attribute of playing cricket is the ability to be able to catch a ball when it is travelling towards you. Sanderson and Whiting3 have studied catching ability and visual attributes such as static and DVA. Their conclusion was the better the DVA, the better a person was at catching a tennis ball.
The most common method of measuring DVA is to present a moving target (such as a Landolt C) across a screen. The participant must then identify the orientation of the gap in the C.1,5,7,12 Another method used is to project
a tennis ball at a person in darkness. The ball is then lit up for approximately 800msec and then plunged back into darkness. From this short view, the path of the tennis ball should be predicted, and thus the ball should be caught.3 The theory behind this type of method
is that accurate perception of moving objects requires efficient oculomotor adjustments that only occupy a short time. When exposure time is limited, these compensatory eye movements are critical, and hypothetically, exceptional atheletes involved in fast ball sports possess this control to process the information under dynamic conditions.
There is conflicting evidence in the literature when it comes to assessing whether DVA is better in athletes than non-athletes. Many experiments have shown that DVA is in fact significantly better in athletes than non-athletes.1,4,5 Beals et al.5 found a significant
correlation between shooting performance and DVA in basketball players; however, his use of certain statistics has been queried.6 The one
factor that can strongly be concluded from his study regardless of statistical analysis is the importance of DVA in relation to basketball
shooting. Ishigaki and Miyao12 found no
difference in DVA between athletes (fast ball sports such as baseball, tennis, and badminton) and non-athletes when large Landolt C targets were used; however, when smaller targets were used, the athletes had significantly better DVA.
Morris and Kreighbaum7 compared DVA of
high and low percentage basketball shooters. They found no significant difference between those player groups. However, comparison of the variability of DVA between high and low percentage shooters showed less variability in the higher percentage shooters. The main reason their research tends to contradict the previously mentioned work1,4,5,12 about
differences in DVA is due to their lack of a non-athlete control group.
Long and Riggs13 were the first to compare
DVA with free head rather than fixed head viewing. They however found no difference between the athletes and the non-athletes. Free head viewing is more representative of real world situations, so optometrists who favour a more behavioural approach may consider this a more appropriate experimental design.
Much of the literature concerning visual training has shown positive effects on visual attributes.8,13-15 Fergenson and Suzansky16
showed that repeated measures as a way of training significantly improved DVA in eight of their sixteen different testing conditions. Training effects were more remarkable in those who had the worst DVA prior to training.14
There are commercially available training programmes that claim to be able to improve visual attributes which correspond to better sporting performance. Two studies have been done to test the claims of these programmes.
Long17 found no significant difference in
DVA between those who participated in the training programme (Eyerobics) and those
who did not. Wood and Abernathy18 tested
other training programmes and found a significant improvement in DVA by those who had trained their skills. The difference in outcomes of the above studies could be due to expeirment design, with Long17 only having
4 pre-set speeds to measure DVA rather than an incremental speed variance to measure DVA more accurately. Despite measuring an improvement in DVA with training, Wood and Abernathy18 could not conclude that this
improvement resulted in improved sporting performance. It is difficult to assess improved sporting performance due to the number of variables involved.
Methods and Procedure
Subjects
Subjects were divided into two groups: those who play cricket competitively and those who do not participate in the sport at all (or any other similar sports that require
good eye hand co-ordination such as tennis, squash, and hockey). The cricketers were recruited, with the help of Auckland Cricket, partly from the Auckland under-19 winter development training squad (5) and other people known to the testers who played cricket (8). There were 6 specialist batsmen, 4 allrounders, and 3 bowlers participating in this study (Figure 1).
The other group (non-cricketers/control) were drawn mainly from the University of Auckland Department of Optometry and Vision Science, both students and tutors. There were 18 subjects in this group. All subjects in both groups were male, as there is a proven difference found in DVA between males and females.19 As
age can affect DVA,19 a minimum age of 17 was
put in place. This is two years above the age (15) at which mature DVA levels are reached.
All subjects were fully informed of the procedures after reading the Participant Information Sheet and were encouraged to ask questions. Once they were confident that they understood what was required, they signed consent forms and then answered a questionnaire relating to their ability at cricket and any existing visual correction. The University of Auckland Human Subjects Ethics Committee approved the research - ref: 2002/043.
Methods
The methods used were based on the research and procedures of Rouse et al.1 Targets
were projected onto the wall from a slide projector via a motorised rotating mirror (Figure 2). The distance between the projector and the
motorised mirror was 2 m. The apparatus also included a shutter that enabled the target to be seen for only 600 msec so that the subjects couldn’t track the target around the room. The rotating mirror was able to rotate both clockwise and anti-clockwise so that the rotation direction could be randomised. This was done in order to counter lab artificiality and to make the measurements more real.
The targets used to project onto the wall were Landolt C targets surrounded by confusion bars. The size of the gap on the wall was 2.5 mm, and the subject viewed this from 3 m. This target was equivalent to a 6/15 letter. We kept the target size the same throughout the experiment and varied the speed in order to determine DVA.
The orientation of the targets was randomly assigned, and subjects were asked to identify in which direction the gap in the C appeared. This was a four-alternative forced-choice method. The threshold for measuring DVA was set at 4 out of 5 (80%) correctly identified targets.
All testing was conducted in the same room at the medical school with consistent lighting conditions. The room luminance at Table 1: Results of each subject for initial DVA comparisons
Non-Cricket Players Cricket Players
Subject # DVA (deg/sec) Subject # DVA (deg/sec)
1 90 1 110
2 110 2 120
3 80 3 100
4 120 4 130
5 130 5 110
6 140 6 100
7 120 7 130
8 60 8 110
9 80 9 100
10 100 10 90
11 110 11 100
12 100 12 90
13 100 13 110
14 130
15 140
16 120
17 100
18 70
Mean 105.5 Mean 107.7 SD 23.32 SD 13.01
the participant was 80 cd/m2 and at the screen was 40 cd/m2. The subject viewed the targets starting at the highest speed. This speed was decreased until the subject’s threshold was reached.
If the subject was interested in participating in the training aspect of this study, they were asked back for two training sessions. These two sessions were identical to the initial measurement and were scheduled three weeks apart. These sessions would generally take 20 minutes. Once the training was completed, all the subjects were asked back for a second measurement of DVA to ascertain if there had been any improvement in DVA for those who had been in training in comparison to those who did not participate in the training.
Results
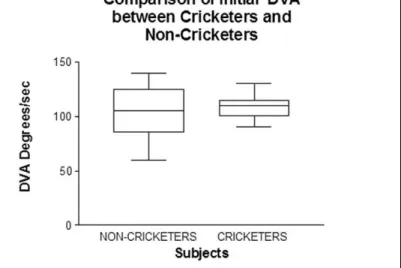
The initial DVA for the individual subjects is shown in Table 1. The mean DVA of the cricket players is 107.7 deg/sec with a standard deviation (SD) of 13.01 and a standard error of measurement (SEM) of 3.608. The SEM indicates the accuracy of the measurements, whereas the SD measures the spread of the results. The mean DVA of the non-cricket players was 105.5 deg/sec with a SD of 23.32 and a SEM of 5.496. Comparison of the mean DVA of these two groups with an unpaired t-test shows no significant difference (p>0.05)
(Figure 3). The shorter inter-quartile ranges for the cricket players demonstrates less variability in measurements, backed up by the lower SD and SEM. The whole range of results for the cricketers almost falls within the upper to lower quartile range for the non-cricketers.
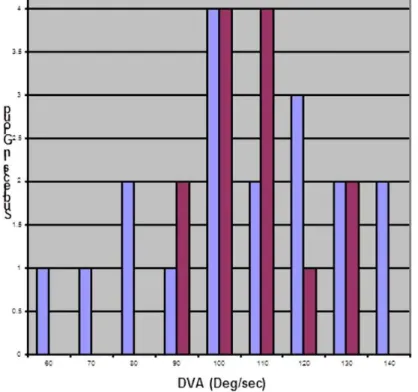
Figure 4 is a cumulative frequency histogram and indicates the greater spread of results of the non-cricketers. The cricket players’ results are all within a 40 deg/sec range, in comparison to the non-cricketers, whose results fall within an 80 deg/sec range. This small spread of results is further evident in Figure 5. At an angular velocity of 110 deg/sec, 78% of the cricketers have a lower DVA in comparison to the non-cricketers, where 60% have a lower DVA. Now looking at 90 deg/sec, the roles are reversed. At this angular velocity, 18% of the cricketers have a lower DVA, but 28% of the non-cricketers have a lower DVA.
We also investigated the difference in initial DVA between batsmen and bowlers. Table 2
Figure 3: Comparison of Initial DVA between Cricketers and Non-cricketers
Figure 4: Cumulative frequency of initial DVA results
Table 2: Results of Initial DVA for different
Cricketing Specialities
Batters Bowlers Allrounders
110 100 130
120 110 100
130 110 90
110 100
100 90 110
shows the results for the individual specialities. The mean DVA for batsmen was 110 deg/ sec. The batsmen represented almost half of the cricketer group. The mean for the cricket players as a group was lower than this mean for batsmen. The mean DVA for the bowlers was 106.7 deg/sec, and the mean for the allrounders was 105 deg/sec. It is hard to compare these groups as the sample size is very small. The batsmen have the same spread of results as the cricketers, 90 to 130 deg/sec. The bowlers have very similar results to each other, with a range of 100 to 110 deg/sec.
Table 3 shows the results of the training. Ten subjects were able to participate in the training. Twenty subjects were unable to participate but were able to return for a second baseline measurement. One subject from the initial measurement was unable to return for the second measurement and thus is not included in the training results analysis.
Within the training group, there were eight cricket players and two non-cricket players;
likewise in the non-training group, there were 16 non-cricket players and four cricket players. The mean DVA for the training group after participating in the training was 146 deg/sec with a SD of 6.99 deg/sec and SEM of 2.211. Those subjects who could not participate in the training still improved at the second measurement (mean DVA of 124 deg/sec). Figure 6 displays the improvement seen in both the training and non-training groups. This graph shows an obvious increase in the DVA of those who participated in the training Table 3: Training results for each subject
Training Non-Training
Subject # Initial DVA (deg/sec)
Final DVA (deg/sec)
Subject # Initial DVA (deg/sec)
Final DVA (deg/sec)
1 100 150 1 100 140
2 100 150 2 100 140
3 90 150 3 110 120
4 120 150 4 70 120
5 110 150 5 100 100
6 120 150 6 80 110
7 110 130 7 60 100
8 100 150 8 120 110
9 90 140 9 140 150
10 110 140 10 130 140
11 90 120
12 80 100
13 120 140 14 130 150 15 140 130
16 100 70
17 130 150 18 110 140 19 110 120 20 100 130 Mean 105 146 Mean 106 124 SD 10.8 6.992 SD 22.57 21.13 SEM 3.416 2.21 SEM 5.05 4.72
Figure 5: Comparison of DVA in cricketers and non-cricketers
and also the improvement seen by those who did not participate in training. A learning curve could explain the improvement by those not undergoing training.
Statistical analysis of the the improvement with training was performed to show the significance in improvement at each visit. T-tests comparing each individual training session to initial DVA were performed and showed the p-values listed in Table 4. The data within this group is matched as it is the same subjects at each visit. Due to this, the analysis of this data is more powerful and significant of a true training effect. Interestingly, there is no significant improvement in the DVA measured between the first and second visits, but the improvement starts by the third visit in relation to the first visit. T-test analysis of these results shows an extremely significant improvement in DVA between the first and final visit of the training cricket players (p<0.001).
We also looked at the DVA at each individual session in comparison to the one before it. Each session showed an improvement in DVA, but there was no significant difference in this improvement until comparing the fourth and final sessions to the third (p=0.0499). Graphical
analysis of these individual sessions is shown in Figure 7.
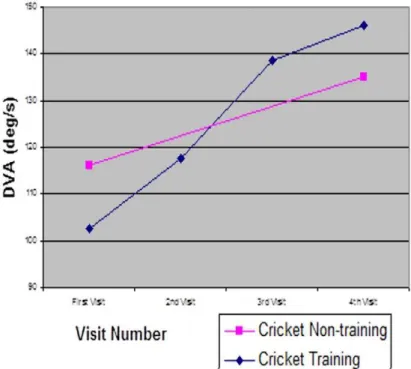
Analysis of the training of cricket players only was also performed. Table 5 demonstrates the values for this group. There is one cricketer who could not return for the final comparison measurement of DVA. The results show a higher DVA in the initial measurement of the non-training subjects; however, this difference is not significant. These results and the significant improvement in the training cricket players are further backed up in Figure 8.
Figure 7: Changes in DVA at each training session
Figure 8: Comparison of DVA in cricketers with and without training
Table 4: p-Values to compare training
Improvements Between Sessions
p-Value
Second Session 0.1127 not significant Third Session 0.0002 statistically significant Final Session <0.001 statistically significant
Table 5: Table of results for training and
Non-Training of Cricket Players Non-Training
DVA Initial visit (deg/sec)
DVA Final visit (deg/sec)
DVA Initial visit (deg/sec)
DVA Final visit (deg/sec)
100 150 130 150
100 150 110 140
90 150 130
120 150 100 130
110 150 110 120
90 140
110 130
100 150
The difference in DVA between the training and non-training players was statistically signif-icant (p=0.0167), although the sample size of the cricketers involved in both groups is small and would have to be much larger to make real comparisons in the difference in mean DVA after the training. The mean DVA of the overall training group (with cricketers and non-crick-eters in each group) was also compared with the mean DVA of the non-training group. The difference between the two means is 22 deg/ sec but is deemed not to be a statistically significant difference (p>0.05). To find a statisti-cally significant difference with our sample size, the difference in DVA would have had to be at least 29 deg/sec, or we would have needed larger sample sizes, approximately 30 in each group (ascertained using Stat Mate programme). It is difficult to make comparisons between the overall training and non-training groups as they are poorly matched with both cricket players and non-cricket players in each group.
Discussion
In this study, the cricket players had a mean DVA 2.2 deg/sec higher than the control group. While we cannot make broad claims due to the limitation in sample size, in this study, a statistically significant difference in DVA between those people who played cricket and those who did not was not found. Our results are not the same as previously published work in the area of DVA.1,4,5,12
It is fairly hard to make any major conclusions from this work, as the sample size was very small; thus, it is more difficult to ascertain statistically significant differences. One possible explanation for the lack of significance in comparison to other studies is that previous research has always used college athletes or those who have exceptional abilities. Less than half our cricketer group was from the Auckland Under-19 Development Squad, and the rest were friends of the researchers. Although the cricket players from
the Auckland squad are undoubtedly the calibre of college athletes, the remainder of the group may not have been.
We found a significant statistical difference in the DVA of those participants in the training group between their first measurement and their last measurement using t-test statistical analysis. A limiting factor in our training study was the inability of the motor to rotate the target faster than 150 deg/sec. We believe that we could have found an even greater improvement in DVA with training had we been able to get the target to move faster. If this faster speed had been available, we may have found a statistically significant difference between the mean DVA of the training group and the non-training group at the final measurement. The difference we found was 22 deg/sec, and we needed to find a difference of 29 deg/sec with our sample size to find a statistically significant difference.
The experiment set-up we used was similar to that used by Rouse et al.1 In that particular
study, the target used was 6/9 Snellen equivalent acuity. Our target was larger (6/15) but had confusion bars surrounding the C. As confusion bars were added, the target was made bigger, as the task was effectively harder. In comparison to Rouse et al., the task
might have been made too easy.1 When the
target was bigger, the difference between the athletes and non-athletes was not significant.7
needed a screen that was curved with a radius of 2 m. This blur was constant for everybody; however, an individual’s tolerance of blur is not constant, so this adds another potential error in measurement.
Training of DVA produced a significant improvement by those who participated in the training. This confirms findings previously documented in the literature that suggest that training has a positive impact on visual skills.8,13-16
The improvement in DVA was not merely due to familiarity with the test. When analysed, there was not a significant difference in DVA between the first and second visits (p=0.1127), but the improvement started from the third visit and improved further by the fourth and final visit (p<0.001). This is further backed up by the fact that those subjects who could not participate in training but who returned for a second measurement to make comparisons had an improvement in DVA, indicative of familiarity, but this improvement was not significant.
Future studies should look to investigate the transfer of these improved DVA skills to on-field game skills and performance. An extension to this research would be to measure the ability of cricket players to identify seam location and orientation of a cricket ball delivered at different speeds pre- and post-training of DVA. The expected improvement in seam identification should directly translate to improved on-field performance, as this is a specific skill required for batting performance. It is not just batting, though, that requires good DVA. The improved skills should also improve the abilities of catching and throwing to targets whilst moving.
Conclusions
We found there to be no significant difference in DVA between cricket players and non-cricket players at the initial visit. Small sample sizes and a lack of high-performing cricket players in our study may have contributed to this. What we did find from this study was that there is certainly an improvement in DVA with training that is above
the expected learning curve and familiarity with repeated measures testing. This is the more significant finding from this study. Both groups had an improvement in DVA on repeated measures, indicating a familiarity improvement. At the third and fourth measurements, the training group made the most gains in their improved DVA. Future directions for this study would be to look at translating this improved DVA to improved on-field performance. If these future studies could prove increased on-field performance following DVA training, this DVA training should become a standard addition to a cricket player’s training programme.
References
1. Rouse MW, Deland P, Christian R, Hawley J. A comparison study of dynamic visual acuity between athletes and non-athletes. J Am Optom Assoc 1988;59: 946-50. http://1.usa.gov/1yiiIaq
2. Sherman A. Overview of research information regarding vision and sports. J Am Optom Assoc 1980;51:661-5. Citation only: http://1.usa.gov/1O6fnNI
3. Sanderson FH, Whiting H. Dynamic visual acuity and performance in a catching task. J Mot Behav 1974;6(2):87-94. http://bit.ly/1IFBNa5
4. White VW. Visual acuity versus visual skill in athletic performance. California Optom 1977;3(6):22-3.
5. Beals RP, Mayyasi AM, Templeton AE, Johnson WL. The relationship between basketball shooting performance and certain visual attributes. Am J Optom Arch Am Acad Optom 1971;48:585-90. Citation only: http://1.usa.gov/1FEJVa4
6. Dippner R. The relation between basketball ability and visual acuity in the unicorn. Am J Optom Arch Am Acad Optom 1973;50:656-61. Citation only: http://1.usa.gov/1DaS81U
7. Morris GS, Kreighbaum E. Dynamic visual acuity of varsity women volleyball and basketball players. Res Q 1977;48:480-3. http://bit.ly/1OrmwtW
8. Stine CD, Arterburn MR, Stern NS. Vision and Sports: A review of the literature. J Am Optom Assoc 1982;53:627-34. Abstract only: http://bit.ly/1CO1LA8
9. Westheimer G. Eye movement responses to a horizontally moving visual stimulus. Arch Ophthalmol 1954;52:932-41. http://bit.ly/1NxemTS
10. Barras N. Looking While Batting in Cricket: What a Coach Can Tell Batsmen. Coaching Manual. http://bit.ly/1OySuFG. Last Accessed March 2, 2015.
11. Canaway I. 6 Simple, Fool-Proof Cricket Batting Tips. http://bit. ly/1BM5q0G. Last Accessed March 2, 2015.
13. Long GM, Riggs CA. Training effects on dynamic visual acuity with free head viewing. Perception 1991;20:363-71. http://bit. ly/1aITEi1
14. Long GM, Rourke DA. Training effects on the resolution of moving targets - dynamic visual acuity. Human Factors 1989;31:443-51. http://bit.ly/1GD0T91
15. Ludvigh E, Miller JW. Some effects of Training on Dynamic Visual Acuity (Project no. NM 001 075.01.06) Pensacola, FLA: U.S. Naval School of Aviation Medicine. Sept 1954. http://bit. ly/1OrmXEC
16. Fergenson PE, Suzansky JW. An investigation of dynamic and static visual acuity. Perception 1973;2:343-56. http://bit. ly/1GD0V0w
17. Long GM. Exercises for training vision and dynamic visual acuity among college students. Percept Mot Skills 1994;78:1049-50. http://bit.ly/1IX9Ozn
18. Wood JM, Abernethy B. An assessment of the efficacy of sports vision training programs. Optom Vis Sci 1997;74:646-59. http://bit.ly/1aWyu0q
19. Hoffman LG, Rouse M, Ryan JB. Dynamic visual acuity: A review. J Am Optom Assoc 1981;52:883-6. Citation only: http://1.usa. gov/1Orn9Uo
Correspondence regarding this article should be emailed to Renee Edgar at [email protected]. All statements are the authors’ personal opinion and may not reflect the opinions of the representative organizations, ACBO or OEPF, Optometry & Visual Performance, or any institution or organization with which the author may be affiliated. Permission to use reprints of this article must be obtained from the editor. Copyright 2015 Optometric Extension Program Foundation. Online access is available at www.acbo.org.au, www.oepf.org, and
www.ovpjournal.org.