Development of a Novel Mixed Titanium, Silver Oxide Polyacrylonitrile Nanofiber as a Superior Adsorbent and its Application for MB Removal in Wastewater Treatment
Texto
Imagem


Documentos relacionados
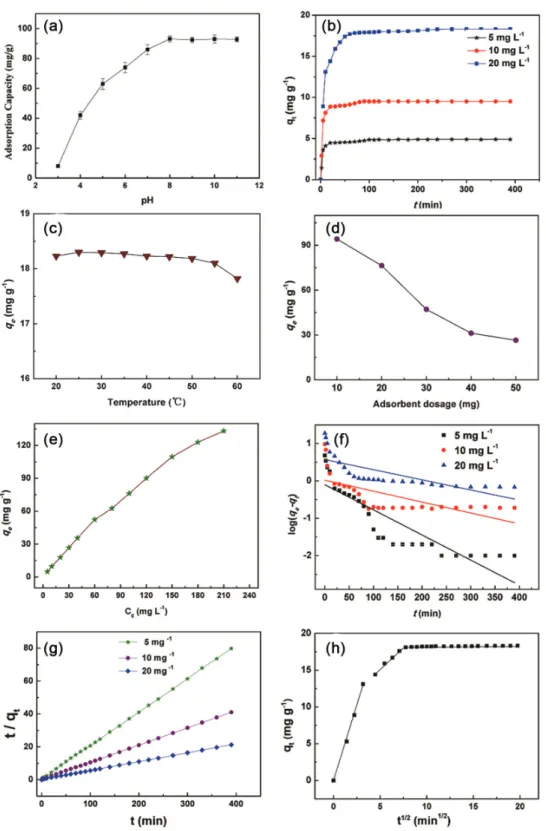
To optimize the adsorption of DOX on MWNTs-PEG, the effect of independent variables, (i.e., pH, contact time, adsorbent dose and initial concentration) on dependent variables,
In the isotherm study, adsorption experiments were carried out using various initial Pb II concentrations and optimum conditions of adsorbent dosage, contact time and pH..
A.13 Net adsorption equilibrium isotherms of CO 2 at 30ºC on the sample A1 (binder- less MIL-53(Al) pellets compressed at 1tf) Closed symbols denote adsorption data and open
composites) to remove MG from an aqueous solution under different experimental conditions, such as initial pH, contact time, temperature, dye concentration and biosorbent dosage..
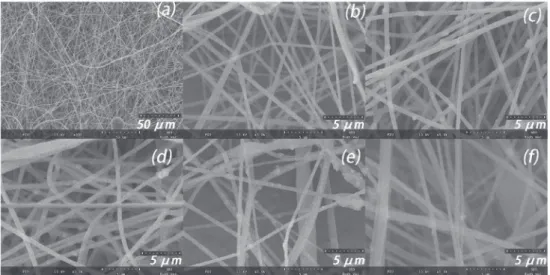
As shown in Figures 2b and 2c, PPT beads showed a smooth and porous surface before adsorption, which contributed to MB molecules Figure 1.. FTIR spectra of PVA, PPT and
In the present work, the removal of the cationic dyes, methylene blue, MB, and gentian violet, GV, from aqueous single dye solutions using SCB 2 ( Fig.. The adsorption studies
21 Check image (a) used to obtain centre shift and ratio image (b) used to obtain output change and uniformity change (resolution: 18 cm x 18 cm; gantry angle: 0 ◦ ; collimator
Adsorption equilibrium data is represented by isotherms or isobars, which describe adsorbed phase concentration (g or mol per unit mass adsorbent) as a function of
