Artigo
*e-mail: [email protected]
FLOW ANALYSIS-HYDRIDE GENERATION-GAS PHASE DERIVATIVE MOLECULAR ABSORPTION SPECTROPHOTOMETRIC DETERMINATION OF ANTIMONY IN ANTILEISHMANIAL DRUGS
Máximo Gallignani y María del Rosario Brunetto
Departamento de Química, Facultad de Ciencias, Universidad de Los Andes, Apartado postal 440, Mérida 5101-A, Mérida, Venezuela
Fernando Ovalles*
Departamento de Análisis y Control, Facultad de Farmacia, Universidad de Los Andes, Mérida 5101-A, Mérida, Venezuela
Recebido em 21/2/08; aceito em 25/8/08; publicado na web em 26/1/09
In the present work, the development of a method based on the coupling of low analysis (FA), hydride generation (HG), and derivative molecular absorption spectrophotometry (D-EAM) in gas phase (GP), is described in order to determine total antimony in antileishmanial products. Second derivative order (D2
224nm) of the absorption spectrum (190 – 300 nm) is utilized as measurement criterion. Each one of the parameters involved in the development of the proposed method was examined and optimized. The utilization of the EAM in GP as detection system in a continuous mode instead of atomic absorption spectrometry represents the great potential of the analytic proposal.
Keywords: gaseous phase UV molecular absorption spectrophotometry; antimony; leishmaniasis.
INTRODUCTION
The pharmaceutical literature on antimony mainly deals with the use of organic compounds as chemotherapeutic agents. It has lapsed almost a century from the introduction of organic antimonials into the treatment of leishmaniasis. This parasitic disease is widespread in the world. The World Health Organization (WHO) estimates a worldwide annual incidence of about 12 million and a population of 350 million people at risk of acquiring one of the forms of the disease.1 Sodium stibogluconate (Pentostam ) and meglumine anti-moniate (Glucantime) are the pentavalent antimonial drugs of choice in the treatment of leishmaniasis. In Venezuela, another pentavalent antimonial drug for the treatment of leishmaniasis is also used. This drug called Ulamina is synthesized from antimony pentachloride and N-methyl glucamine (meglumine).2
Conidence knowledge of the antimony content in the phar-maceutical formulations is very important for prescribing the right dose. Stibiointoxication cases have been reported.3 Although being old medicines, safety and quality control of these drugs have not been comprehensively evaluated so far.4,5 Thus, the development of simple, low cost, fast methodologies is important, especially for developing countries.6
Several analytical methodologies have been developed for the determination of antimony in different aqueous and solid matrices, which have been reviewed by different authors.7-10 Formation of volatile SbH3 (hydride generation, HG) followed by its determina-tion is a common practice in low-injecdetermina-tion atomic spectrometry using absorption (AAS) or emission with inductively coupled plasma (ICP-AES)11 as the detection technique. A good deal of research on antimony has been, and continues to be, devoted to trace analysis of antimony.8 However, the hyphenated instrumental techniques used for that purpose are usually sophisticated and expensive.
Works on antimony in formulated dosage forms are scanty. In this context, the analytical methods reported by the specialized literature dealing with the determination of antimony in
pharmaceuti-cal products are based -mainly- on redox reactions. In this fashion, Bloomield et al.12 developed a method using low injection analysis (FIA) for determining Sb(V) in sodium stibogluconate. Franco et al.13 established a chemical method for the determination of the levels of antimony to investigate proprietary formulas used to treat leishmaniasis by differential pulse polarography and iodine titration. Adsorptive stripping voltammetry using pyrogallol as a complexing agent has also been proposed for antimony speciation in commercial samples containing meglumine antimoniate.14
Meglumine antimoniate is mentioned in the Brazilian Phar-macopoeia15 whereby a HG-AAS method is recommended for its determination, whether in its pure form or in injectable. Flores et al.16 also reported the determination of Sb(III) and total Sb by HG-AAS in samples of injectable drugs used for leishmaniasis treatment. Later on, Flores et al.17 described a procedure for the selective determination of Sb(III) in antileishmanial drugsby HG-AAS using a low injection system. More recently, metal furnace heated by lame as a hydride atomizer for AAS was proposed for determining total antimony in pharmaceutical samples containing meglumine antimoniate.18 Unfor-tunately, voltammetry, polarography and AAS are in a few special cases valuable tools in most of the oficial pharmacopoeias when they are compared to titrimetric, spectrophotometric and chromato-graphic methods.19
Spectrophotometry, due to its simplicity, is by far the most wide-spread method of analysis and is also used in antimony determination in pharmaceuticals.20-24 Spectrophotometry with bromopyrogallol red has been proposed to determine Sb(V) in pharmaceuticals.20,21 How-ever, it involves several stages and lengthy pre-treatment of samples and some knowledge about the mathematical approaches which are not in common use in routine analysis.21 Gallignani et al.25 devel-oped a low analysis -hydride generation- Fourier transform infrared coupled system (FA-HG-FTIR) for the determination of antimony in pharmaceuticals being its major weakness the low sensitivity as compared to many available methods.
absorption spectrometry (GPMAS).26 It was introduced for the irst time in 1973 by Sity.27 This technique involves the separation of the gaseous phase from the liquid phase using a gas-liquid separator and then is sweeping it into a low through cell, which has been positioned in the cell compartment of an UV/Vis spectrophotom-eter.28 Recently, Gallignani et al.29 developed a method to determine Sb(III) in homeopathic products using FA-HG-GPMAS. The major weakness of that method is the low sensitivity (in mg L-1 working range) as compared to many available methods based on AAS or ICP-AES, which have a working range in µg L-1 or below. However, because pharmaceutical products containing organo-antimonials are formulated with relatively high content of antimony (80-100 mg L-1) the proposed method could be very useful. On the other hand, conventional spectrophometer is common and less expensive equipment than AAS or ICP-AES.
Based on the above statements we have further developed the system proposed by Gallignani et al.29 but utilizing a modiication of the manifold and chemical parameters to allow the routine de-termination of total antimony in antileishmanial drugs. To the best knowledge of the authors, no work has been reported for the antimony determination in pharmaceutical samples by using a FA-HG-GPMAS coupled system. The effect of mineralization/oxidation of the organic pentavalent antimony of the samples, pre-reduction and hydride generation were optimized and adapted to the experimental manifold proposed in the present work.
EXPERIMENTAL
Apparatus
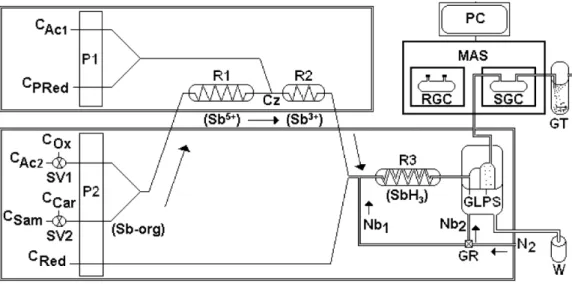
The FA-HG-GPMAS system used in this work is shown in Figure 1S (Supplementary material). It was mainly assembled from commercially available instruments and accessories. The continuous low system consisted of an IPC peristaltic pump (P1) from Ismatec (Glattbrugg, Switzerland) of four channels in conjunction with a Varian HG system, Model VGA-77 (Springvale, Australia), which contains three channels peristaltic pump (P2); both pumps furnished with Tygon tubes for the transport of reagents and samples (CAc, CPRed, COx, CSam, CRed, respectively), and three PTFE reaction coils (R1-R3). The Varian HG system incorporates a gas-liquid phase separator (GLPS), and provides a regulated supply of nitrogen divided into two branches (Nb1 and Nb2). The manifold includes a Rheodyne (All-tech, Waukegan, USA) manual selecting valve (SV), which permits the selective introduction in the system of either the carrier (CCar) or the sample (CSam). A home made gas trap (GT) was used to eliminate the toxic stibine gas.25All measurements were made with a Perkin Elmer, Model Lambda 20, double beam spectrophotometer (Norwalk, CT, USA). The instrument was equipped with two Wilmad -10 x 2 cm- quartz low cells (Buena, NJ. USA) placed in the optical path of the conventional UV/Vis spectrophotometer. A PC 586 equipped with a Perkin Elmer UV-WinLab Software was used for controlling the instrument and for data acquisition. Further details are given in Table 1S and Figure 1S.
Reagents
All chemicals were of analytical-reagent grade from either Riedel-de Haën Sigma-Aldrich (GMBH Seelze, Germany) or J. T. Baker (NJ, USA), unless another source is indicated. Milli-Q water (18 MΩ cm-1) was obtained from a Milli-Q puriication system (Millipore Corporation, USA). It was used to prepare all solutions and to rinse the previously cleaned laboratory material. Stock standard solution (1000 µg mL-1) of trivalent antimony was prepared by dissolving
an-timony potassium tartrate (C8H4K2O12Sb2·3H2O from Riedel-de Haën, Hannover, Germany) in 0.5 mol L-1 tartaric acid. Working standard solutions were prepared by serial dilution of the stock solutions with water, immediately before use. Standard solution (500 µg mL-1) of pentavalent antimony was prepared by dissolving potassium pyro -antimoniate (K4Sb2O7 from General Chemical Division, AC&DC, NY, USA) in boiling water, cooled, and inally diluted with cold water. Working standard solutions of Sb(V) were prepared daily by serial dilution of a intermediate solution (20 µg mL-1) with water. The N
2 used in this work was supplied by AGA (Maracaibo, Venezuela) with a certiied purity of 99%.
Drug samples
Three samples of the same lot of a commercial sample of meglu-mine antimoniate (Glucantime from Aventis Pharma Ltda, Brazil), here called GCT-1, GCT-2 and GCT-3 were used in this work. These samples are manufactured in ampoules of 5 mL containing 1.5 g of meglumine antimoniate equivalent to 0.405 g of Sb(V). Two samples of Ulamina from the same lot, called here as ULM-1 and ULM-2 were also used in this work. The dosage form of ULM is 10 mL unit dose vial of solution for injection with a nominal content under clinical study of about 0.100 g Sb(V). These last samples were kindly provided by the manufacturer (Centre of Parasitological Research José Wi-tremumolo Torrealba, University of Los Andes, Mérida-Venezuela). The whole content of one ampoule (either 5 or 10 mL, respectively) was always diluted up to 1000 mL with water. Afterwards, for the determination of total antimony, intermediate solutions of samples were sonicated for 10 min and diluted up to 20 µg Sb mL-1 with water. Samples within the dynamic linear calibration range were prepared at 5 µg Sb mL-1 by appropriate dilution with water. The working sample solutions were prepared the same day of the analysis.
Standard addition studies were carried out by adding various aliquots (0, 5, 10, 15 and 20 mL, respectively) of a Sb(V) standard solution (20 µg mL-1) to 50 mL of a sample solution containing a ixed amount of pentavalent antimony (about 2 µg mL-1). This procedure was carried out using either GCT samples or ULM samples. Spiked parenteral pharmaceutical formulations were prepared following the above procedure.
Procedure
triplicate. The baseline is established switching SV2 to the position of the carrier solution (CCar) keeping SV1 in the acid medium position (CAc2). During this step, the reference gas cell (RGC) and the sample gas cell (SGC) in a continuous low mode are cleaned and illed. After 3 minutes, the RGC is sealed and the SGC connected to the gas trap (GT). In this way, blank solution (all reagents) is introduced into the system.
RESULTS AND DISCUSSION
Preliminary tests
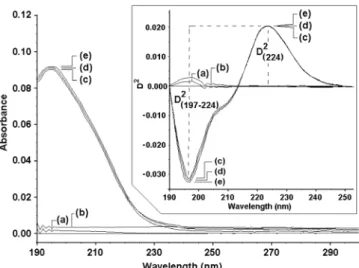
The previous test and the optimization -using the proposed FA-HG-GPMAS system- were carried out using standard solution of 5 µg Sb(III) mL-1, standard solution of 5 µg Sb(V) mL-1, sample solutions of GCT of 4.86 µg Sb(V) mL-1 (nominal content) and ULM with a nominal content equivalent to 5 µg Sb(V) mL-1, unless otherwise stated. The absorption spectra of SbH3 were acquired in a continuous mode between 190 and 300 nm. A scan speed of 960 nm with 1 nm of nominal resolution was selected in this study as a compromise between analysis time and sample/reagent consumption by FA. Figure 1, shows representative gaseous SbH3 UV-spectra from each species under study: (a) gaseous blank; (b)-(f) pentavalent antimony standard solutions at different concentrations; (g) standard solution of trivalent antimony; (h) sample solution of GCT; and (i) sample solution of ULM. As it can be seen, the gaseous blank (Figure 1a) has good transparency in the showed spectral region, while the UV spectra of the gaseous SbH3 generated from Sb(V) and Sb(III) standard solutions at different concentrations (Figures 1b-g) show a broad band below about 240 nm, with a maximum absorption well deined at 195 nm. No maximum wavelength displacements were observed by modifying the antimony concentration. The analyzed samples showed the same pattern as the standards (Insert in Figure 1). Nevertheless, slight baseline displacements in the absorption spectra were observed.
The quantiication of antimony in the described spectral system could be carried out -in principle- using the absorbance at 195 nm corrected by means of an horizontal baseline established at 250 nm (Insert in Figure 1). However, the absorption maximum of gaseous
SbH3 is located close to the instrumental spectral limit, which is 190 nm. Additionally, it is evident that by using the described instru-mentation, it is not possible to know the behaviour of the absorption band at wavelength lower than 190 nm. Keeping this in mind, the alternatives offered by the derivative spectroscopy were explored. As it is known, derivative spectroscopy is a powerful tool in UV-molecular absorption spectrophotometry to minimize the effects of the spectral interferences and baseline displacements. Initially, all the instrumental available derivative spectra (D1 - D4) were explored. From this last study, we concluded that second-order derivative spec-troscopy (D2) provides a more complete view about the behaviour of the stibine zero-order derivative spectrum (D0). Insert in Figure 2 shows a representative spectra D2 of SbH
3 generated from a Sb(V) standard -previously reduced-, recorded at different working times (3, 10 and 25 min, respectively). Certainly, the second order derivative spectra (D2) showed an automatic correction of the displacement of the absorption spectra in regard to the baseline as the time of analysis lapses (Figure 2).
In order to select a deinitive measurement criterion, two D2 potential analytical signals were evaluated: the absolute value of the peak (224 nm) to valley (197 nm) or [D2
(224-197 nm)]; and the value of the peak to zero baseline or [D2
(224 nm)]. The experimental determination was carried out evaluating all the analytical signals using a standard of 5 µg Sb mL-1 (n= 20). The preliminary results clearly indicated the viability of using the peak to zero baseline of the second-order derivative [D2
(224 nm)] as measurement criterion for the determination of total antimony.
Complementary studies were carried out to select the appropriate smooth conditions by using different derivative windows -offered by the used UV-WinLab software- between 5 and 41 points. A value of 15 was selected as a commitment among the peak height (sensitivity), the band-shape, and the precision of the analytical signal.
As inal preliminary tests, the nature and concentration of the dissolution medium of the samples were investigated because the yield of the stibine is highly dependent on these parameters. Relatively concentrated HCl has been the common acid medium used in HG.30
Figure 1. Representative UV absorption spectra of SbH3(g) evolved from Sb presents in both standard and sample solutions: (a)-(f) standard solutions containing, 0.0, 2.0, 4.0, 6.0, 8.0, and 10.0 µg Sb(V) mL-1, respectively, (g)
standard solution containing 4.0 µg Sb(III) mL-1, (h) sample solution of GCT
containing about 4.86 µg Sb mL-1, (i) sample solution of ULM containing about
5.0 µg Sb mL-1. Insert: representative spectra of sample solutions fortified
with a standard solution of 4.0 µg Sb(V) mL-1. Experimental conditions are
described in Table 1S using the FA-HG-GPMAS system shown in Figure 1S
Figure 2. Representative spectra of SbH3(g) generated from a standard
solu-tion of 5.0 µg Sb(V) mL-1: (a) baseline at start time; b) baseline at end time
(c) standard measured at 3 min, (d) standard measured at 10 min, and (e) standard measured at 25 min. Insert: second-order spectra (D2) show an
automatic correction of the displacement of the absorption spectra in regard to the baseline as the time of analysis lapses; as it can be seen in the peak to zero baseline [D2
(224nm)]. Experimental conditions are specified in Table 1S
Based on the above fact, hydrochloric acid was selected as a medium able to generate an equivalent response signal for both species of antimony under study, Sb(III) and Sb(V).
On the whole, instrumental-spectroscopic parameters and reagent concentrations were optimized to achieve the best analytical perfor-mance of the FA-HG-GPMAS system for the quantiication of total antimony in pharmaceutical samples. The optimization procedure was carried out using a single-variation method.
Physical parameters
Flow rate
The low rate values were distributed according to the total volume arriving to the GLPS (Figure 1S), which used to be 10 mL for the vapour generation system Varian VGA-77. In all instants the mayor low rate was kept for the sample as recommended by the operation manual; in this particular case, 4 mL min-1, and the other 6 mL min-1 were distributed as needed depending on the HG-sensitivity and the concentration of the reagents. The low rates of the two branches of N2 were kept under the speciications of the vapour generation system (Varian VGA-77). Well-deined peaks were obtained using the low rates of the two branches of N2. Table 1S shows the selected low rate values for the proposed FA-HG-GPMAS system.
Transfer line length
The tubing length was kept as short as possible in regard to the designed manifold; mainly that one (25 cm) which separates the VGA-77 system from the sample compartment of the spectrophotometer.
Reaction coil length
Coil R1: mixing coils of different lengths, from 25 to 250 cm (0.5 mm, id), were inserted between the conluence point of COx/CAc2 and CCar/Csam (Figure 1S). According to the results, no apparent differences in the response signal were observed with variation of coil length longer than 50 cm (Figure not shown). Therefore, a length of 100 cm and an internal diameter of 0.5 mm was considered suficient in subsequent studies to ensure the maximum SbH3 response signal. Coil R2: mixing coils of different lengths, from 0 to 250 cm, were inserted between the conluence point of CAc1/CPRed and coil R1 (Figure 1S). Results did not show apparent differences in the response signal using coil length longer than 25 cm, but higher response signal was obtained with an internal diameter of 0.8 mm instead of 0.5 mm (Figure not shown). Therefore, a length of 50 cm and an internal diameter of 0.8 mm were considered suficient in subsequent studies to ensure the on-line pre-reduction procedure. Coil R3: mixing coils of different lengths were not explored because the appropriate length was supplied by the Varian VGA-77 vapour generation system. Selected values of all these experimental parameters are summarized in Table 1S.
Chemical parameters
Oxidizing/mineralizing agent
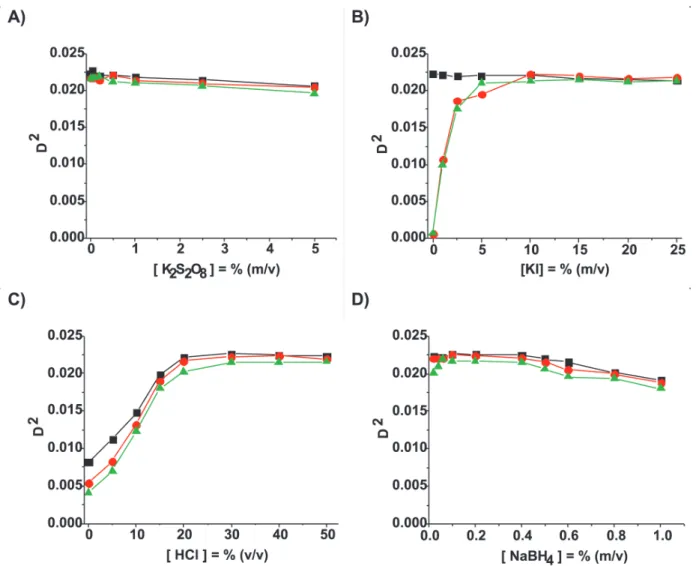
Today, it is well known that meglumine antimoniate and sodium stibogluconate are pentavalent organic antimonials (Sb-O-C) that exist in equilibrium as a complex mixture of carbohydrate-antimony polymers.31 When no digestion of the organic matrix is applied to the samples, recovery of antimony from these matrices might not reach 100% because of non-hydride forming organic antimony species. Consequently, an eficient mineralization step to destroy organic antimony compounds in the samples is a pre-requisite for reliable determination of antimony based on HG.32 The inluence of potassium persulfate (K2S2O8) employed for the mineralization of the organic antimonials (Sb-O-C) from pharmaceutical samples has been used
successfully in a previous work.25 In the present work, K
2S2O8 -pre-pared in HCl 10%, v/v- at different concentrations (COx) was used for this purpose. The results showed that the presence of K2S2O8 did not increase the response signal as it was expected (Figure 2S-A). On the contrary, the SbH3 response signal was falling at concentrations of K2S2O8 higher than 0.5%, m/v. This behaviour was attributable to the possibility of the prior consumption of KI by the strong oxidant; which would ultimately decreases the eficiency of the pre-reduction. Moreover, the attenuation of the SbH3 response signal at higher concentrations than 0.5% (m/v) of K2S2O8 could be attributable to the diluting effect caused by the gaseous species generated as sub-products by the oxidation process.
The removal of K2S2O8 from the proposed FA-HG-GPMAS produ-ced concentrations of total antimony in analyzed real samples as expected. This behaviour can be explained in two ways: the diluted samples are sonicated by ten minutes prior sample analysis, which could facilitate the sample hydrolysis; and when high dilutions of pentavalent-antimony carbohydrates take place (as it occurred in this assay), the polymerized species suffer hydrolysis into simpler ones, producing relatively labile adducts between Sb(V) and the matrix.31 Therefore, this last behaviour will facilitate the pre-reduction and reduction steps with KI and NaBH4, respectively, without interference of the oxidant agent.
As consequence of this study, K2S2O8 was not used in further studies. Instead of this, SV1 was switched to the acid position (CAc2) using 50% (v/v) of HCl. Under this procedure, standards and samples were prepared in just milli-Q water for further studies.
Pre-reducer agent
It is well known that HG is highly dependent on the oxidation state of antimony. Optimum stibine generation is found starting from Sb(III), and slowly stibine generation is obtained starting from Sb(V).32 The approach most known to reduce Sb(V) to Sb(III) in HG systems is using KI in acidic medium. Therefore in this work, Sb(V) was reduced to Sb(III) with KI in acid medium, previous to the HG. In order to obtain the maximum SbH3 response signal, the effect of KI concentration within the range 0-25% m/v (CPRed) was tested at a constant HCl concentration of 20%, v/v (CAc1). The results (Figure 2S-B) showed that there was a steady increase of the analytical signal generated from Sb(V) reaching the optimum value near to 10% (m/v) of KI. At higher concentrations than 10% (m/v), a plateau was reached, which was a clear indication of the comple-teness of the pre-reduction of Sb(V) to Sb(III). As expected stibine generation eficiency from Sb(III) was not affected. With the purpose of guarantying a quantitative pre-reduction of Sb(V), a concentration of 15% (m/v) KI was chosen for further studies.
Acid concentration
Sodium borohydride concentration
Having established that the eficiency of hydride generation is dependent simultaneously on the concentration of other related rea-gents, the inluence of NaBH4 concentration, within the range 0.01 up to 1.0% (m/v) -prepared in 0.1% (m/v) of sodium hydroxide- was explored at a constant and optimized KI and HCl concentrations (Fi-gure 2S-D). The results showed that, in the FA-HG-GPMAS system, the analytical signal reaches a maximum at very low concentrations of NaBH4 (0.1%, m/v), decreasing signiicantly at higher concentrations than 0.4% m/v, due certainly to the dilution of the hydride -in the low gas cell- by the hydrogen. As a result, a concentration of 0.2% (m/v) of NaBH4 was selected as the appropriate to ensure quantitative generation of stibine at the maximum concentration of antimony in the linear calibration.
By concluding the optimization and in view of the results, it could be inferred that the FA-HG-GPMAS system could be reconstructed and simpliied by eliminating the acid channel CAc1, the valve SV1 and the coil R1. In this case the standard solutions and sample solutions must be prepared in HCl at an appropriate concentration.
Analytical performance of the system
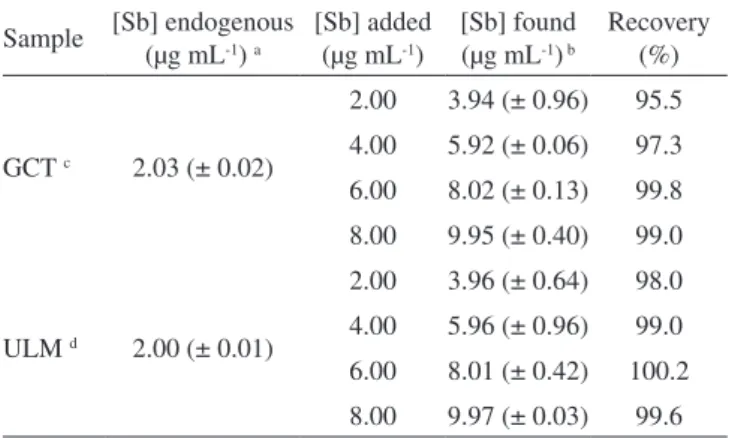
The analytical igures of merit achieved by the proposed method are listed in Tables 1-2. A linear dynamic range up to 10 µg mL-1 for Sb(V) was achieved with a limit of quantiication (10σ) of 0.39 µg mL-1. The results showed a variation coeficient better than the unit (% RSD). The accuracy of the analytical method was established by determining total antimony in spiked samples of GCT and ULM. In both cases, the recoveries of antimony were not less than 95% and not more than 101% of total antimony, with a relative standard deviation better than 1%, which was an indication of the reliability of the proposed method (Table 3). The sample throughput was up to 30 samples h-1, which could be considered appropriate for quality control. Regarding the analytical sensitivity, it was lower than those obtained by using either HG-AAS or ICP techniques, but comparable to that obtained by using HG-FTIR.25
Interference study
Interference studies were undertaken by means of two approaches: using derivative spectroscopy and by means of standard addition studies. The irst approach eliminated at irst instant those gaseous interferences very close to the UV cut limit (190 nm). The second approach allowed determining any physical or chemical interference
from the matrix and also from the on-line chemical procedure. In this study, the slope obtained by the external calibration method did not differ signiicantly (p= 0.05) from the slope obtained by the standard addition method (Table 2).
Other possible concomitants usually present in the pharmaceutical formulation -as antioxidants-, such as anhydrous sodium sulphite (0.18 mg mL-1) and potassium bisulphite (1.6 mg mL-1) apparently not showed any remarkable effect on antimony determination by using the selected measurement criterion.
The interference in HG coming from inter-element effects, which suppress or enhance the true signal, is very important. Contamination of leishmanicidal pharmaceutical products with this type of species such as lead and arsenic is not expected unless poor quality control of manufacturing process allows the use of impure active chemicals.4 Arsenic is the most probable impurity of antimonial drugs.4 Arsenic can generate gaseous AsH3 which could enhance or suppress the true response signal of SbH3. Therefore, the presence of this inter-element as impurity of real samples was explored by FA-HG-FTIR at different concentration ratios.25 As can be seen in Figure 3S, the presence of As in the tested drugs was not detected. Under these conditions, arsine interference was discarded as potential interfering specie in the developed method.
Table 1. Analytical igures of merit of the proposed FA-HG-GPMAS method for total antimony determination in commercial samples of antileishmanial drugs
Feature Sb(III) Sb(V)
Dynamic range (µg mL-1) Up to 10 Up to 10
Linear equation a Y = -6.5x10
-4 + 4.89x10⁻³ [X]
Y = -5.3x10⁻⁵ + 4.91x10⁻³ [X]
Correlation coeficient 0.9998 0.9999
SD (y/x) 3.9 x 10⁻⁴ 1.9 x 10⁻⁴
LOD (µg mL-1) 0.24 0.12
LOQ (µg mL-1) 0.81 0.39
Precision (% RSD; n = 10) b 0.81 0.58
Sample throughput (h-1) 30 30
a Y = a + b(X), where Y = second-order derivative signal (d2A/dλ2) of the peak to baseline at 224 nm; X = concentration of Sb (µg mL-1). b Instrument precision estimated by measuring ten replicates of one
sample solution expressed as relative standard deviation.
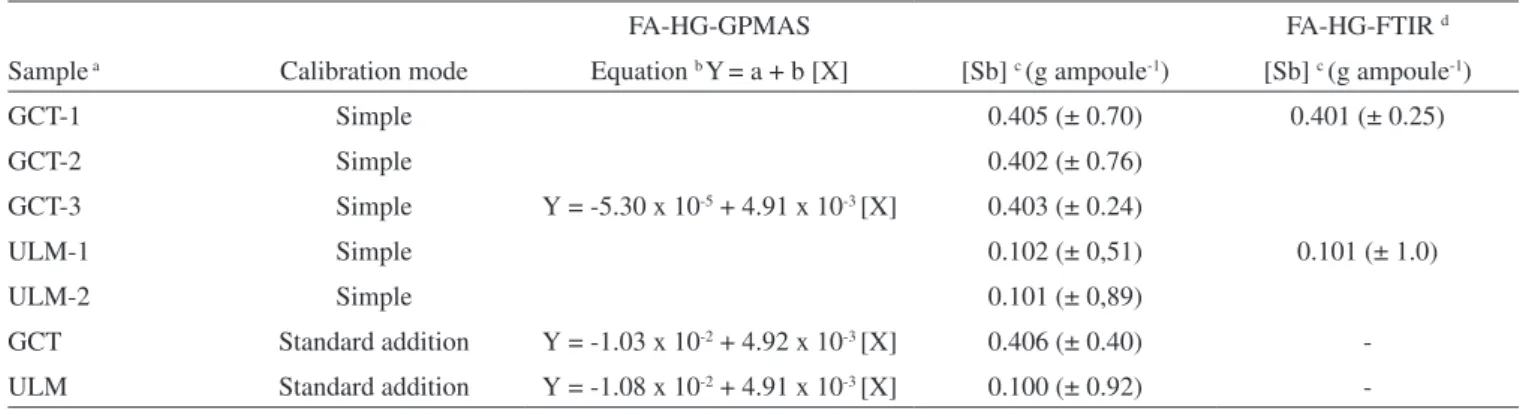
Table 2. Results obtained for the analysis of commercial samples of antileishmanial drugs
FA-HG-GPMAS FA-HG-FTIR d
Sample a Calibration mode Equation b Y= a + b [X] [Sb] c (g ampoule-1) [Sb] c (g ampoule-1)
GCT-1 Simple 0.405 (± 0.70) 0.401 (± 0.25)
GCT-2 Simple 0.402 (± 0.76)
GCT-3 Simple Y = -5.30 x 10⁻⁵ + 4.91 x 10⁻³ [X] 0.403 (± 0.24)
ULM-1 Simple 0.102 (± 0,51) 0.101 (± 1.0)
ULM-2 Simple 0.101 (± 0,89)
GCT Standard addition Y = -1.03 x 10⁻² + 4.92 x 10⁻³ [X] 0.406 (± 0.40)
-ULM Standard addition Y = -1.08 x 10⁻² + 4.91 x 10⁻³ [X] 0.100 (± 0.92)
Analysis of real samples
The proposed FA-HG-GPMAS system was successfully applied to the determination of total antimony in two parenteral pharmaceu-tical formulations. Total antimony was determined in diluted com-mercial samples of GCT and ULM using the conditions described in Table 1S. The total antimony concentration in the analyzed samples of GCT and ULM (Table 2) was in good agreement with that of the prescribed amount (0.405 g Sb ampoule-1 and 0.100 g Sb ampoule-1, respectively). In addition, the real samples were also analyzed by an alternative method (FA-HG-FTIR),25 and no signiicant differences were achieved at 95% conidence levels (t-test) by comparing the two sets of results (Table 2). These results again demonstrated the general reliability of the developed method.
CONCLUSIONS
The determination of total antimony in antileishmanial drugs is very important for the quality control in the pharmaceutical ield. In this context, the development of a new method for the determination of total antimony in samples of injectable drugs used for leishmaniasis treatment, based on the coupling of low analysis, hydride generation, and derivative molecular absorption spectrophotometry in gas phase is proposed. As the leishmanicidal drugs content high level of antimony, molecular absorption spectrophotometry in gaseous phase seems ideal for analysing the total antimony content in these products.
This method provides some signiicant advantages such as acces- acces-sibility of instrumentation and low cost, low reagent consumption, reduced sample handling, and adequate sample throughput, which could make the procedure feasible for pharmaceutical quality control either in the pharmaceutical industry or oficial governmental agencies in developing countries. To the best of our knowledge, this is the irst study dealing with total antimony determination in meglumine antimoniate parenteral products using the proposed approach.
Finally, taking into account the promising results obtained using the developed method; further detailed studies to demonstrate its potential in speciation analysis of antimony in pharmaceuticals products are underway.
SUPPLEMENTARY MATERIAL
Table 1S and Figures 1S, 2S and 3S. This material is available at http://www.quimicanova.sbq.org.br, in PDF ile.
ACKNOWLEDGEMENTS
The authors gratefully acknowledge the inancial support of the ‘Council of Scientiic, Humanistic and Technological Development’ (CDCHT) of the University of Los Andes (ULA) from Venezuela, Project No FA-371-06-08-B, and SE-FA-03-07-08.
REFERENCES
1. Ridley, R. G.; Leishmaniasis. Special Program for Research and Train-ing in Tropical Diseases (TDR); World Health Organization; Switzerland 1211, Geneva, 2005; http://www.who.int/tdr/diseases/leish/pubs.htm, accessed in January 2007.
2. Yepez, J. Y.; Scorza-Dager, J. V.; Bol. Mal. Salud Amb. 2003, 43, 9. 3. Masmoudi, A.; Maalej, N.; Mseddi, M.; Souissi, A.; Turki, H.; Boudaya,
S.; Bouassida, S.; Zahaf, A.; Med. Mal. Infect.2005, 35, 42.
4. Romero, G. A. S.; Flores, E. M. M.; Noronha, E. F.; Macedo, V. O.;
Mem. Inst. Oswaldo Cruz 2003, 98, 145.
5. Miranda, E. S.; Miekeley, N.; Carvalho, R. R.; Paumgartten, F. J. R.;
Reprod. Toxicol.2006, 21, 292.
6. Trivelin, L. A.; Rohwedder, J. J.; Rath, S.; Talanta 2006, 68, 1536. 7. Quentel, F.; Filella, M.; Anal. Chim. Acta2002, 452, 237.
8. Krachler, M.; Emons, H.; Zheng, J.; Trends Anal. Chem.2001, 20, 79. 9. Smichowski, P.; Madrid, Y.; Cámara, C.; Fresenius´ J. Anal. Chem.1998,
360, 623.
10. Nash, M. J.; Maskal, J. E.; Hill, S. J.; Environ. Monit.2000, 2, 97. 11. Das, A. K.; Guardia, M.; Cervera, M. L.; Talanta 2001, 55, 1. 12. Bloomield, M. S.; Dow, D. A.; Prebble, K. A.; J. Pharm. Biomed. Anal.
1992, 10, 779.
13. Franco, M. A.; Barbosa, A. C.; Rath, S.; Dorea, J. G.; Am. J. Trop. Med. Hyg.1995, 52, 435.
14. González, M. J.; Renedo, O. D.; Martínez, M. J. A.; Talanta2007, 71, 691.
15. Brazilian Pharmacopoeia; Meglumine antimoniate, 4th ed., Brazilian Pharmacopoeia Convention: Sao Paulo, 2002.
16. Flores, E. M. M.; Santos, E. P.; Barin, J. S.; Zanella, R.; Dressler, V. L.; Bittencourt C. F.; J. Anal. At. Spectrom.2002, 17, 819.
17. Flores, E. M. M.; Paula, F. R.; Silva, F. E. B.; Moraes, D. P.; Paniz, J. N. G.; Santos, E. P.; Dressler, V. L.; Bittencourt, C. F; At. Spectrosc.2003,
24, 15.
18. Figueiredo, E. C.; Dedina, J.; Arruda, M. A. Z.; Talanta2007, 73, 621. 19. Görög, S.; J. Pharm. Biomed. Anal.2005, 36, 931.
20. Rath, S.; Jardim, W. F.; Dórea J. G.; Fresenius´ J. Anal. Chem.1997,
358, 548.
21. González, M. J. G.; Renedo, O. D.; Arcos, M. J.; Talanta2005, 68, 67. 22. Figueiredo, E. C.; Luccas, P. O.; Arruda, M. A. Z.; Anal. Lett.2006, 39,
543.
23. Trivelin, L. A.; Rohwedder, J. J.; Rath, S.; Talanta2006, 68, 1536. 24. Almeida, V. G. K.; Lima, F. M.; Cassella, R. J.; Talanta2007, 71,
1047.
25. Gallignani, M.; Ayala, C.; Brunetto, M. R.; Burguera, M.; Burguera, J. L.; Talanta 2003, 59, 923.
26. Cresser, M. S.; Anal. Chim. Acta1976, 85, 253. 27. Sity, A.; Anal. Chem.1973, 45, 1744.
28. Haghighi, B.; Kurd S. F.; Talanta2004, 64, 688.
29. Gallignani, M.; Ovalles, F.; Brunetto, M. R.; Burguera M.; Burguera, J. L.; Talanta 2005, 68, 365.
30. Dedina, J.; Tsalev, D. L.; Hydride generation atomic absorption spec-trometry, John Willey & Sons: Chichester, 1995.
31. Roberts, W. L.; McMurray, W. J.; Rainey, P. M.; Antimicrob. Agents Chemother.1998, 42, 1076.
32. Krachler, M.; Burow, M.; Emons, H.; Analyst1999, 124, 923.
Table 3. Recovery of Sb(V) added to commercial samples of an-commercial samples of an-tileishmanial drugs
Sample [Sb] endogenous (µg mL-1) a
[Sb] added (µg mL-1)
[Sb] found (µg mL-1) b
Recovery (%)
GCT c 2.03 (± 0.02)
2.00 3.94 (± 0.96) 95.5
4.00 5.92 (± 0.06) 97.3
6.00 8.02 (± 0.13) 99.8
8.00 9.95 (± 0.40) 99.0
ULM d 2.00 (± 0.01)
2.00 3.96 (± 0.64) 98.0
4.00 5.96 (± 0.96) 99.0
6.00 8.01 (± 0.42) 100.2
8.00 9.97 (± 0.03) 99.6
Material Suplementar
*e-mail: [email protected]
FLOW ANALYSIS-HYDRIDE GENERATION-GAS PHASE DERIVATIVE MOLECULAR ABSORPTION SPECTROPHOTOMETRIC DETERMINATION OF ANTIMONY IN ANTILEISHMANIAL DRUGS
Máximo Gallignani y María del Rosario Brunetto
Departamento de Química, Facultad de Ciencias, Universidad de Los Andes, Apartado postal 440, Mérida 5101-A, Mérida, Venezuela
Fernando Ovalles*
Departamento de Análisis y Control, Facultad de Farmacia, Universidad de Los Andes, Mérida 5101-A, Mérida, Venezuela
Figure 1S. Schematic diagram of the FA-HG-GPMAS coupled system proposed. CAc, acid agent; CPRed, pre-reducing agent; COx, oxidizing agent; CCar, carrier;
Figure 2S. Effect of chemical parameters on the analytical signal: A) oxidizing agent; B) pre-reducing agent; C) acidic medium; D) reducing agent. (n) 5.0 µg Sb(III) mL-1; (l) 5.0 µg Sb(V) mL-1; and () sample solution containing an equivalent concentration to the standards (≅ 4.86 µg Sb mL-1). D2, signal of the
second derivative spectrum [peak to zero baseline D2 (224 nm)]
Figure 3S. Representative FTIR spectra of (a) blank, (b) sample of GCT 100 µg Sb(V) mL-1, and (c) sample of GCT 100 µg Sb(V) mL-1 enrichment with a standard
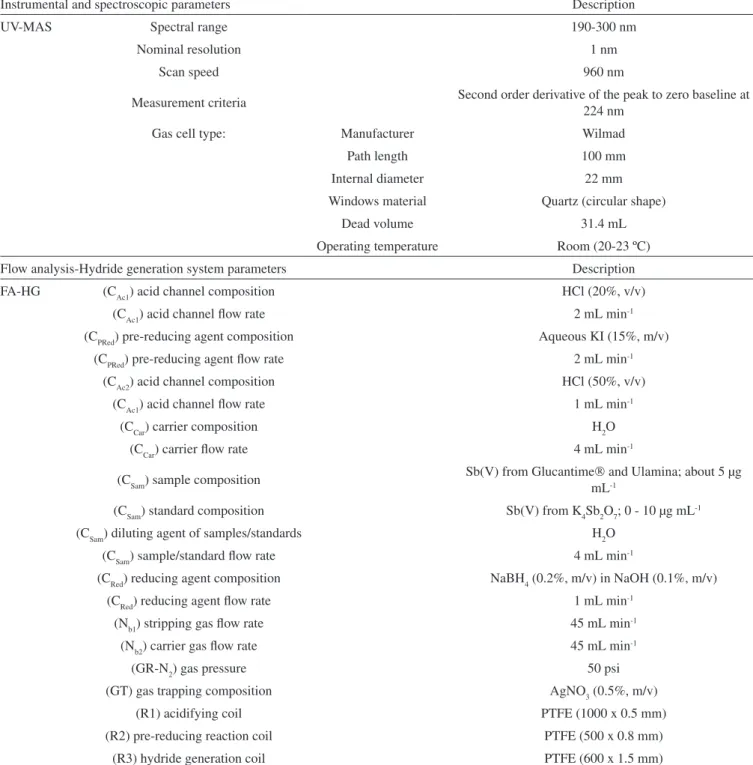
Table 1S. Operating conditions of the FA-HG-GPMAS coupled system
Instrumental and spectroscopic parameters Description
UV-MAS Spectral range 190-300 nm
Nominal resolution 1 nm
Scan speed 960 nm
Measurement criteria Second order derivative of the peak to zero baseline at
224 nm
Gas cell type: Manufacturer Wilmad
Path length 100 mm
Internal diameter 22 mm
Windows material Quartz (circular shape)
Dead volume 31.4 mL
Operating temperature Room (20-23 ºC)
Flow analysis-Hydride generation system parameters Description
FA-HG (CAc1) acid channel composition HCl (20%, v/v)
(CAc1) acid channel low rate 2 mL min-1
(CPRed) pre-reducing agent composition Aqueous KI (15%, m/v)
(CPRed) pre-reducing agent low rate 2 mL min-1
(CAc2) acid channel composition HCl (50%, v/v)
(CAc1) acid channel low rate 1 mL min-1
(CCar) carrier composition H2O
(CCar) carrier low rate 4 mL min-1
(CSam) sample composition Sb(V) from Glucantime and Ulamina; about 5 µg
mL-1
(CSam) standard composition Sb(V) from K4Sb2O7; 0 - 10 µg mL-1
(CSam) diluting agent of samples/standards H2O
(CSam) sample/standard low rate 4 mL min-1
(CRed) reducing agent composition NaBH4 (0.2%, m/v) in NaOH (0.1%, m/v)
(CRed) reducing agent low rate 1 mL min-1
(Nb1) stripping gas low rate 45 mL min-1
(Nb2) carrier gas low rate 45 mL min-1
(GR-N2) gas pressure 50 psi
(GT) gas trapping composition AgNO3 (0.5%, m/v)
(R1) acidifying coil PTFE (1000 x 0.5 mm)
(R2) pre-reducing reaction coil PTFE (500 x 0.8 mm)