Assessing soil carbon stocks under pastures through orbital
remote sensing
Gabor Gyula Julius Szakács
1, Carlos Clemente Cerri
1*, Uwe Herpin
2, Martial Bernoux
31
USP/CENA – Lab. de Biogeoquímica Ambiental, C.P. 96 – 13400-970 – Piracicaba, SP – Brasil. 2
USP/ESALQ – Núcleo de Pesquisa em Geoquímica e Geofísica da Litosfera. 3
Institut de Recherche pour le Développement/UMR Eco&Sols “Functional Ecology & Soil Biogeochemistry & Agro-Ecosystems” (Cirad-Inra-IRD-SupAgro), 2 place Viala – Bat. 12, 34060 Montpellier cedex, France. *Corresponding author <cerri@cena.usp.br>
Edited by: Luís Reynaldo Ferracciú Alleoni
ABSTRACT: The growing demand of world food and energy supply increases the threat of global warming due to higher greenhouse gas emissions by agricultural activity. Therefore, it is widely admitted that agriculture must establish a new paradigm in terms of environmental sustainability that incorporate techniques for mitigation of greenhouse gas emissions. This article addresses to the scientific demand to estimate in a fast and inexpensive manner current and potential soil organic carbon (SOC) stocks in degraded pastures, using remote sensing techniques. Four pastures on sandy soils under Brazilian Cerrado vegetation in São Paulo state were chosen due to their SOC sequestration potential, which was characterized for the soil depth 0-50 cm. Subsequently, a linear regression analysis was performed between SOC and Leaf Area Index (LAI) measured in the field (LAIfield) and derived by satellite (LAIsatellite) as well as SOC and pasture reflectance in six spectra from 450 nm - 2350 nm, using the Enhanced Thematic Mapper (ETM+) sensor of satellite Landsat 7. A high correlation between SOC and LAIfield (R2 = 0.9804) and LAIsatellite (R
2
= 0.9812) was verified. The suitability of satellite derived LAI for SOC determination leads to the assumption, that orbital remote sensing is a very promising SOC estimation technique from regional to global scale.
Keywords: Brazil, leaf Area Index, soil organic carbon, pasture degradation, spectral reflectance, climate change
Introduction
Global warming by greenhouse gas (GHG) emissions causes major negative implications on global environment and economics nowadays and for the future. CO2 contrib-utes with approximately 60 % of the global warming po-tential of greenhouse gases and intensive studies are un-dertaken to understand the complex carbon cycle and its interactions between geosphere and atmosphere. Agricul-ture sector is able to remove CO2 from the atmosphere de-pending on land conversion and management (Bernoux et al., 2006; Cerri et al., 2004, 2007, 2010). However, it is nec-essary to quantify the amount of CO2 removed and stored in the form of organic matter. Thus, there is an increasing demand for estimating SOC on a global scale by fast and inexpensive, but yet accurate estimation, such as remote sensing techniques.
In most cases a higher Net Primary Productivity (NPP), without large nutrient and biomass export by harvest, in-creases SOC due to higher carbohydrate assimilation through photosynthesis, which is partly stored in the soil (Ingram and Fernandes, 2001).
Hodgson (1990) considers LAI as one of the two vari-ables, which demonstrate strong consistency in relation to pasture NPP. Therefore, this study explored the correlation between SOC and LAI. LAI and LAD (Leaf Angle Distri-bution) represent the main drivers of canopy reflectance (Asner, 1998). Furthermore, it is legitimate to interpret sub-soil information (e. g. SOC.) by analyzing upper sub-soil sur-face characteristics (e.g. LAI) obtained through satellite im-ages, provided that there is a strong correlation between
the subsoil and upper soil data (Levine et al., 2000). Sev-eral other authors point out to a good relationship between LAI and spectral vegetation indexes (SVIs) such as the NDVI (Broge and Leblanc, 2001; Gupta and Prasad, 2000; Friedl, 1997; Price and Bausch, 1995). Due to differences in the optical properties of vegetation, Turner et al. (1999) sug-gest the need for considering the specific vegetation type (e.g. pasture) when establishing and applying LAI–SVI re-lationships. Since the SVIs can be derived from satellite im-agery, SOC estimation based on LAI determination through satellite images represents a useful approach, if a signifi-cant correlation between these two parameters can be high-lighted.
Several authors also investigated the relationship be-tween soil organic matter and soil reflectance (Henderson et al., 1989; Baumgardner et al., 1970). Hummel et al. (2001) studied the near infrared (NIR) reflectance to predict organic matter of soils, with a standard error from the calibration set of 0.63 % (i. e. the standard error of the estimate in the calibration data in percent soil organic matter). Statisti-cal analysis of soil reflectance and SOC indicated the po-tential of soil reflectance in visible, NIR, and SWIR bands to provide information about SOC content. In particular, five SWIR bands (1955-1965, 2215, 2265, 2285-2295, and 2315-2495 nm) revealed the highest correlation (r = -0.964 or higher) (Henderson et al., 1992). For SOC detection in the field, spectral handheld sensors were designed, based on reflectance spectroscopy of the NIR and SWIR spectra (Reeves et al., 2003; Shonk et al., 1991). Chen et al. (2010) found high correlation (R2
combi-nation of image intensity values in the red, green, and blue bands. However, the above-mentioned SOC estimation studies relate either to a field or an aerial remote sensing but not to the orbital remote sensing. So far there has been little research about the spectral relationship between sub-surface SOC combined with vegetation/soil reflectance at orbital remote sensing scale. The objective of this study is to explore this relationship.
Pasture is the principal land use in the State of São Paulo, covering about 8 million ha (Pino, 2009). Pasture area corre-sponds mostly to low fertility soils subject to degradation due to extensive pasture management (Oliveira et al., 1996). Several authors (Fagundes et al., 1999) observed reduced bio-mass productivity for the majority of these pastures. Better pasture management can reduce this degradation and raise the photosynthesis rate, resulting in SOC sequestration. Pas-tures under sandy soils and with the popular Brachiaria for-age were studied due to their high SOC sequestration po-tential and representativeness for a large geographic area in South America (Lal et al., 2006; Blanchart et al., 2007). Sandy soils cover 15 % of the Brazilian Cerrado biome (Bernoux et al., 2002) that is the second largest biome in South America (Lal et al., 2006).
Materials and Methods
The study sites are located at the Southern part of the Brazilian Cerrado biome. This vegetation comprises an in-tricate mosaic of land cover types, vertically structured as grassland, shrubland, and woodland, with a gently slop-ing relief, rangslop-ing from 450 m to 600 m altitude at study sites. The studied pastures are situated in the municipali-ties of Piracicaba and Anhembi (São Paulo State) (Figure 1). Subsequently, they will be described by their far m names (Bar r eir o Rico, Bondade, Descalvado and Monjelada).
The climate is humid mesothermic with relatively cold and dry winters (Cw according to Köppen), where the monthly average temperature does not exceed 18 ºC (Cwa). Meteorological records of Piracicaba municipality indicate a mean annual temperature of 21.6 ºC and a mean annual precipitation of 1.166 mm for the studied year 2001 (ESALQ/USP, 2003), which represents a difference of 0.4 % less for mean annual temperature and 4 % less for mean annual precipitation compared to long term climatic data
of Anhembi (29 years) and Piracicaba (81 years) (Embrapa, 2010). The studied soils in all four pastures are character-ized as Neossolo Quartzarênico (Brazilian soil classification), which refers to Psamments (U.S. Soil Taxonomy) and Arenosols (FAO classification). Soil particle size distribu-tion was determined by sedimentadistribu-tion (Embrapa, 1979) (Figure 2).
SOC and spectral reflectance of pastures interact with both biophysical and human induced parameters like cli-mate (photosynthetic activity), soil type, land use and management type; only former land use cannot be linked to the surface spectral behavior. The parameter former land use takes into account the recalcitrant SOC fraction (SOC fractions with turnover rates from 200 to 1,500 years) (Parton et al., 1987), which was stored before present land use. This SOC fraction is not linked to pre-senting spectral behavior. Thus it is desirable, to encoun-ter first, pastures with similar previous land use(s), which, therefore, posses similar amount of stable SOC of the previous land use(s) and second, to encounter relatively “old” pastures, that do not feature anymore the biode-gradable SOC fraction of the previous land use(s). Con-sequently, the SOC fraction, derived from the previous land use(s) is harmonized and minimized, which enables a stronger impact of the SOC derived from the present land use, which can be linked to remote sensing (more surface biomass > more SOC).
The studied pastures were chosen under this premise and were established in 1921 (Barreiro Rico farm), 1968 (Monjelada), 1977 (Bondade) and 1980 (Descalvado). It was not possible to encounter all four pastures with the same age of implementation. This selection represents the best set of pasture aged more than 20 years and with a rather precise land use and management history available. The minimum age of 21 years of pasture installation is superior to the 20 year-timeframe recommended as a minimum ei-ther by the methodologies of the Intergovernmental Painel on Climate Change (IPCC, 2000) recommended comparing soil C stocks changes due to land-use change (Bernoux et
Figure 1 – Geographic location of the studied pastures.
Figure 2 – Soil particle size distribution of the studied pastures. (Des = Descalvado; BON = Bondade; BAR = Barreiro Rico; MON = Monjelada).
0% 20% 40% 60% 80% 100%
MON BAR BON DES
Soil Fractions
Farm
s
Soil Particle Size Distribution
al., 2001), either used in international approaches (Milne et al., 2007; Bernoux et al., 2010).
In addition to the selection criteria of pasture age, the four chosen pastures represent four different productivity lev-els from fairly productive (Monjelada) to fairly unproductive (Descalvado) in order to be able to estimate SOC sequestra-tion potential for sandy soils under pasture in São Paulo State. Each pasture also fulfilled the necessary extension (approxi-mately two hectares) to cover entirely at least one pixel of the satellite image, to ensure a spectral response that is ex-clusively related to pasture without interferences of other land uses.
Soils were sampled using stainless steel rings (∅ 10 cm) at the following soil depths: 0–5 cm, 5–10 cm, 10–20 cm, 20–30 cm, 30–40 cm and 40-50 cm, resulting in undis-turbed soil samples for further C and bulk density deter-mination from the same sample (Folegatti et al., 2001). Soil samples were dried to 60 ºC for C content analysis and an aliquot were dried to 105 ºC for determination of the soil water content in order to allow soil bulk density calculation. The soils were vertically collected for each layer and pasture by six repetitions, except the 0-5 cm layer (8 repetitions), to account for a higher spatial variability of carbon in the uppermost layer.
For carbon determination, samples were dried for three days at 60 ºC. Before weighing, the gross roots were removed. The samples were then sub-sampled by suc-cessive diagonal halving to maintain a representative sub-sample. Before milling, fine roots were removed from the sub-sample. For this purpose, a plastic ruler was elec-trostatically charged and held over the sub-sample. The electrostatics removed exclusively the fine roots free of soil particles. Finally, the carbon content was deter-mined by dry combustion in a spectrometric carbon analyzer (LECO CN-2000).
The SOC stocks were calculated as follows (Moraes et al., 1996; Ellert and Bettany 1995): SOC = carbon (%) × bulk density(g cm–3) × depth of soil layer (cm) ÷ 100 (conversion
factor of %). Bulk density was obtained by dividing dry weight of the undisturbed soil samples trough the vol-ume of the sampling rings (Folegatti et al., 2001).
LAI by field measures: samples were taken in the transition period from wet to dry season in April/May 2001 with intermediate soil humidity to minimize soil sampling distortion errors (Figure 3). At this time of year, the less productive pastures start to suffer water stress, which affects the photosynthetic activity and leads to more visible and desirable differences of LAI
between the pastures. The LAIfield samples were
ran-domly taken by a ring (∅ 0.25 m2) in May 30-31, 2001, with 8 repetitions for each pasture. To do so, the litter was removed, followed by an entire cut of the green bio-mass above the surface. The samples were immediately weighted with the objective of minimizing humidity losses; hereupon approximately 20 % of the entire sample was extracted and immediately weighted to con-stitute a representative sub-sample. Subsequently, the sub-samples were separated in two fractions: green leaves
and others. The green leaves were measured by a Leaf Area Meter (LI-COR: LI-3100). The LAIfield of the entire sample was calculated as follows:
entire sample
entire sample sub sample
sub sample
FreshWeight
LAI x LAI
FreshWeight − −
=
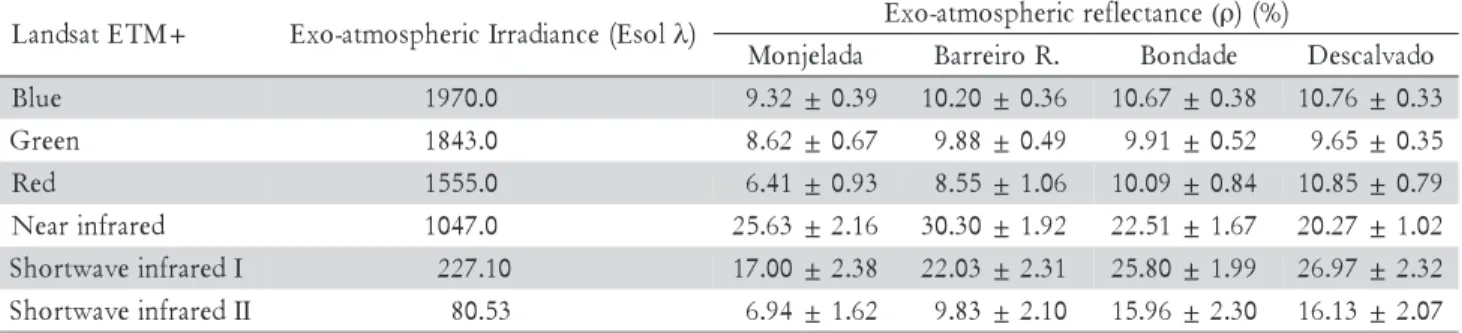
SOC does not exist in its elementary form in nature and is encountered in soils as a component of most di-verse chemical complexes. Therefore, SOC does not have specific spectral reflectance behavior and cannot be measured directly by remote sensing techniques. In order to estimate SOC by remote sensing, a parameter has to be used as a link between SOC and terrestrial sur-face reflectance, which represents a strong correlation to both of them. Therefore, the study investigated the suitability of LAI for this purpose. We used a Landsat 7 satellite image, which represents one of the global stan-dards in remote sensing of terrestrial resources (USGS, 2009). The scene (World Reference System: 220/76) was recorded at 13h00 UTC (Universal Time Convention) on the 10th of May 2001 to guarantee close spectral rela-tionship between the land cover satellite scene and LAI sampling (30/31 of May). Table 1 features the spectral characteristics of Landsat 7 ETM+ sensor.
Before processing, a sub-image (~ 35 × 12 km) was extracted from the entire scene to enable more accurate georeferencing and increase processing speed. Subse-quently, this sub-image was georeferenced (UTM pro-jection with SAD69 datum) and atmospherically cor-rected. Georeferencing was done by 12 Ground Control Points (GCP), taken by a differential GPS (DGPS) sys-tem (TRIMBLE:GeoExplorer II), using Universal Trans-verse Mercator (UTM) Coordinate Reference System with South American 1969 datum for Brazil. The accu-racy is sub-meter (Trimble, 1999), which is considered adequate for the study. The GCPs were taken in locations that were easily recognizable on the satellite image, to ensure precise georeferencing. The GCPs were imported to a Geo-graphic Information System (GIS) (MICROIMAGES:
TNTmips 6.8), using an order 3 polynomial model. The sub-image was atmospherically corrected by atmospheric correc-tion software ATCOR-2. Furthermore, the areas of the pas-tures were marked out by DGPS for adequate identification on the satellite image.
The digital numbers (DN) of the grayscale raster image were converted to surface reflectance (in %). First, the DNs were converted to apparent radiance by the following formula (Markham and Barker, 1986):
RAD (λ) = gain (high) × DN + offset
RAD (λ) = (Lmax λ – Lmin λ) 255–1 × DN + Lmin λ
where: RAD (λ) = spectral radiance at the sensor’s ap-erture (W m–2 ster–1 μm–1), Lmin λ = spectral radiance
range minimum (high gain), Lmax λ = spectral radiance
range maximum (high gain), DN = digital number of the considered pixel
The apparent radiance values were then converted to reflectance as follows (Moreira, 2001):
ρ = π×××××RADλ×d2 Esol λ–1×××××cos θs–1
where: ρ = planetary reflectance, RADλ = spectral ra-diance (W m–2
ster–1 μ m–1
), d = earth-sun distance, in as-tronomical units: 1.0109 for the 10th of may (NASA, 2009),
Esolλ = mean solar irradiance (W m–2 μm–1) (NASA, 2009), θs = solar zenith angle (50.6º)
LAIsatellite was calculated in two sequential steps. First the soil fraction covered by plants was calculated, using the following formula proposed by Choudhury et al. (1994):
0.9
max 1
max min
−
⎛ ⎞
= − ⎜⎝ NDVI − NDVI ⎟⎠
Fc
NDVI NDVI
where: Fc = Soil surface fraction covered by plants of
given pasture pixel, NDVI = Normalized Difference
Vegetation Index of given pasture pixel, NDVImax =
Maximum NDVI of studied pasture, NDVI min =
Mini-mum NDVI of studied pasture.
Hereupon, the soil fraction index was used for LAI deter mination sug gested by Campbell and Nor mann (1998):
Fc = exp(-Kbe(0)Lt)
where: Fc = Soil fraction covered by plants of given pas-ture pixel, Kbe(0) = spherical leaf angle distribution = 0.5, Lt = LAI.
The equation was re-arranged to be solved for LAI:
LAI = -2Ln (1 - Fc)
where: LAI = Leaf Area Index of given pasture pixel, Fc = Soil fraction covered by plants of given pasture pixel
Linear regression analysis was performed to evaluate the suitability of field measured LAI and spectral reflectance be-havior of pastures, particularly satellite derived LAI, for SOC estimation. Correlation values with a probability higher to 95 % (p < 0.05) were considered significant.
Results and Discussion
The LAI values for the studied pastures, ranging from 0.150 to 1.103 m2 m–2, which represents a difference of 635 % between the highest LAI pasture and the lowest LAI pasture (Figure 4). The overall low LAI levels found in these pastures are associated to a sandy soil texture. The LAI differences are caused by different management practices, considering that the bio-physical factors bearing an influence on the LAI are almost identical among all pastures (same soil type, forage, climate, topography). The management practices differ in manuring and overgrazing. The two pastures with lower LAI have no manuring and the pasture with the lowest LAI also is over-grazed. The partly bare soil spots in the pasture Bondade are responsible for the high standard deviation.
The individual soil layers (0-5, 5-10, 10-20, 20-30, 30-40 and 40-50 cm) were amalgamated as one soil layer (0-50 cm). The differences in SOC between the four studied pastures range from 32.0 to 54.4 Mg ha–1
, which amounts to a differ-ence of 70.1 % between the highest and lowest SOC (Figure 5). The overall low SOC stocks found in the four pastures are caused by their sandy soil texture (Batjes, 1996). The dif-ferences in SOC reflect different management practices, as seen for LAI differences, because the biophysical parameters re-main the same for the four pastures (climate, soil type, for-age specie, topography). Just one parameter is sensitive to SOC but not to LAI, namely former land use(s). That is be-cause the recalcitrant fraction of the SOC (200-1,500 years turnover rates) of the former land use(s) makes part of the present SOC (Parton et al., 1987). As this fraction cannot be detected by remote sensing through biomass and waterleaf content measurements, it is therefore, advisable to minimize this parameter and/or calculate weighing factors first for the age of the present land use and second for the type of former land use(s).
A regression analysis between SOC and LAIfield was per-formed to investigate their correlation (Figure 6). In the ob-Table 1 – Characteristics of the spectral bands of Landsat 7 (USGS, 2009).
7 t a s d n a L f o s c i t s i r e t c a r a h C l a p i c n i r P 1
d n a
B 2 3 4 5 6 7 8
: ) m µ ( h t d i w d n a B
2 5 . 0 -5 4 .
0 0.53-0.61 0.63-0.69 0.78-0.90 1.55-1.75 10.4-12.5 2.09-2.35 0.52-0.90 :
n o i t u l o s e r l a i t a p S
m 0
served range, the regression follows a linear tendency. The high LAI standard deviation of Bondade refers to incom-plete plant cover (approx. 75 %) at this site. Table 2 sum-marizes the results, revealing a determination coefficient of R2 = 0.98, which indicates a highly significant correlation be-tween SOC and LAIfield (p < 0.05).
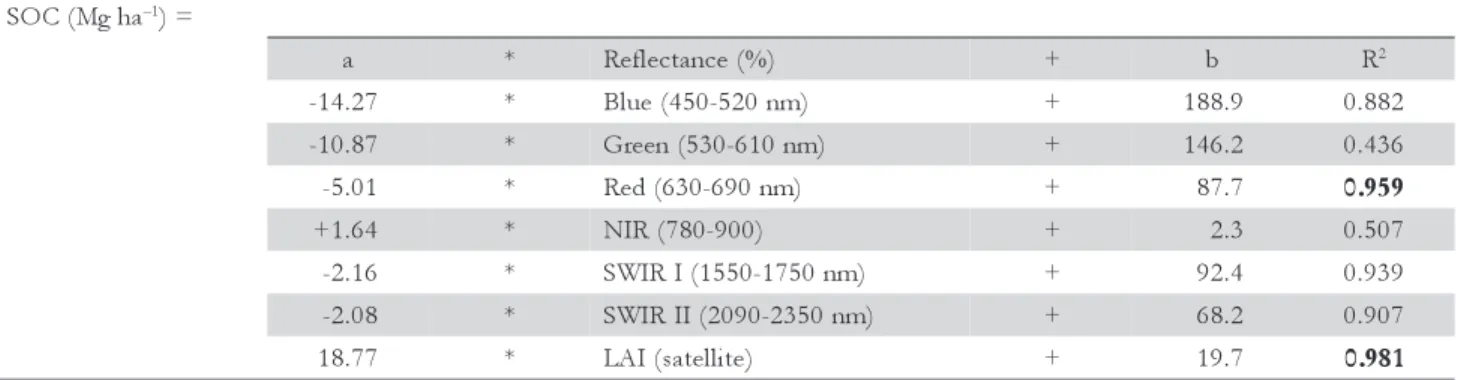
To perform a regression analysis between SOC and pas-ture reflectance, the DNs were converted to reflectance: First the DNs were converted to radiance (Table 3) and subse-quently to reflectance (Table 4). Table 5 shows the result of a regression analysis between SOC and pasture reflectance for six spectral bands and satellite derived LAI. Two determina-tion coefficients (R2) were higher than 0.95, indicating a sig-nificant correlation (p < 0.05) for the red spectrum vs. SOC and satellite derived LAI vs. SOC. Hence, these two correla-tions were discussed in detail.
Figure 7 shows the regression analysis between SOC and pasture reflectance in the red spectrum. Taking into account
a = gradient, b = intersection with y-axis, R2 = determination coefficient, *significant correlation with p < 0.05.
Table 2 – Regression between soil organic carbon (SOC)
and field measured Leaf Area Index (LAIfield).
I A L = C O
S field*a+b f o e t a m i t s e n o i t a u q e e h t d r a d n a t s r o r r
e p<0.05
a 28.685 0.008 0.022*
b 22.766 0.367 0.048
R2 0.9804 0.013*
+ M T E t a s d n a
L Exo-atmosphericIrradiance(Esolλ) Exo-atmosphericreflectance(ρ)(%) a d a l e j n o
M BarreiroR. Bondade Descalvado e
u l
B 1970.0 9.32±0.39 10.20±0.36 10.67±0.38 10.76±0.33 n
e e r
G 1843.0 8.62±0.67 9.88±0.49 9.91±0.52 9.65±0.35 d
e
R 1555.0 6.41±0.93 8.55±1.06 10.09±0.84 10.85±0.79 d e r a r f n i r a e
N 1047.0 25.63±2.16 30.30±1.92 22.51±1.67 20.27±1.02 I d e r a r f n i e v a w t r o h
S 227.10 17.00±2.38 22.03±2.31 25.80±1.99 26.97±2.32 I I d e r a r f n i e v a w t r o h
S 80.53 6.94±1.62 9.83±2.10 15.96±2.30 16.13±2.07 Note: The average reflectance for each pasture is acquired by the following sum of pixels: (217 Monjelada, 495 Barreiro Rico, 89 Bondade and 89 Descalvado).
Table 4 – Conversion of radiance into planetary reflectance. + M T E t a s d n a
L Lmaxλ Lminλ MeanApparentRadiance(Wm
2
– ster–1μm–1)
a d a l e j n o
M BarreiroR. Bondade Descalvado
) e u l b ( 1 d n a
B 191.6 -6.2 36.30 39.73 41.57 41.92
) n e e r g ( 2 d n a
B 196.5 -6.4 31.41 36.02 36.12 35.16
) d e r ( 3 d n a
B 152.9 -5.0 19.66 21.29 30.95 33.27
) d e r a r f n i r a e n ( 4 d n a
B 157.4 -5.1 52.91 62.53 46.91 41.83
) I d e r a r f n i e v a w -t r o h s ( 5 d n a
B 31.06 -1.0 7.64 9.89 11.59 12.11
) I I d e r a r f n i e v a w -t r o h s ( 7 d n a
B 10.8 -0.35 1.11 1.56 2.54 2.57
Lmin λ = spectral radiance range minimum (high gain), Lmax λ = spectral radiance range maximum (high gain).
Table 3 – Conversion of digital numbers to radiance.
Figure 4 – Leaf Area Index of the pastures by field measures.
Figure 5 – Soil carbon stocks for 0-50 cm, expressing the sum of individual soil layers 0-5, 5-10, 10-20, 20-30, 30-40 and 40-50 cm.
54.41 46.71 38.8 31.18 10 20 30 40 50 60 a n ic C a rbo n (0-5 0 cm ) (Mg h a –1) 0 10 Soi l Or g a
Monjelada Barreiro Rico Bondade Descalvado 1,103 0.852 0 4 0.6 0.8 1 1.2 1.4 1.6 L ea f A re a I n d e x ( m ² m –²) 0.371 0.150 0 0.2 0.4 L
the standard deviation of reflectance, there is spectral over-lapping between Bondade and Barreiro Rico. This can be caused by a stronger influence of soil reflectance at Bondade due to bare soil spots.
Three of the four pastures feature a developed plant canopy, fully covering the soil, thus diminishing the influence of soil reflectance on the overall pasture re-flectance. This leads to the assumption in this experi-ment that the differences found in pasture reflectance are mainly linked to differences in plant canopy reflec-tance. The red spectrum suffers spectral absorption by the photosynthetically active pigments of chlorophyll a (absorption max. 675 nm) and b (absorption max. 480 nm) in the green leaves. This leads to the assumption that photosynthesis is responsible for the highest coef-ficient of determination between pasture reflectance and SOC.
The regression analysis between SOC and satellite derived LAI (Figure 8) indicates a highly significant cor-relation (R2
= 0.98) with linear tendency (p < 0.05). Over all high standard deviation for satellite derived LAI is explained by the use of logarithm function for LAIsatellite determination.
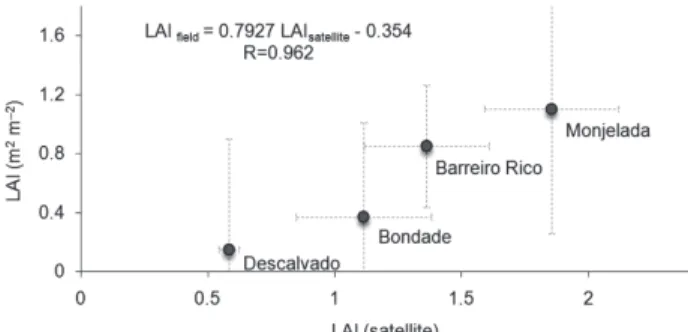
The regression analysis between field measured LAI and satellite derived LAI (Figure 9) identifies a relatively linear tendency (r = 0.96, p < 0.05), however weaker as expected. The relatively low linearity and correlation of the regression can be explained by its “oultlier”, the LAI measures of Bondade farm, which is constituted by irregular plant cover. It is believed that 2 m2 (8 × 0.25 m2
) were not enough to obtain a representative average value for LAIfield from Bondade. However, satellite de-rived LAI values were too high for this study, consider-ing that the value 0 of field measured LAI corresponds to value 0.5054 of satellite derived LAI. It is suggested to investigate this regression under different situations for future improvement of satellite derived LAI.
Conclusions
As SOC does not have specific spectral reflectance behav-ior and cannot be measured directly by remote sensing tech-niques, the study investigated first, if SOC can be estimated
a = gradient, b = intersection with y-axis, R2 = determination coefficient. a
h g M ( C O
S –1)=
a * Reflectance(%) + b R2
7 2 . 4 1
- * Blue(450-520nm) + 188.9 0.882
7 8 . 0 1
- * Green(530-610nm) + 146.2 0.436
1 0 . 5
- * Red(630-690nm) + 87.7 0.959
4 6 . 1
+ * NIR(780-900) + 2.3 0.507
6 1 . 2
- * SWIRI(1550-1750nm) + 92.4 0.939
8 0 . 2
- * SWIRII(2090-2350nm) + 68.2 0.907
7 7 . 8
1 * LAI(satellite) + 19.7 0.981
Table 5 – Regression analysis between soil organic carbon (SOC) and pasture reflectance and LAIsatellite.
Figure 7 – Correlation between SOC and reflectance in the red spectrum of the studied pastures.
Figure 6 – Regression between Soil Organic Carbon and Leaf Area Index by field measures.
by LAI and second, if LAI can be adequately derived from satellite images. A regression analysis between SOC and field measured LAI was significant, showing the suitability of field measured LAI for SOC estimations. Furthermore, a gression analysis between SOC and satellite derived LAI re-sulted in a highly significant coefficient (R² = 0.9812) at a significance level of p < 0.05. The suitability of satellite de-rived LAI for SOC determination of the studied pastures leads to the assumption that orbital remote sensing is a promising SOC estimation technique for pastures on a re-gional scale, especially under the scope of major improve-ments in terms of spatial, spectral and temporal resolution of satellite imagery in recent years. It is acknowledged, that former land use, length of time of the current land use as well as organic matter fertilization have to be taken into ac-count for reliable SOC estimations by orbital remote sens-ing. Further investigations for the suitability of satellite de-rived LAI for SOC estimations are suggested for other pas-tures and land uses.
Acknowledgements
This research was supported by CNPq Grant Nr. 133344/ 2000-2. Authors thank the IRD for providing Landsat 7 data. Special thanks to Dr. Rudolf Richter for providing valu-able information for the atmospheric correction, Dr. Osny Bacchi for providing GPS equipment, and Dr. Carlos Guilherme Silveira Pedreira for assistance at LAI determina-tion. This paper is dedicated to the memory of Vincent Eschenbrenner (1943-2010) who was at the origin of this research.
References
Asner, G.P. 1998. Biophysical and biochemical sources of variability in canopy reflectance. Remote Sensing of Environment 64: 234-253.
Batjes, N.H. 1996. Total carbon and nitrogen in the soils of the world. European Journal of Soil Science 47: 151-163.
Baumgardner, M.F.; Kristof, S.; Johannsen, C.J.; Zachary, A. 1970. Effects of organic matter on the multispectral properties of soils. Indiana Academy of Science 79: 413-422.
Bernoux, M.; Branca, G.; Carro, A., Lipper, L.; Smith, G.; Bockel, L. 2010. Ex-ante greenhouse gas balance of agriculture and forestry development programs. Scientia Agricola 67: 31-40. Bernoux, M.; Carvalho, M.C.S,; Volkoff, B.; Cerri, C.C. 2001. CO2
emission from mineral soils following land-cover change in Brazil. Global Change Biology 7: 779-787.
Figure 9 – Regression analysis between field measured LAI and satellite derived LAI of the studied pastures.
Bernoux, M.; Carvalho, M.C.S.; Volkoff, B.; Cerri, C.C. 2002. Brazil’s soil carbon stocks. Soil Science Society of America Journal 66: 888-896
Bernoux, M.; Cerri, C.C.; Cerri, C.E.P.; Siqueira Neto, M.; Metay, A.; Perrin, A.S.; Scopel, E.; Razafimbelo, T.; Blavet, D.; Piccolo, M.C.; Pavei, M.; Milne, E. 2006. Cropping systems, carbon sequestration and erosion in Brazil, a review. Agronomy for Sustainable Development 26: 1-8.
Blanchart, E.; Albrecht, A.; Bernoux, M.; Brauman, A.; Chotte, J.L.; Feller, C.; Ganry, F.; Hien, E.; Manlay, R.; Masse, D.; Sall, S.; Villenave C. 2007. Organic matter and biofunctioning in tropical sandy soils and implications for their management. In: First management of tropical sandy soils for sustainable agriculture: a holistic approach for sustainable development of problem soils in the tropics. 536 p. Available at: http:// www.fao.org/docrep/010/ag125e/AG125E00.htm).
Broge, N.H.; Leblanc, E. 2001. Comparing prediction power and stability of broadband and hyperspectral vegetation indices for estimation of green leaf area index and canopy chlorophyll density. Remote Sensing of Environment 76: 156-172. Campbell, G.S.; Norman, J.M. 1998 An Introduction to Environmental
Biophysics. Springer, New York, NY, USA. p. 268.
Cerri, C.C.; Bernoux, M.; Cerri, C.E.P., Feller, C. 2004. Carbon cycling and sequestration opportunities in South America: the case of Brazil. Soil Use and Management 20: 248-254.
Cerri, C.C.; Bernoux, M.; Maia, S.M.F.; Cerri, C.E.P.; Costa Júnior, C.; Feigl, B.J.; Frazão, L.A.; Mello, F.C.; Galdos, M.V.; Moreira, C.S.; Carvalho, J.L.N. 2010. Greenhouse gas mitigation options in Brazil for land-use change, livestock and agriculture. Scientia Agricola 67: 102-116.
Cerri, C.E.P.; Sparovek, G.; Bernoux, M.; Easterling, W.E.; Melillo, J.M.; Cerri, C.C. 2007. Tropical agriculture and global warming: impacts and mitigation options. Scientia Agricola 64: 83-89. Chen, F.; Kissel, D.E.; West, L.T.; Adkins, W. 2010. Field-scale
mapping of surface soil organic carbon using remotely sensed imagery. Soil Science Society of America Journal 64: 746-753. Choudhury, B.J.; Ahmed, A.H.; Idso, S.B.; Reginato, R.J.;
Daughtry, C.S.T. 1994. Relations between evaporation coefficients and vegetation indices studied by model simulations. Remote Sensing of the Environment 50: 1-17. Ellert, B.H.; Bettany, J.R. 1995. Calculation of organic matter
stored in soils under contrasting management regimes. Canadian Journal of Soil Science 75: 529-538.
Empresa Brasileira de Pesquisa Agropecuária [Embrapa]. 2010. Climate database of Brazil. Available at: http://www.bdclima.cnpm. embrapa.br. [Accessed Aug. 02, 2010]. (in Portuguese).
Empresa Brasileira de Pesquisa Agropecuária. [Embrapa]. 1979. Manual for soil analysis methods. Rio de Janeiro: Embrapa-CNPS, Rio de Janeiro, RJ, Brazil. (in Portuguese).
Escola Superior De Agricultura “Luiz De Queiroz” [ESALQ/USP]. 2003. Database of automated meteorological station. Available at: http://ce.esalq.usp.br/dce/postoaut.htm. [Accessed Aug 28, 2003]. (in Portuguese).
Fagundes, J.L.; Da Silva, S.C.; Pedreira, C.G.; Sbrissia, A.F.; Carnevalli, R.A.; De Carvalho; C.A.; Pinto, L.F. 1999. Canopy characteristics and herbage accumulation of Cynodon spp submitted to different grazing intensities. Scientia Agricola 56: 1141-1149. (in Portuguese, with abstract in English).
Folegatti, M.V.; Camponez Do Brasil, R.P.; Blanco, F.F. 2001. Sampling equipment for soil bulk density determination tested in a kandiudalfic eutrudox and a typic hapludox. Scientia Agricola 58: 833-838.
Friedl, M.A. 1997. Examining the effects of sensor resolution and sub-pixel heterogeneity on spectral vegetation indices: Implications for biophysical modelling. p. 125-139. In Quattrochi, D.A.; Goodchild, M.F. Scale in remote sensing and GIS. Lewis, Boca Raton, FL, USA.
Received March 19, 2010 Accepted November 04, 2010 Henderson, T.L.; Szilagyi, A., Baumgardner; M.F., Chen, C.C.T.
Landgrebe, D.A. 1989. Spectral band selection for classification of soil organic-matter content. Soil Science Society of America Journal 53: 1778-1784.
Henderson, T.L.; Baumgardner, M.F.; Franzmeier, D.P.; Stott, D.E.; Coster, D.C. 1992. High dimensional reflectance analysis of soil organic-matter. Soil Science Society of America Journal 865-872.
Hodgson, J.G. 1990. Grazing management: science into practice. Longman Scientific and Technical, Essex, UK.
Hummel, J.W.; Sudduth, K.A.; Hollinger, S.E. 2001 Soil moisture and organic matter prediction of surface and subsurface soils using an NIR soil sensor. Computers and Electronics in Agriculture 32: 149-165.
Ingram, J.S.I.; Fernandes, E.C.M. 2001. Managing carbon sequestration in soils: concepts and terminology. Agriculture Ecosystems Environment 87: 111-117.
Intergovernmental Panel on Climate Change [IPCC]. 2000. Land use, land-use change, and forestry special report. IPCC, Cambridge, UK.
Lal, R.; Cerri, C.C.; Bernoux, M.; Etchevers, J.; Cerri, C.E.P. 2006. Carbon Sequestration in Soils of Latin America. Food Products Press, Haworth Press, Binghamton, NY, USA. 554 p. Levine, E.; Kimes, D.; Fifer, S.; Nelson, R. 2000. Evaluating tropical
soil properties with pedon data, satellite imagery, and neural networks. p. 365-375. In Lal, R.; Kimble, J.M.; Stewart, B.A. (eds.), Global climate change and tropical ecosystems. CRC Press, Boca Raton, FL, USA.
Markham, B.L.; Barker, J.L. 1986. Landsat MSS and TM postcallibration on dynamic ranges of exoatmospheric reflectances and at satellite temperatures. Lanham, MD, USA. (Landsat Technical Notes).
Milne, E.; Al-Adamat, R.; Batjes, N.H.; Bernoux, M.; Bhattacharyya, T.; Cerri, C.C.; Cerri, C.E.P.; Coleman, K.; Easter, M.; Falloon, P.; Feller, C.; Gicheru, P.; Kamoni, P.; Killian, K.; Pal, D.K.; Paustian, K.; Powlson, D.; Rawajfih, Z.; Sessay, M.; Williams, S.; Wokabi, S. 2007. National and sub national assessments of soil organic carbon stocks and changes: the GEFSOC modelling system. Agriculture Ecosystems and Environment 122: 3-12.
Moraes, J.L.; Cerri, C.C.; Volkoff, B.; Bernoux, M. 1996. Soil properties under Amazon forest and changes due to pasture installation in Rondônia, Brazil. Geoderma 70: 63-81.
Moreira, M.A. 2001. Fundamentals and Applied Methods of Remote Sensing. INPE, São José dos Campos, SP, Brazil. (in Portuguese). NASA. Landsat 7 science data users handbook 2009. Available at: http:/ /landsathandbook.gsfc.nasa.gov/handbook.html. [Accessed Feb. 10, 2010].
Oliveira, I.P.; Kluthcouski, J.; Yokoyama, L.P.; Dutra, L.G.; Portes, T.A.; Silva, A.E.; Pinheiro, B.S.; Ferreira, E.; Castro, E.M.; Guimarães, C.M.; Gomide, J.C.; Balbino, L.C. 1996. System Barreirão: Recovery of degraded pastures associated with annual cultures. Embrapa-CNPAF, Santo Antônio de Goiás, GO, Brazil. (in Portuguese). Parton, W.J.; Schimel, D.S.; Cole, C.V.; Ojima, D.S. 1987. Analysis of
factors controlling soil organic-matter levels in great-plains grasslands. Soil Science Society of America Journal 51: 1173-1179.
Pino, F.A. 2009. Preliminary analysis of an agricultural census: Project Lupa in the state of São Paulo, Brazil. CATI, Campinas, SP, Brazil. 20 p. Available at: http://www.cati.sp.gov.br/ p r o j e t o l u p a / e s t u d o s _ l u p a / Artigo_Lupa_Analise_Preliminar.pdf. [Accessed Nov. 14, 2010].(in Portuguese, with abstract in English).
Price, J.C.; Bausch, W.C. 1995. Leaf area index estimation from visible and near-infrared reflectance data. Remote Sensing of Environment 52: 55-65.
Reeves III, J.; McCarty, G.; Mimmo, T. 2003. The potential of diffuse reflectance spectroscopy for the determination of carbon inventories in soils. Environmental Pollution 116: 277-284. Shonk, J.L.; Gaultney, L.D.; Schulze, D.G.; Vanscoyoc, G.E. 1991.
Spectroscopic sensing of soil organic-matter content. Transactions of the ASAE 34: 1978-1984.
Trimble Navigation Limited. 1999. Characterizing accuracy of Trimble Pathfinder mapping receivers. Trimble Navigation Limited, Sunnyvale, CA, USA, 1999.
Turner, D.P.; Cohen, W.B.; Kennedy, R.E.; Fassnacht, K.S.; Briggs, J.M. 1999. Relationships between LAI and Landsat TM spectral vegetation indices across three temperate zone sites. Remote Sensing of Environment 70: 52-68.