GENOTYPIC CHARACTERIZATION OF
MICROSATELLITE MARKERS IN BROILER AND LAYER
SELECTED CHICKEN LINES AND THEIR RECIPROCAL F
1s
Millor Fernandes do Rosário1; Mônica Corrêa Ledur2; Ana Silvia Alves Meira Tavares Moura3; Luiz Lehmann Coutinho4*; Antonio Augusto Franco Garcia5
1
USP/ESALQ - Programa de Pós-Graduação em Genética e Melhoramento de Plantas.
2
Embrapa Suínos e Aves, C.P. 21 - 89700-000 - Concórdia, SC - Brasil.
3
UNESP/FMVZ - Depto. de Produção Animal, C.P. 560 - 18618-000 - Botucatu, SP - Brasil.
4
USP/ESALQ - Depto. de Zootecnia, C.P. 9 - 13418-900 - Piracicaba, SP - Brasil.
5
USP/ESALQ - Depto. de Genética, C.P. 83 - 13400-970 - Piracicaba, SP - Brasil. *Corresponding author <[email protected]>
ABSTRACT: Chicken experimental populations have been developed worldwide for QTL mapping, but their genotypic characterizations are not usually discussed. The objective of this study was to characterize genotypically two F1 reciprocal generations and their parental lines based on the estimation of genotypic parameters. These F
1 generations originated two Brazilian reference populations to map QTL. The evaluated parameters were polymorphic information content (PIC), observed and expected heterozygosities and number of alleles at microsatellite loci on chromosomes 1, 3 and 4. All parental and F
1 chickens from both populations were used totalling of 83 chickens: 14 from a broiler (TT) and 14 from a layer line (CC) and 55 from their reciprocal F1 generations. The chicken lines and the resource populations were developed at the National Research Center for Swine and Poultry (EMBRAPA), Brazil. Genotypes from all animals were obtained from 34 loci on chromosomes 1 (13), 3 (12) and 4 (9). Based on the sampling, we found that the two lines exhibited a total of 163 different alleles, of which 31 (31.1%) and 44 (33.0%) alleles were unique in CC and TT lines, respectively, with allelic frequencies ranging from 0.03 to 0.82. The observed heterozygosity was higher (0.68–0.71) in both F1 generations than in their founder lines due to linkage disequilibrium. Finally, the two chicken lines used as founders created two F
1 reciprocal generations with high levels of PIC (0.50–0.52) and observed heterozygosity, as well as satisfactory number of alleles per locus (4.06–4.32). Our results will allow to compare and select families with highly informative microsatellite markers for QTL studies, reducing genotyping costs.
Key words: PIC, genotypic diversity, heterozygosity, number of alleles
CARACTERIZAÇÃO GENOTÍPICA DE LINHAGENS SELECIONADAS
DE GALINHA DE CORTE E POSTURA E SEUS F
1s RECÍPROCOS
USANDO MARCADORES MICROSSATÉLITES
RESUMO:Populações experimentais de frangos tem sido desenvolvidas pelo mundo para mapeamento de QTLs, mas a caracterização genotípica delas não é normalmente apresentada. O objetivo deste estudo foi caracterizar genotipicamente duas gerações F1 recíprocas e suas linhagens parentais com base na estimação de parâmetros genotípicos. Estas gerações F1 originaram duas populações brasileiras referências para mapear QTLs. Os parâmetros avaliados foram: conteúdo de informação polimórfica (PIC), heterozigosidades observada e esperada e número de alelos por loco nos cromossomos 1, 3 e 4. Todos os animais parentais e F1 de ambas as populações foram usados, em um total de 83 animais: 14 de uma linhagem de corte (TT) e 14 de uma linhagem de postura (CC), e 55 de suas gerações recíprocas F1. Tanto as linhagens como as populações referências foram desenvolvidas no Centro Nacional de Pesquisa de Suínos e Aves (EMBRAPA), Brasil. Os genótipos de todos os animais foram obtidos a partir de 34 marcadores microssatélites localizados nos cromossomos 1 (13), 3 (12) e 4 (9). Com base na amostragem realizada, as duas linhagens exibiram um total de 163 alelos, dos quais 31 (31,1%) e 44 (33,0%) foram oriundos exclusivamente de CC e TT, respectivamente, com freqüências alélicas que variaram de 0,03 a 0,82. A heterozigosidade observada foi maior (0,68– 0,71) em ambas as gerações F
F1 com valores elevados de PIC (0,50–0,52) e heterozigosidade observada, bem como com um número satisfatório de alelos por loco (4,06–4,32). Estes resultados permitirão comparar e selecionar famílias e marcadores microssatélites mais informativos em estudos de QTLs, reduzindo os custos de genotipagem.
Palavras-chave: PIC, diversidade genotípica, heterozigosidade, número de alelos
INTRODUCTION
In Brazil, two F2 chicken populations for map-ping QTL for performance and carcass traits were de-veloped in 1999 with joint efforts of the National Re-search Center for Swine and Poultry, from EMBRAPA, in association with the “Luiz de Queiroz” College of Agriculture of the University of São Paulo. These popu-lations were named TCTC and CTCT because they were developed from the reciprocal crossbreeding of a broiler line (TT) and a layer line (CC). Phenotypic description of these populations is in Zanella et al. (2000) and Ledur & Bertani (2002). Description of other experimental chicken populations can be found in a review about QTL published by Abasht et al. (2006).
Nevertheless these two chicken populations have not been described genotypically yet. Using microsatellite markers and estimating genotypic param-eters such as polymorphism information content (PIC) and heterozygosity are recommended strategies for de-termining the informativeness of markers. From these two parameters, there are two strategies to increase the power for QTL detection and reduce the genotyping costs in chicken populations: the first one is a forward strategy, where prior to create the ex-perimental population, an initial screening of chickens from parental lines can be useful to select the highly informative parental that present the best combination of these parameters, generating F
1 families with
in-creased genotypic polymorphic content; and the sec-ond is the reverse strategy, where after the experimental population is created, a screening of all F1 families can be useful to select highly informative families (Hillel, 1997; Zhu et al., 2001).
It is also possible that these genotypic param-eters are used in other QTL studies because they pro-vide information about markers in populations designed to map QTL and this information has not been pub-lished yet. Although genotypic description can vary among populations due to different genetic back-ground, this information can help the initial selection of more informative markers and families in QTL stud-ies. Therefore, the purpose of this study was to re-port the genotypic parameters for two F1 generations used to create two F2 resource populations to map QTL and their parental lines, using microsatellite loci from chromosomes 1, 3 and 4.
MATERIAL AND METHODS
Chicken lines and their F1 generations
TT is a male broiler line whose selection pro-gram involved within line selection for six generations to improve body weight, feed conversion, carcass and breast yields, viability, fertility, eclodibility, reduction of abdominal fat and metabolic syndromes (ascites and sudden death). CC is a layer line whose selection pro-gram involved within line selection for eight genera-tions to improve egg production, egg weight, feed con-version, viability, sexual maturity, fertility, eclodibility, egg quality and reduction of body weight.
The lines also differ in their genetic back-ground. The broiler line TT originated from White Ply-mouth Rock, New Hampshire and White Cornish breeds, while the layer line CC was originated from the White Leghorn breed. Both lines were developed at the National Research Center for Swine and try - EMBRAPA, Brazil. Details on the EMBRAPA Poul-try Breeding Program are in Figueiredo et al. (2003a, 2003b).
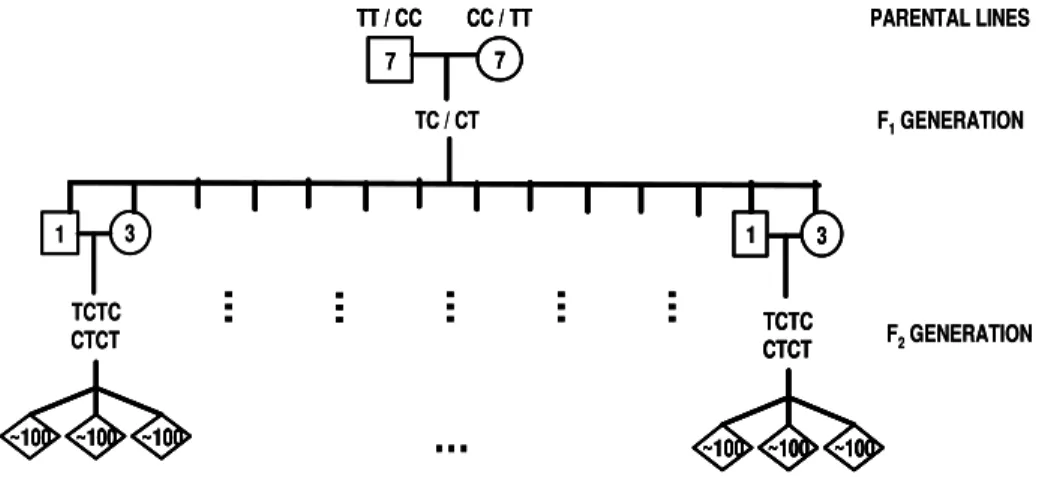
Two F2 chicken resource populations (TCTC and CTCT) were developed at EMBRAPA by recipro-cally crossing the broiler line (TT) and the layer line (CC). This aimed at producing populations with seg-regating QTL for performance and carcass traits. Seven TT males were mated to seven CC females to generate about 50 F1 TC chickens, and seven CC males were mated to seven TT females to generate about 50 F1 CT chickens. A total of seven males and 21 females (one male and three females from each full-sib fam-ily) from the F1 generation were selected to be par-ents of the F2 population. Each F1 male was mated to three non-related F1 females to produce the F2 genera-tion. Each female produced around 100 F2 offspring (Zanella et al., 2000). Figure 1 shows a scheme of the design of these populations.
In the present study, data from the parental TT (14) and CC (14) chicken lines and their F1 genera-tions (28 TC and 27 CT) were used. One F1 CT fe-male died before its blood sample was collected.
Analysis of DNA, genotypes and pedigree
Genomic DNA from parental and F1 genera-tions of TCTC and CTCT populagenera-tions was extracted from blood samples using the DNAzol®
microsatellite markers covering chromosomes 1 (13
-ADL0234, MCW0297, LEI0174, ADL0150,
MCW0112, MCW0058, LEI0071, LEI0160, LEI0169,
LEI0079, LEI0107, ADL0183, MCW0145), 3 (12
-LEI0043, MCW0169, MCW0083, ADL0370,
MCW0222, LEI0161, LEI0115, ADL0371, LEI0118,
MCW0277, ADL0127, MCW0116) and 4 (9
-LEI0100, ADL0194, LEI0122, LEI0062, LEI0076,
MCW0240, LEI0063, LEI0085, MCW0174) were used. The primer sequences (forward and reverse) are available at <http://www.thearkdb.org/>. These mark-ers covered a total of 665 cM, about 16% of the chicken genome according to Consensus Linkage Map (Schmid et al., 2005).
Each PCR reaction had total volume of 15 µL containing 4.00 ηg µL–1
of DNA, forward and reverse primers ranging from 0.10 to 0.47 ρmol µL–1
, MgCl2 ranging from 2.00 to 7.00 mM, buffer with 50 mM KCl and 10 mM Tris-HCl pH 8.5, 0.40 mM of dNTP and Taq DNA polymerase ranging from 0.07 to 0.40 U µL–1. The genomic DNA was amplified in thermocycler according to the following program: ini-tial denaturation at 94ºC for 2 minutes, and 30 cycles of: 1 minute at 94°C, 1 minute at 47 to 66ºC (anneal-ing temperature) depend(anneal-ing on primer sequence, and an extension of 1 minute at 72ºC. After the 30 cycles, an extension at 72ºC for 10 minutes was conducted.
PCR products from up to four markers were mixed for allele size and fluorescence determinations in a MegaBACE® genotyper (GE Healthcare). Fragment size (alleles) was determined employing the Genetic Profiler®
software (GE Healthcare) using ETROX-400®
(GE Healthcare) as an internal molecular weight pat-tern.
Genotypes from parental chickens (TT and CC) were used to check the pedigree within popula-tion using the PEDCHECK software®
at <http://
bioinfo.cs.technion.ac.il/superlink-online/makeped/ pedcheck.shtml> (Fishelson & Geiger, 2002).
Estimation of genotypic parameters
Allelic frequencies and goodness-of-fit tests for Hardy-Weinberg expected proportions using Markov chain method (p < 0.05) for each locus with multiple alleles (Guo & Thompson, 1992) were obtained with the Genepop software®
(Raymond & Rousset, 1995). The Markov chain parameters were: number of dememorization (1000), number of batches (100) and number of iterations per batch (1000).
Polymorphism information content (PIC) was calculated using the formula:
2 1 1 1 2 1 2 2 1 j j j i i j i j i
i P P
P
PIC
∑
∑ ∑
+ = − = = − − =
where Pi and Pjare the frequencies of the ith and jt h
alleles at a locus with l alleles in a population, respec-tively (Botstein et al., 1980).
Observed heterozygosity (Hetobs) was calcu-lated based on the actual counts of heterozygous mark-ers in an individual chicken using:
N Z Het N i j obs / 1 =
∑
=where Zjis the actual count of heterozygous chickens at locus j, and N is the total number of chickens. Un-biased Nei’s expected heterozygosity (Hetexp) assum-ing Hardy-Weinberg expected proportions was obtained using the formula:
− − =
∑
= l j j P N N Het 1 2 exp 1 1 2 2where P
jis the frequency for the j th
allele at the ith
lo-cus with l alleles in a population, and N is the number of chickens (Nei, 1987).
Figure 1 - Simplified scheme of the design of two Brazilian F2 chicken resource populations to map QTL for performance and carcass traits generated from crosses between a layer (CC) and a broiler (TT) lines. The symbols £, ™ and ¯ represent male, female and mixed sex, respectively.
TC / CT 7 7
CC / TT TT / CC
1 3
TCTC CTCT
~100 ~100 ~100
…
1 3
TCTC CTCT
~100 ~100 ~100
…
…
…
…
PARENTAL LINES
F1GENERATION
F2GENERATION
…
TC / CT 7 7
CC / TT TT / CC
7 7
CC / TT TT / CC
1 3
TCTC CTCT
~100 ~100 ~100 ~100 ~100~100 ~100~100
…
1 3
TCTC CTCT
~100 ~100 ~100
1 3
TCTC CTCT
~100 ~100 ~100 ~100 ~100~100 ~100~100
…
…
…
…
PARENTAL LINES
F1GENERATION
F2GENERATION
PIC and heterozygosities were estimated for each locus using the Cervus® software (Marshall et al., 1998; Slate et al., 2000; Kalinowski et al., 2007) in Al-lele Frequency Analysis mode with Bonferroni correc-tion for multiple tests. We presented results from PIC
and heterozygosities based on arithmetic average across all loci.
RESULTS AND DISCUSSION
This is the first report of the genotypic char-acterization of two Brazilian chicken lines and their F
1
reciprocal generations that were used to create two F
2
resource populations. These populations have been used for QTL mapping for performance and carcass traits (Nones et al., 2005; Ruy et al., 2005; Nones et al., 2006; Ambo et al., 2008).
We estimated genotypic parameters for F1 gen-erations, and their parental chicken lines based on microsatellite loci from chromosomes 1, 3 and 4. Ge-notypic diversity across all estimated parameters was observed in both generations. In a preliminary study, Rosário et al. (2006) found that F1 TC had a slightly higher overall genotypic diversity than F
1 CT when
those authors used only 22 microsatellite markers and no standard errors were estimated on genotypic pa-rameters (PIC and heterozygosities). In this study we used the information from those 22 plus 12 new microsatellite markers and we estimated the standard errors of each genotypic parameter. Thus, we found that both F1 generations were similar, which is accept-able since both were created from the same founder lines, differing only in the reciprocal crosses. Other studies have been carried out to assess genetic diver-sity in chickens using microsatellite markers (Vanhala et al., 1998; Kaiser et al., 2000; Romanov & Weigend, 2001; Hillel et al., 2003). In general, these studies es-tablished the Red Jungle Fowl as the main progenitor of the domesticated chickens.
Some measures of marker information, such as PIC and heterozygosity, increase as a function of the number of alleles per locus considering the same allelic frequency (Lynch & Walsh, 1998). For ex-ample, increasing from 2 up to 8 alleles per locus,
PIC increased from 0.40 to 0.80 and heterozygosity from 0.45 to 0.80. According to Figures 2, 3 and 4, the 34 microsatellite markers on chromosomes 1, 3 and 4 exhibited a total 163 different alleles in both lines. In the CC line 106 alleles (mean of 3.12 ± 0.19 per locus) were found, whereas in the TT line 133 alleles (mean of 3.92 ± 0.26 per locus) were detected. The number of alleles per locus ranged from 1 (MCW0277) to 7 (LEI0076) for the CC line and from
2 (LEI0062, MCW0058, LEI0043, MCW0083 and
MCW0116) to 7 (LEI0107, MCW0169 and
MCW0240) for the TT line. Allelic frequencies ranged from 0.03 to 0.93 for both lines. Results showed that 4 (11.7%) and 6 (17.6%) markers did not fit Hardy-Weinberg expected proportions for CC and TT lines, respectively. These deviations may be caused by the small sample size (14 parental chick-ens in each line) and/or the close linkage between the markers used and some loci selected in the lines. From 163 different alleles, a total of 31 (31.1%) and 44 (33.0%) alleles were unique in CC and TT lines, respectively, and their allelic frequencies ranged from 0.03 to 0.82.
To reduce confounding of allele sizes due to genotyping errors, we considered an interval of ± 2 base pairs as a criterion to compare our results with those of the Animal Sciences Group at AceBrowser of Wageningen University and Research Center at <https:/ /acedb.asg.wur.nl> which contains data from the popu-lations reported by Groenen et al. (2000) to map QTL. According to this criterion, we found 15.2 (CC) and 44.6 (TT) % higher average number of alleles per lo-cus than that database for the same loci. This result was surprising because we expected that the number of alleles per locus in our lines would be lower than the database, which was composed only by genotypes from backcross or F2 populations (with no genotypes from their founder lines). The microsatellite markers used here are the same as those used in the database, but they were developed in the populations reported by Groenen et al. (2000), which present similar, but not the same genetic background: Red Jungle Fowl, White Leghorn and White Plymouth Rock as in our study. Therefore, one possible explanation for diver-gence between our results and the database may be the genetic background. In addition, the lines used to develop the populations reported by Groenen et al. (2000) were selected for different purposes, with some being inbred lines which would lead to fixing some al-leles and losing others.
PIC values, observed and expected heterozy-gosities for each locus are presented in Table 1. These data are important for marker selection, since they al-low the use of both markers and families which are more informative for QTL mapping. The average PIC
values, observed and expected heterozygosities and number of alleles per locus for CC, TT, F1 CT and F1 TC are shown in Figure 5. The range of values for the lines and their F1 generations were: 0.39–0.52, 0.48–0.71, 0.46–0.59 and 3.12–4.32 for PIC, ob-served and expected heterozygosities and number of alleles per locus, respectively. In general, these four genotypic parameters presented similar trends, where the CC line showed the lowest means (p < 0.05), ex-cept for observed heterozygosity. Therefore, the CC line presented the smallest genotypic diversity in our study. This result may be explained because this line was selected for eight generations on egg traits whereas the TT line was only selected for six gen-erations on performance traits, associated with the different genetic backgrounds from each line. CC had only one breed in its genetic background, while TT had others three. Fixation of some more alleles in CC than TT might be due to selection cycles during which some alleles in CC were lost. Our results sup-port this hypothesis. Consequently, this line showed the lowest PIC and expected heterozygosity. CC pre-sented a lower average number of alleles per locus than TT. Observed heterozygosity did not differ be-tween CC and TT. Considering the difference in ber of alleles, this finding resulted in a higher num-ber of loci not fitting Hardy-Weinnum-berg expected pro-portions in TT (MCW0058, LEI0169 and LEI0107 in Figure 2, LEI0115 and ADL0371 in Figure 3 and
LEI0062 in Figure 4) than in CC (LEI0122, LEI0062,
LEI0076 and MCW0174 in Figure 3).
Average observed heterozygosities in F1 TC (0.71) and CT (0.68) were higher than average pected heterozygosities based on Hardy-Weinberg ex-pected proportions in F1 TC (0.57) and CT (0.57) ac-cording to Figure 5. Our results were in partial agree-ment with those from Vanhala et al. (1998) who found that observed heterozygosity ranged from 0.30 up to 0.67 and expected heterozygosity ranged from 0.37 up to 0.67, respectively, for eight selected chicken lines. However, we expected our heterozygosities might be higher than those authors because our F1 generations were obtained from reciprocal crosses between two different founder lines that might have increased these parameters. This difference between both heterozy-gosities may be explained because the crossbreeding between the two chicken lines, previously submitted to constant and intensive artificial selection programs for different traits and selection emphases, probably lead to fixation of different alleles in each line. In fact, based on our sampling, we found that 31 and 44 alle-les were unique in CC and TT lines, respectively. This fact may have maximized the linkage disequilibrium across all loci and probably it will increase the power Table 1 - Polymorphism information content (PIC),
observed (Hetobs) and expected (Hetexp) heterozygosities for each locus microsatellite marker.
*Heterozygosity based on the Hardy-Weinberg expected
proportions
Marker PIC Hetobs Hetexp*
CC TT CC TT CC TT
Chromosome 1
ADL0234 0.46 0.23 0.50 0.57 0.29 0.26 MCW0297 0.13 0.41 0.14 0.14 0.43 0.49 LEI0174 0.42 0.49 0.50 0.55 0.64 0.57 ADL0150 0.37 0.30 0.50 0.42 0.36 0.32 MCW0112 0.37 0.35 0.50 0.42 0.43 0.38 MCW0058 0.43 0.35 0.50 0.50 0.14 0.48 LEI0071 0.43 0.66 0.43 0.48 0.46 0.73 LEI0160 0.30 0.47 0.36 0.39 0.50 0.52 LEI0169 0.33 0.53 0.36 0.37 0.36 0.59 LEI0079 0.55 0.44 0.86 0.65 0.57 0.50 LEI0107 0.62 0.79 0.79 0.68 0.86 0.84 ADL0183 0.38 0.75 0.64 0.47 0.92 0.81 MCW0145 0.51 0.64 0.57 0.58 0.57 0.72
Chromosome 3
LEI0043 0.44 0.12 0.64 0.50 0.14 0.14 MCW0169 0.50 0.80 0.64 0.60 0.93 0.85
MCW0083 0.23 0.37 0.29 0.26 0.57 0.52 ADL0370 0.12 0.42 0.14 0.14 0.43 0.55 MCW0222 0.62 0.52 1.00 0.70 1.00 0.63 LEI0161 0.33 0.44 0.43 0.37 0.43 0.50 LEI0115 0.21 0.50 0.29 0.25 0.29 0.59 ADL0371 0.46 0.42 0.36 0.58 0.23 0.54 LEI0118 0.54 0.70 0.71 0.64 0.93 0.77 MCW0277 0.00 0.53 0.00 0.00 0.71 0.62 ADL0127 0.28 0.50 0.43 0.35 0.71 0.60 MCW0116 0.32 0.12 0.29 0.37 0.14 0.14
Chromosome 4
LEI0100 0.37 0.27 0.50 0.52 0.29 0.31 ADL0194 0.50 0.68 0.57 0.59 0.50 0.75 LEI0122 0.47 0.54 0.14 0.58 0.50 0.62
LEI0062 0.46 0.41 0.78 0.56 0.57 0.49 LEI0076 0.78 0.75 0.71 0.84 0.79 0.81 MCW0240 0.52 0.80 0.85 0.61 0.86 0.86
LEI0063 0.45 0.46 0.57 0.53 0.61 0.56 LEI0085 0.13 0.57 0.14 0.14 0.79 0.66
for QTL detection in our F2 populations. Additionally, the differences between observed and expected heterozygosities in founder lines and their F1 genera-tions may be also due to the genetic drift caused by the sampling error resulting from the small num-ber of males (14) and females (14) selected within each founder line to generate the F1s. Therefore, the
genetic diversity in parental lines and their reciprocal F1s might actually be higher than the one calculated here.
Although comparison of results from different studies of this nature can be difficult because each one uses specific populations generated from different lines assessed by different markers, we tried to compare
Figure 2 - Summary of overall allele sizes (bp is base pairs) and their respective frequencies across all loci for CC and TT lines and goodness-of-fit test for Hardy-Weinberg expected proportions (HWEP) for chromosome 1. White bars represent the CC line and black bars the TT line. *p < 0.05 according to Markov chain method test for HWEP.
Alleles (bp)
Frequency
ADL0234
0 0.2 0.4 0.6 0.81
159 161 163 166
LEI0174
0 0.2 0.4 0.6 0.8 1
229 233 255
MCW0112
0 0.2 0.4 0.6 0.81
262 267 272 274 276 278
LEI0071
0 0.2 0.4 0.6 0.8 1
214 224 230 277 308 310 318 327
LEI0169
0 0.2 0.4 0.6 0.8 1
233 235 237 245 249 251
* * *
*
LEI0107
0 0.2 0.4 0.6 0.81
207 209 211 214 224 228 230 277 310
* * * * * * *
MCW0145
0 0.2 0.4 0.6 0.8 1
164 192 203 205 207 210
MCW0297
288 290 295 313
ADL0150
146 156 158 160 162
MCW0058
166 183 187
*
*
LEI0160
246 248 250 252
LEI0079
208 210 212 218
ADL0183
our results with those that had already been published. Our results (Figure 5) were similar to those of Crooijmans et al. (1996) who reported average PIC
(0.45), average estimated heterozygosity (0.52) and average number of alleles per locus (3.6) in broiler dam and male lines. Vanhala et al. (1998) found aver-age number of alleles of 5.7 per locus in a commer-cial broiler line while Kaiser et al. (2000) determined the average number of alleles to be 2.85 per locus in two broiler chicken populations from two different pri-mary breeding companies.
Associating high observed heterozygosity and PIC values in both F1 generations (Figure 5) is very interesting because they may open the possibil-ity to increase the power for QTL detection through selection of informative markers (Lynch & Walsh, 1998) and informative F
1 families (Zhu et
al., 2001), reducing genotyping costs in QTL stud-ies. Furthermore, our results will be useful to compare the informativeness of microsatellite mark-ers with other studies and help other groups inter-ested in mapping QTL in chickens to select
Figure 3 - Summary of overall allele sizes (bp is base pairs) and their respective frequencies across all loci for CC and TT lines and goodness-of-fit test for Hardy-Weinberg expected proportions (HWEP) for chromosome 3. White bars represent the CC line and black bars the TT line. *p < 0.05 according to Markov chain method test for HWEP.
Alleles (bp)
Frequency
LEI0043
0 0.2 0.4 0.6 0.8 1
106 110 114 118
MCW0083
0 0.2 0.4 0.6 0.8 1
84 87 89 91
MCW0222
0 0.2 0.4 0.6 0.81
221 223 225
LEI0115
0 0.2 0.4 0.6 0.8 1
274 276 292
*
* *
LEI0118
0 0.2 0.4 0.6 0.8 1
68 75 82 86 88 91
ADL0127
0 0.2 0.4 0.6 0.8 1
145 147 149 153
MCW0169
61 63 80 91 94 97 99 101 103
ADL0370
186 191 195
LEI0161
87 91 93
ADL0371
159 166 170 174
*
*
*
MCW0277
257 263 269
MCW0116
markers based on the informativeness of markers used in our study.
ACKNOWLEDGEMENTS
To FAPESP and EMBRAPA/PRODETAB for financial support. M.F. Rosário received scholarship from FAPESP (process number 04/02080-2). A.A.F. Garcia and L.L. Coutinho are recipients of research productivity scholarship from CNPq.
REFERENCES
ABASHT, B.; DEKKERS, J.C.M.; LAMONT, S.J. Review of quantitative trait loci identified in the chicken. Poultry Science, v.85, p.2079-2096, 2006.
AL-NASSER, A.; AL-KHALAIFA, H.; AL-SAFFAR, A.; KHALIL, F.; ALBAHOUH, M.; RAGHEB, G.; AL-HADDAD, A.; MASHALY, M. Overview of chicken taxonomy and domestication. World’s Poultry Science Journal, v.63, p.285-300, 2007.
Figure 4 - Summary of overall allele sizes (bp is base pairs) and their respective frequencies across all loci for CC and TT lines and goodness-of-fit test for Hardy-Weinberg expected proportions (HWEP) for chromosome 4. White bars represent the CC line and black bars the TT lines.
Alleles (bp)
Frequency
Figure 5 - Means ± standard errors of the polymorphism information content (PIC), observed heterozygosity (Hetobs), expected heterozygosity (Hetexp), in percentages (left scale), and number of alleles per locus (right scale) for CC and TT lines and their reciprocal F1 generations (F1 CT and F1 TC) across all loci.
0 0.5 1 1.5 2 2.5 3 3.5 4 4.5 5
0 0.1 0.2 0.3 0.4 0.5 0.6 0.7 0.8 0.9 1
CC TT F1 CT F1 T C
Average number of alleles per locus
Percentage
Parental lines Generations
PIC HetobsHetobs HetespHetexp Alleles
F1CT F1TC
CC TT
PIC Alleles
LEI0100
0 0.2 0.4 0.6 0.8 1
264 270 272 275
LEI0122
0 0.2 0.4 0.6 0.81
289 292 299 301 303
*
* *
LEI0076
0 0.2 0.4 0.6 0.8 1
240 253 255 265 267 269 271 281 288
* * * * * * *
LEI0063
0 0.2 0.4 0.6 0.81
210 212 214
MCW0174
0 0.2 0.4 0.6 0.8 1
265 267 269 273 277 279 281
*
* *
ADL0194
204 206 208 215 221 223
LEI0062
81 87
* *
* *
MCW0240
172 174 180 182 186 189 191 194
LEI0085
259 263 265 275
AMBO, M.; CAMPOS, R.L.R.; MOURA, A.S.A.M.T.; BOSCHIERO, C.; ROSÁRIO, M.F.; LEDUR, M.C.; NONES, K.; COUTINHO, L.L. Genetic linkage maps of chicken chromosomes 6, 7, 8, 11 and 13 from a Brazilian resource population. Scientia Agricola,
v.65, p.447-452, 2008.
BOTSTEIN, D.; WHITE, R.L.; SKOLNICK, M.; DAVIS, R.W. Construction of a genetic-linkage map in man using restriction fragment length polymorphisms. American Journal of Human Genetics, v.32, p.314-331, 1980.
CROOIJMANS, R.P.M.A.; GROEN, A.F.; KAMPEN, A.J.A. van; BEEK, S. van der; POEL, J.J. van der; GROENEN, M.A.M. Microsatellite polymorphism in commercial broiler and layer lines using pooled blood samples. Poultry Science, v.75, p.904-909, 1996.
FIGUEIREDO, E.A.P.; ROSA, P.S.; SCHEUERMANN, G.N.; JAENISCH, F.R.F.; SCHMIDT, G.S.; LEDUR, M.; BRENTANO, L.; COSTA, C.A.F. Genetic gain in body weight feed conversion and carcass traits in White Plymouth Rock broiler strain Embrapa 021. In: WORLD CONFERENCE ON ANIMAL PRODUCTION, 9.; REUNIÃO DA ASSOCIACÃO LATINOAMERICANA DE PRODUÇÃO ANIMAL, 18., Porto Alegre, 2003. Proceedings. Porto Alegre: WAAP/ALPA, 2003a. CD-ROM.
FIGUEIREDO, E.A.P.; SCHMIDT, G.S.; LEDUR, M.C.; AVILA, V.S.; BRUM, P.A.R.; FIORENTIN, L.; JAENISCH, F.R.F. Genetic gain in egg production and egg weight in White Leghorn Embrapa 011. In: WORLD CONFERENCE ON ANIMAL PRODUCTION, 9.; REUNIÃO DA ASSOCIACÃO LATINOAMERICANA DE PRODUÇÃO ANIMAL, 18., Porto Alegre, 2003. Proceedings.
Porto Alegre: WAAP/ALPA, 2003b. CD-ROM.
FISHELSON, M.; GEIGER, D. Exact genetic linkage computations for general pedigrees. Bioinformatics, v.18, supplement 1, p.S189-S198, 2002.
GROENEN, M.A.M.; CHENG, H.H.; BUMSTEAD, N.; BENKEL, B.F.; BRILES, W.E.; BURKE, T.; BURT, D.W.; CRITTENDEN, L.B.; DODGSON, J.; HILLEL, J.; LAMONT, S.; DE LEON, A.P.; SOLLER, M.; TAKAHASHI, H.; VIGNAL, A. A consensus linkage map of the chicken genome. Genome Research, v.10, p.137-147, 2000.
GUO, S.W.; THOMPSON, E.A. Performing the exact test of Hardy-Weinberg proportion for multiple alleles. Biometrics, v.48, p.361-372, 1992.
HILLEL, J. Map-based quantitative trait locus identification.
Poultry Science, v.76, p.1115-1120, 1997.
HILLEL, J.; GROENEN, M.A.M.; TIXIER-BOICHARD, M.; KOROL, A.B.; DAVID, L.; KIRZHNER, V.M.; BURKE, T.; BARRE-DIRIE, A.; CROOIJMANS, R.P.M.A.; ELO, K.; FELDMAN, M.W.; FREIDLIN, P.J.; MÄKI-TANILA, A.; OORTWIJN, M.; THOMSON, P.; VIGNAL, A.; WIMMERS, K.; WEIGEND, S. Biodiversity of 52 chicken populations assessed by microsatellite typing of DNA pools. Genetics Selection Evolution, v.35, p.533-557, 2003.
KAISER, M.G.; YONASH, N.; CAHANER, A.; LAMONT, S.J. Microsatellite polymorphism between and within broiler populations. Poultry Science, v.79, p.626-628, 2000. KALINOWSKI, S.T.; TAPER, M.L.; MARSHALL, T.C. Revising
how the computer program CERVUS accommodates genotyping error increases success in paternity assignment. Molecular Ecology, v.16, p.1099-1106, 2007.
LEDUR, M.C.; BERTANI, G.R. Análise genômica na avicultura: resultados e perspectivas. In: SIMPÓSIO NACIONAL DE MELHORAMENTO ANIMAL, 4., Campo Grande, 2002.
Resumos. Campo Grande: SBMA, 2002. CD-ROM.
LYNCH, M.; WALSH, B. Genetics and analysis of quantitative
t
r
a
i
t
s
. Sunderland: Sinauer Associates, 1998. 980p.MARSHALL, T.C.; SLATE, J.; KRUUK, L.E.B.; PEMBERTON, J.M. Statistical confidence for likelihood-based paternity inference in natural populations. Molecular Ecology, v.7, p.639-655, 1998.
Ltraits.
NEI, M. Molecular evolutionary genetics. New York: Columbia University Press, 1987. 512p.
NONES, K.; LEDUR, M.C.; RUY, D.C.; BARON, E.E.; MELO, C.M.R.; MOURA, A.S.A.M.T.; ZANELLA, E.L.; BURT, D.W.; COUTINHO, L.L. Mapping QTLs on chicken chromosome 1 for performance and carcass traits in a broiler x layer cross.
Animal Genetics, v.37, p.95-100, 2006.
NONES, K.; LEDUR, M.C.; RUY, D.C.; BARON, E.E.; MOURA, A.S.A.M.T.; COUTINHO, L.L. Genetic linkage map of chicken chromosome 1 from a Brazilian resource population. Scientia Agricola, v.62, p.12-17, 2005.
RAYMOND, M.; ROUSSET, F. GENEPOP (version 1.2): population genetics software for exact tests and ecumenicism. Journal of Heredity, v.86, p.248-249, 1995.
ROMANOV, M.N.; WEIGEND, S. Analysis of genetic relationships between various populations of domestic and jungle fowl using microsatellite markers. Poultry Science, v.80, p.1057-1063, 2001.
ROSÁRIO, M.F.; LEDUR, M.C.; MOURA, A.S.A.M.T.; BARON, E.E.; NONES, K.; CAMPOS, R.L.R.; AMBO, M.; RUY, D.C.; COUTINHO, L.L.; GARCIA, A.A.F. Genetic diversity parameters in two experimental chicken populations designed for mapping quantitative trait loci. In: WORLD CONGRESS ON GENETICS APPLIED TO LIVESTOCK PRODUCTION, 8., Belo Horizonte, 2006. Proceedings. Belo Horizonte: WGALP/SBMA, 2006. CD-ROM.
RUY, D.C.; NONES, K.; BARON, E.E.; LEDUR, M.C.; MELO, C.M.R.; AMBO, M.; CAMPOS, R.L.R.; COUTINHO, L.L. Strategic marker selection to detect quantitative trait loci in chicken. Scientia Agricola, v.62, p.111-116, 2005. SCHMID, M.; NANDA, I.; HOEHN, H.; SCHARTL, M.; HAAF, T.;
BUERSTEDDE, J.M.; ARAKAWA, H.; CALDWELL, R.B.; WEIGEND, S.; BURT, D.W.; SMITH, J.; GRIFFIN, D.K.; MASABANDA, J.S.; GROENEN, M.A.M.; CROOIJMANS, R.P.M.A.; VIGNAL, A.; FILLON, V.; MORISSON, M.; PITEL, F.; VIGNOLES, M.; GARRIGUES, A.; GELLIN, J.; RODIONOV, A.V.; GALKINA, S.A.; LUKINA, N.A.; BEN-ARI, G.; BLUM, S.; HILLEL, J.; TWITO, T.; LAVI, U.; DAVID, L.; FELDMAN, M.W.; DELANY, M.E.; CONLEY, C.A.; FOWLER, V.M.; HEDGES, S.B.; GODBOUT, R.; KATYAL, S.; SMITH, C.; HUDSON, Q.; SINCLAIR, A.; MIZUNO, S. Second report on chicken genes and chromosomes 2005. Cytogenetic and Genome Research, v.109, p.415-479, 2005.
SLATE, J.; MARSHALL, T.C.; PEMBERTON, J.M. A retrospective assessment of the accuracy of the paternity inference program CERVUS. Molecular Ecology, v.9, p.801-808, 2000. VANHALA, T.; TUISKULA-HAAVISTO, M.; ELO, K.; VILKKI,
J.; MÄKI-TANILA, A. Evaluation of genetic variability and genetic distances between eight chicken lines using microsatellite markers. Poultry Science, v.77, p.783-790, 1998.
ZANELLA, E.L.; LEDUR, M.C.; SCHMIDT, G.S.; JAENISCH, F.R.F.; COUTINHO, L.L. Development of a new reference population for QTL detection in poultry. In: ANNUAL MEETING OF THE POULTRY SCIENCE ASSOCIATION, 89., Montreal, 2000. Abstracts. Savoy: PSA, 2000. p.61. ZHU, J.J.; LILLEHOJ, H.S.; CHENG, H.H.; POLLOCK, D.;
SADJADI, M.; EMARA, M.G. Screening for highly heterozygous chickens in outbred commercial broiler lines to increase detection power for mapping quantitative trait loci. Poultry Science,
v.80, p.6-12, 2001.
Received March 18, 2008 Accepted August 26, 2008 AMBO, M.; CAMPOS, R.L.R.; MOURA, A.S.A.M.T.; BOSCHIERO,
C.; ROSÁRIO, M.F.; LEDUR, M.C.; NONES, K.; COUTINHO, L.L. Genetic linkage maps of chicken chromosomes 6, 7, 8, 11 and 13 from a Brazilian resource population. Scientia Agricola,