RESEARCH ARTICLE
Thixotropy and Rheopexy of Muscle Fibers
Probed Using Sinusoidal Oscillations
David Altman1*, Fabio C. Minozzo2, Dilson E. Rassier3
1Department of Physics, Willamette University, Salem, Oregon, United States of America,2Department of Kinesiology and Physical Education, McGill University, Montreal, Quebec, Canada,3Departments of Kinesiology and Physical Education, Physiology, and Physics, McGill University, Montreal, Quebec, Canada
Abstract
Length changes of muscle fibers have previously been shown to result in a temporary re-duction in fiber stiffness that is referred to as thixotropy. Understanding the mechanism of this thixotropy is important to our understanding of muscle function since there are many in-stances in which muscle is subjected to repeated patterns of lengthening and shortening. By applying sinusoidal length changes to one end of single permeabilized muscle fibers and measuring the force response at the opposite end, we studied the history-dependent stiffness of both relaxed and activated muscle fibers. For length change oscillations greater than 1 Hz, we observed thixotropic behavior of activated fibers. Treatment of these fibers with EDTA and blebbistatin, which inhibits myosin-actin interactions, quashed this effect, suggesting that the mechanism of muscle fiber thixotropy is cross-bridge dependent. We modeled a half-sarcomere experiencing sinusoidal length changes, and our simulations suggest that thixotropy could arise from force-dependent cross-bridge kinetics. Surprisingly, we also observed that, for length change oscillations less than 1 Hz, the muscle fiber exhib-ited rheopexy. In other words, the stiffness of the fiber increased in response to the length changes. Blebbistatin and EDTA did not disrupt the rheopectic behavior, suggesting that a non-cross-bridge mechanism contributes to this phenomenon.
Introduction
Certain non-Newtonian fluids exhibit a time-dependent change in viscosity when they experi-ence shear stress. When the viscosity of the fluid is reduced by shear stress, the material is said to exhibit thixotropy, and when shear stress increases the fluid’s viscosity, it is said to exhibit rheopexy [1]. Both phenomena typically result from reversible changes in microstructure. For example, for a thixotropic substance, weak interactions between polymers that make up the fluid are broken by agitation of the system, and these interactions re-form when
agitation stops.
Buchtal and Kaiser [2] first used the term thixotropy to describe their observations that stretching an amphibian skeletal muscle fiber results in reduced fiber stiffness, and that the stiffness returns to its unperturbed value after a sufficient resting period. They described
OPEN ACCESS
Citation:Altman D, Minozzo FC, Rassier DE (2015) Thixotropy and Rheopexy of Muscle Fibers Probed Using Sinusoidal Oscillations. PLoS ONE 10(4): e0121726. doi:10.1371/journal.pone.0121726
Academic Editor:Miklos S. Kellermayer, Semmelweis University, HUNGARY
Received:August 19, 2014
Accepted:February 15, 2015
Published:April 16, 2015
Copyright:© 2015 Altman et al. This is an open access article distributed under the terms of the Creative Commons Attribution License, which permits unrestricted use, distribution, and reproduction in any medium, provided the original author and source are credited.
Data Availability Statement:All ASI 600A data files are available from the Dryad database that can be found at: doi:10.5061/dryad.jf35g.
muscle thixotropy as resulting from disruption and re-formation of“entanglements”within the fibers.
Though the reason that muscle stiffness exhibits a history-dependence is not fully under-stood, it has been suggested that muscle thixotropy has important functional implications, in-cluding postural stability. According to this hypothesis, muscle’s increased stiffness in relaxed muscles helps maintain stability against unexpected external forces. When the muscle is acti-vated and this stability is no longer required, the stiffness is reduced through thixotropic effects [3]. An understanding of muscle thixotropy is also important to our understanding of muscle function since there are many instances in which muscle is subjected to repeated patterns of lengthening and shortening. For example, muscles in the limbs undergo cyclic length changes during locomotion, and the muscle walls of a beating heart continually stretch and shorten [4].
In this report, we describe studies in which the mechanical properties of individual permea-bilized muscle fibers were probed by applying sinusoidal length changes at one end of the fiber and measuring the resulting force at the other end. At frequencies above 1 Hz, this oscillation resulted in a history-dependent reduction in muscle fiber stiffness in activated muscle fibers. Inhibiting acto-myosin interactions caused this thixotropic effect to disappear, suggesting that the“entanglements”corresponding to this thixotropic effect are due to cross-bridge interac-tions. Surprisingly, at frequencies less than 1 Hz, oscillation resulted in a history-dependent in-creasein muscle fiber stiffness in activated fibers. Disruption of acto-myosin interactions has no effect on this rheopectic behavior, suggesting that there is a different mechanism of entan-glement at play.
Materials and Methods
Solutions
Rigor solution (pH 7.0) was composed of (in mM) 50 Tris, 100 NaCl, 2 KCl, 2 MgCl2, and 10
EGTA. Dissection solution used for muscle storage and dissection (pH 7.0) was composed of (in mM) 20 imidazole, 100 KCl, 2 EGTA, 4 ATP and 7 MgCl2. Experimental solutions with pCa2+
of 4.5 (activating solution) and 9.0 (relaxing solution) (pH 7.0) were composed of (in mM) 20 im-idazole, 14.5 creatine phosphate, 7 EGTA, 4 MgATP, 1 free Mg2+, free Ca2+of 1 nM (relaxing) or 32μM (activating), and KCl to adjust the ionic strength to 180. A pre-activation solution (pH 7.0,
pCa2+9.0) was used prior to activating fibers, containing (in mM) 68 KCl, 0.5 EGTA, 20 imidaz-ole, 14.5 PCr, 4.83 ATP, 0.00137 CaCl2, 5.41 MgCl2and 6.5 HDTA.
Solutions containing blebbistatin were prepared according to procedures previously used in our laboratory [5]. Blebbistatin (Sigma, USA) was dissolved in dimethylformamide (DMF) to reach a concentration of 20 mM and was stored at−20°C before use. On the day of the
experi-ment, 1μL of the blebbistatin stock was diluted in 4 mL of activating (pCa2+4.5) or relaxing
(pCa2+9.0) solutions to reach a final concentration of 5μM. Care was taken to limit
blebbista-tin exposure to light, as it loses its effectiveness in wavelengths between 365 nm and 490 nm [6]. A red filter (650 nm) placed on the light source of the microscope was used to avoid expo-sure when the use of light was necessary during the experiments.
Muscle fiber preparation
Small muscle bundles of the rabbit psoas were dissected, tied to wood sticks, and chemically permeabilized using rigor:glycerol (50:50) solutions following standard procedures [5,7]. Fi-bers were stored at−20°C in rigor:glycerol solution.
On the day of the experiment, a muscle sample was transferred to a fresh rigor solution and stored in the fridge for one hour before use. A small section of the sample was extracted (~4 mm in length), and single fibers were dissected in dissection solution. The fibers were fixed at
their ends with T-shaped clips made of aluminum foil, and were transferred to a temperature controlled experimental chamber to be attached between a force transducer (Model 400A, Au-rora Scientific, Toronto, Canada) and a length controller (Model 312B, AuAu-rora Scientific, To-ronto, Canada). The protocol was approved by the McGill University Animal Care Committee and complied with the guidelines of the Canadian Council on Animal Care.
Experimental protocol
After the fibers were set in the experimental chamber, which was kept at 5°C throughout the experiment, the average sarcomere length (SL) was calculated in relaxing solution using a high-speed video system (HVSL, Aurora Scientific 901A, Toronto, Canada) attached to a micro-scope. Images from a selected region of the fibers were collected at 1000–1500 frames/s, and the SL was calculated by fast Fourier transform (FFT) analysis based on the striation spacing produced by dark and light bands of myosin and actin, respectively. The length of the fiber was adjusted until the SL was 2.5μm, which is along the plateau of the force-length relation for
these fibers [8].
The fiber diameter and length were then measured using a CCD camera (Go-3, QImaging, USA; pixel size: 3.2μm × 3.2μm), and the cross-sectional area was estimated assuming
circular symmetry.
We measured the response of muscle fibers to sinusoidal vibrations directed along the length of the fiber. Using the length controller, driving sinusoidal oscillations were applied for 20 seconds to the muscle fiber at frequencies ranging from 0.25 Hz to 30 Hz, and the force transducer was used to measure the resulting force at the opposite end of the fiber. The fiber was studied both in pCa2+9.0 (relaxed) and pCa2+4.5 (activated). For relaxed fibers, the mag-nitude of the oscillation was 2–3% of the fiber length, and for activated fibers, the magnitude of the oscillation was 1–1.5% of the fiber length. Throughout an experiment, we verified that fi-bers were not damaged by examining the fiber for consistency of the sarcomere pattern using the high-speed video system.
Treatment of the fiber with EDTA and blebbistatin
Additional experiments were conducted following treatment of the fibers with EDTA (5 mM) and blebbistatin (5μM). EDTA causes TnC extraction from myofibrils [9], and blebbistatin
causes disruption of the cross-bridge cycle by binding to a site of the myosin S1 located be-tween the nucleotide pocket and the cleft of the actin-binding site; this biases myosin into a pre-powerstroke conformation without directly affecting ATPase kinetics [10–12]. Together, both chemicals inhibit cross-bridge formations.
To conduct these experiments, oscillation data were first collected for the relaxed fiber prior to treatment with EDTA and blebbistatin. The fiber was then activated, and oscillation data were again collected. The fiber was then placed in rigor solution containing EDTA, the temper-ature was raised to 8°C, and the fiber was incubated for one hour. The tempertemper-ature was then re-turned to 5°C, and the fiber was incubated in relaxing solution containing blebbistatin for 30 minutes. Oscillation data were collected in relaxing solution containing blebbistatin, the fiber was placed in activating solution containing blebbistatin, and oscillation data were
collected again.
Mechanical properties of muscle fibers
When modeling a muscle fiber as a linear viscoelastic element, we approximated the final five oscillations of a 20-second force time-trace (by which time the oscillation had reached
equilibrium) using the relation
F¼FoþF1sinð2pftþd1Þ ð1Þ
whereFois the mean force,fis the frequency of the driving oscillation, andF1andδ1are the
amplitude and phase of thefirst harmonic, as determined by Fourier analysis. The length time trace was described by a similar relation. The phase of the length time trace was set to zero, and thusδ
1describes the phase difference between the length and force time traces.
We described the viscoelastic properties of the fiber using the framework described by Kawai et al. [13]. The complex modulus describes both the viscous and elastic properties of a material, and is described by the ratio of the tension change (force divided by the cross-section-al area) and the fractioncross-section-al length change (change in length divided by the fiber length). The magnitude of the complex modulus was calculated at each frequency according to the relation
jYðfÞj ¼F1ðfÞ
L1ðfÞ Lo
Ao
ð2Þ
whereLois the length of the musclefiber andAois its cross-sectional area. Cylindrical shape
was assumed in order to calculate the area.
From the magnitude of the complex modulus and the phase, we calculated the elastic modu-lus (G) and viscous modulus (R) through the relations
GðfÞ ¼ jYðfÞjcosd
1
RðfÞ ¼ jYðfÞjsind1 ð3Þ
Results
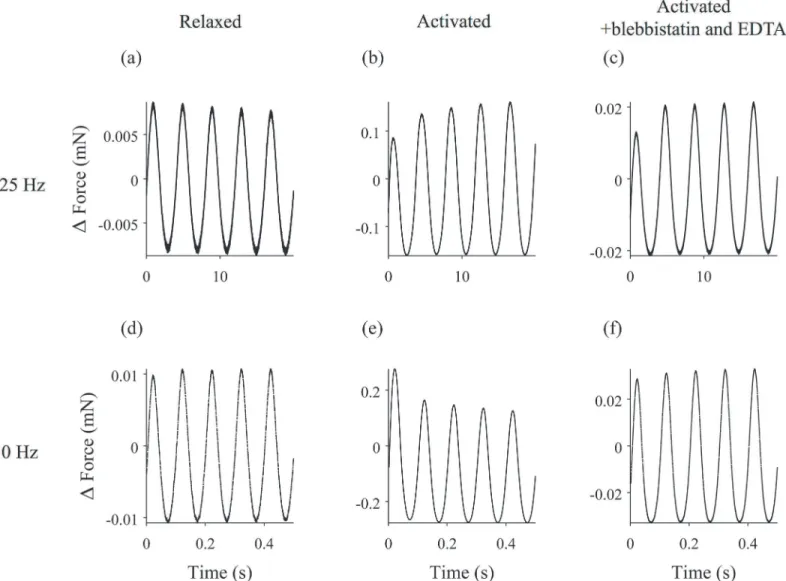
Individual muscle fibers were subjected to sinusoidal length changes at one end at frequencies ranging from 0.25 to 30 Hz, and the resulting force response was measured at the other end of the fiber. Examples of length and force time traces at different experimental conditions are shown inFig 1.
Such data can also be represented as Lissajous figures in which the force response is plotted as a function of length (S1,S2, andS3Figs). To highlight changes in the force response over time, these figures show both the initial driven oscillation (red) and the final driven oscillation (black) after twenty seconds of oscillation.
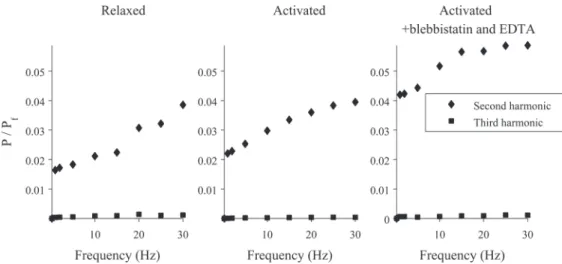
If the muscle fiber were a linear viscoelastic material, the Lissajous figures would be ellipses. As can be seen, the plots are not ellipses, indicating a nonlinearity that becomes more pro-nounced at higher frequencies of oscillation. To characterize this, a Fourier transform was ap-plied to the force time-traces, and the powers of the signal at the fundamental frequency (which is the same as the frequency of the length changes) and the next two harmonics were calculated. An example of this analysis is shown inFig 2, where we have plotted the ratios of the power at the second or third harmonic (P) and the power at the fundamental frequency (Pf) for various experimental conditions. As can be seen, the non-linearity in the signal
primar-ily arises from the second harmonic, and this component becomes larger as the driving frequency increases.
activated fibers (Fig 2, middle and right). For example, for an activated fiber driven at 15 Hz, the power of the signal at the second harmonic is ~3% of the power at the fundamental.
Analysis of relaxed fibers
The force response of relaxed fibers does not appear to change significantly over time (Fig 1). To quantify this behavior, we calculated the root-mean-squared (RMS) amplitude of both the first force oscillation and the final force oscillation after twenty seconds. The ratio of these two values is plotted as a function of driving frequency inFig 3. While these data suggest that there may be a slight decrease in the stiffness of the fiber over time, the ratio is statistically indistin-guishable from 1 at most driving frequencies, indicating that the amplitude is similar at the be-ginning and end of the driving oscillation.
Fig 1. Length change and force response of a muscle fiber experiencing driving sinusoidal oscillations.Length changes are shown in black, and the force response is in red. The mean force and length have been subtracted from the traces. 0.25 Hz oscillations of (a) the relaxed fiber, (b) the activated fiber, and (c) the activated fiber following treatment with EDTA and blebbistatin. 10 Hz oscillation of (d) the relaxed fiber, (e) the activated fiber, and (f) the activated fiber following treatment with EDTA and blebbistatin. The length of the fiber was 2.6 mm.
doi:10.1371/journal.pone.0121726.g001
For frequencies of 15 Hz or less, the mechanical properties of the fiber were calculated as-suming the fiber is a linear viscoelastic material. The magnitude of the complex modulus and the viscous and elastic moduli of the fiber were calculated at each frequency as described in the Materials and Methods (Fig 4).
Analysis of activated fibers
Upon activation, muscle fibers became stiffer, as evidenced by a considerably larger force re-sponse despite a smaller amplitude length change. At nearly all oscillation frequencies, the force response changed during the 20-second oscillation (Fig 1). For a driving frequency of 0.25 Hz, the fiber became stiffer over time, resulting in an increase in the amplitude of the force response (Fig 1B). At 10 Hz, the opposite was true; over time, the amplitude of the force re-sponse decreased, indicating that the fiber was becoming softer (Fig 1E).
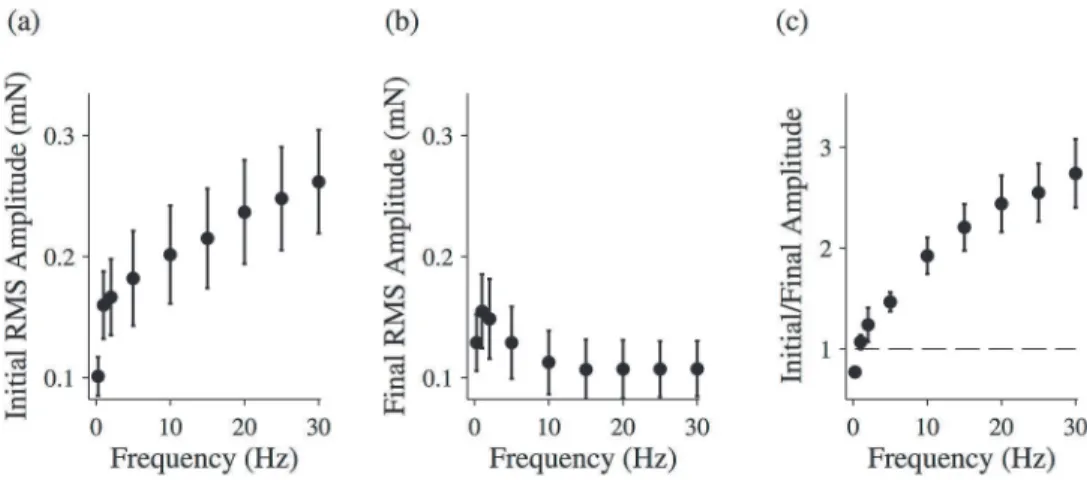
To quantify this effect, we again calculated the RMS amplitude of each force time trace’s first oscillation (Fig 5A) and last oscillation (Fig 5B), and we calculated the ratio of these ampli-tudes (Fig 5C). Below 1 Hz, this ratio is less than 1, indicating the fiber is growing stiffer over time. Above 1 Hz, the ratio is greater than 1, indicating that the fiber is softening. Furthermore, the ratio gets larger as the driving frequency is increased.
It is worth noting that, for frequencies of 10 Hz or greater, the final RMS amplitude is the same for all frequencies (Fig 5B). In other words, the increase seen in the ratio plotted inFig 5C results not from an increased softening of the fiber with frequency, but rather results from an increased initial stiffness at higher frequencies.
For driving oscillations of 15 Hz or less, the last five oscillations of the force response were used to calculate the magnitude of the complex modulus and the viscous and elastic moduli of the fiber (Fig 6). Although there was a large variability in the magnitude of these values, the fi-bers exhibited the same general pattern. The response of the fiber was maximal at 1 Hz, where the elastic modulus of the fiber peaked, while the viscous modulus decreased with increasing frequency.
Fig 2. Frequency components of the force signal for a muscle fiber experiencing sinusoidal
oscillations.A Fourier transform was applied to the force measurement time-courses, and the powers of the signal at the fundamental frequency (which is the same as the driving frequency) and the next two harmonics were calculated. Plotted are the ratios of the power at the second or third harmonic (P) and the power at the fundamental frequency (Pf) for three different experimental conditions.
Analysis of activated fibers treated with EDTA and blebbistatin
The experiments described above were repeated following treatment of the muscle fiber with EDTA and blebbistatin to disrupt acto-myosin interactions. As with untreated relaxed fibers, the amplitude of the force response remained fairly constant during the duration of the driving oscillation (S4 Fig), although the viscoelastic properties were somewhat changed (S5 Fig).
Activated fibers, on the other hand, changed behavior dramatically following treatment. At all frequencies, the magnitude of the measured force time trace was decreased, indicating a re-duction in the stiffness of the fiber. Rheopexy was still observed for low frequency driving oscil-lations (Fig 1C), but the thixotropy at higher driving frequencies disappeared (Fig 1F). Again, we calculated the RMS amplitude of each force time trace for the initial oscillation (Fig 7A) and the final oscillation (Fig 7B) and calculated the ratio of the two (Fig 7C). The ratio is less than one for low frequencies, while at higher frequencies the ratio is ~1.
For driving oscillations of 15 Hz or less, the last five oscillations of the force response were used to calculate the magnitude of the complex modulus and the viscous and elastic moduli of the fiber (Fig 8).
Fig 3. Changing force response for relaxed muscle fibers.The ratio of the initial and final RMS amplitudes for relaxed muscle fibers. The total length of the oscillation was 20 seconds. All data points are (MEAN±SEM), and the number of fibers analyzed was N = 6. A one-sample t-test was used to test the null hypothesis that data collected at each frequency comes from a normal distribution with mean equal to 1. For data points marked with an asterisk, the null hypothesis was rejected (p<0.05).
doi:10.1371/journal.pone.0121726.g003
Fig 4. Mechanical properties of relaxed muscle fibers.Magnitude of the complex modulus, phase, elastic modulus, and viscous modulus for relaxed muscle fibers during the final five oscillations of the driven oscillation. All data points are (MEAN±SEM), and the number of fibers analyzed was N = 6.
doi:10.1371/journal.pone.0121726.g004
Fig 5. Changing force response for activated muscle fibers.The root-mean-squared (RMS) amplitude for the initial driving oscillation (a) and the final driving oscillation (b) for activated muscle fibers. (c) The ratio of the initial and final RMS amplitudes for activated muscle fibers. The total length of the oscillation was 20 seconds. All data points are (MEAN±SEM), and the number of fibers analyzed was N = 8.
Fig 6. Mechanical properties of activated muscle fibers.Magnitude of the complex modulus, phase, elastic modulus, and viscous modulus for activated muscle fibers during the final five oscillations of the driven oscillation. All data points are (MEAN±SEM), and the number of fibers analyzed was N = 8.
doi:10.1371/journal.pone.0121726.g006
Fig 7. Changing force response for activated muscle fibers following treatment.The root-mean-squared (RMS) amplitude for the initial driving oscillation (a) and the final driving oscillation (b) for activated muscle fibers following treatment with EDTA and blebbistatin. (c) The ratio of the initial and final RMS amplitudes for activated muscle fibers following treatment with EDTA and blebbistatin. The total length of the oscillation was 20 seconds. All data points are (MEAN±SEM), and the number of fibers analyzed was N = 2.
doi:10.1371/journal.pone.0121726.g007
Discussion
Muscle thixotropy refers to the apparent temporary reduction in muscle stiffness following movement. Intact fiber measurements of relaxed muscle fibers indicate that thixotropy in mus-cle arises from a history dependent, short-range elastic component (SREC) [14–16], although the nature of the SREC is still debated. One model posits that muscle thixotropy results from a temporary reduction in the number of attached cross-bridges following movement [15,17,18]. However, it has also been suggested that this history dependent behavior could result from titin filaments, whose mechanical properties change in response to force [19–22]. Arguments for and against each of these hypotheses have been discussed in the literature [23,24].
To help differentiate between these models, we treated muscle fibers with EDTA and bleb-bistatin to specifically disrupt acto-myosin interactions. Although there is no evidence that blebbistatin treatment directly affects titin properties, it is possible that thin filament extraction may affect the overall sarcomere stiffness as titin binds to actin. However, we believe that such mechanism was not present in our study for two reasons. First, the passive forces produced at low Ca2+concentration were similar before and after extraction of thin filaments. Second, it has been shown that the potential effects of Ca2+on titin stiffness are independent of titin-actin interactions, and are associated only with stiffening of titin molecules [25,26].
Fig 8. Mechanical properties of activated muscle fibers following treatment.Magnitude of the complex modulus, phase, elastic modulus, and viscous modulus for activated muscle fibers during the final five oscillations following treatment with EDTA and blebbistatin. All data points are (MEAN±SEM), and the
number of fibers analyzed was N = 2.
Thixotropy
We studied the history-dependent stiffness of muscle fibers by measuring the force response of muscle fibers experiencing sinusoidal length changes. For driving frequencies greater than ~1 Hz, activated fibers exhibited thixotropy. There are similarities between experiments per-formed on permeabilized fibers at pCa2+9.0, presented in this paper and by other authors [4, 27], and experiments performed on relaxed intact fibers [15,28,29]. Hill showed that the re-sponse of resting intact skeletal muscles to ramp stretches is biphasic [15]. The force rises rap-idly during the initial phase of the stretch, corresponding to the SREC described above. The SREC exhibits thixotropy qualitatively similar to what was observed in our study, suggesting that thixotropy is a general phenomenon encountered both in intact and permeabilized mus-cles fibers at different levels of activation.
Disruption of acto-myosin interactions resulted in quashed thixotropy of activated fibers, suggesting that this thixotropy arises primarily from a cross-bridge mechanism. We hypothe-sized that the cross-bridge dependent thixotropy at higher frequencies results from force-de-pendent cross-bridge kinetics. Specifically, we postulated that forces within a cross-bridge perturb mechanical transitions within the actomyosin chemomechanical cycle. This, in turn, affects the mechanical properties of the fiber by altering both the number and state of bound cross-bridges within a sarcomere. To test this model, we simulated the force response of a half-sarcomere experiencing a sinusoidal length oscillation.
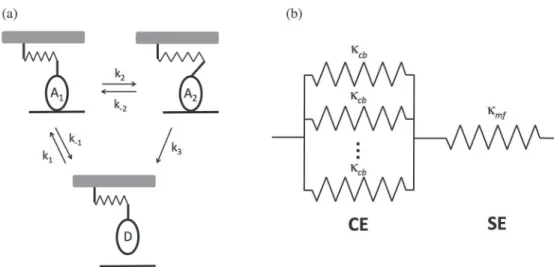
Simulating the cross-bridge dependent thixotropy. A model of a half-sarcomere was de-veloped that is based on the framework of Campbell and Moss [4,27]. According to this model, a single myosin cycles through three-states: D (detached), A1(first attached), and A2
(second attached) (Fig 9A). The transition between A1and A2corresponds to the powerstroke,
and results in an increase in the length of the cross-bridge attachment ofxps. The cross-bridge
is modeled as a linear elastic element with stiffnessκcb.
In our model, the four rate constantsk-1,k2,k-2, andk3depend on the force exerted on the
cross bridge. We posit that the transition associated with a force-dependent rate constant in-volves a mechanical step, and that the force on the cross bridge perturbs this mechanical
Fig 9. Model of the half-sarcomere.(a) Individual cross-bridges are linearly elastic elements that pass through three states: two attached states (A1and A2) and a detached state (D). The transition from A2to D is irreversible, and the transition from A1to A2corresponds to the powerstroke. (b) Model of the half-sarcomere. The half-sarcomere was modeled as a cross-bridge element (CE), consisting of cross-bridges attached in parallel, which is in series with the series element (SE), which represents the myofilament compliance.
doi:10.1371/journal.pone.0121726.g009
transition according to the relation described in [30]
ki¼k o iexp
Fcbdi
kBT
ð4Þ
whereko
i is the value of the rate in the absence of any force on the cross-bridge,Fcbis the force
on the cross-bridge,δiis the distance to the transition state of the mechanical transition, and
kBTis the Boltzmann constant times the temperature.
The force results from stretching of the elastic cross-bridge away from its equilibrium posi-tion. Thus, the force exerted by a cross-bridge along the direction of extension is given by
Fcb¼ kcblcb ð5Þ
wherelcbis the length by which the cross-bridge has been extended (or for negative values,
compressed). When the motorfirst binds to thefilament, it is assumed thatlcb= 0. When the
motor transitions from A1to A2, a powerstroke occurs, which causeslcbto increase byxps.
Sim-ilarly,lcbdecreases byxpsduring the transition from A2to A1. δ
2andδ3are assumed to be positive, indicating that a positive extension of the cross-bridge
increases the associated rates, whileδ
−2andδ−1are negative, indicating that these rates are
slo-wed by a positive extension. Furthermore, since the transition between A1and A2corresponds
to the powerstroke, the sum ofδ
−2andδ2is assumed to be equal toxps.
We used this kinetic scheme to model the force-response of a half-sarcomere experiencing a length oscillation. We modeled the half-sarcomere as containing 294 cross-bridges [31], and we assumed that all the cross-bridges that are attached behave as linear elastic elements in par-allel (Fig 9B). The resulting elastic element is referred to as the cross-bridge element (CE). In series with the CE is a linear elastic element (referred to as the series element (SE)) with stiff-nessκmf, which corresponds to the compliance of the myofilament in the absence of
cross-bridge attachments.
To model this system, we performed the following Monte Carlo simulation:
Initial conditions—Step 1. The initial state of the system is set with an equal number of motors in each of the three states A1, A2, and D. The displacement of each of the attached
cross-bridges is set to zero, and so according to Equation (5) all cross-bridges experience no net force. The displacement of the series elastic element is also set to zero, and so this element also experiences no net force.
Equilibration—Step 2. For a single cross-bridge in the half-sarcomere, the rate constants are determined from Equations (4) and (5). The state of the cross-bridge after a small interval of time (set toΔt= 10−4s) is then determined as follows. If the initial state of the cross-bridge is
state D, then it has two possible actions: it can move to state A1or it can stay in state D. The
probabilities for these events are given by
pD!A1 ¼k1Dt ð6Þ
pD!D¼1 pD!A1 ð7Þ
A1. The probabilities for each of these are given by
pA1!A2¼k2Dt ð8Þ
pA1!D¼k 1Dt ð9Þ
pA1!A1¼
1 p
A1!A2 pA1!D ð10Þ
Finally, if the cross-bridge starts in state A2, it can either move to state A1or D, or it can stay
in state A2. The probabilities for each of these are given by
pA2!D¼k3Dt ð11Þ
pA2!A1 ¼k 2Dt ð12Þ
pA2!A2¼
1 p
A2!D pA2!A1 ð13Þ
Using a random number generator and the relevant probabilities calculated above, the state of the motor after an interval of timeΔtis determined. If during this interval of time, the cross-bridge transitions between states A1and A2, the value of the displacementlcbis changed by
±xps, depending on the direction of the transition.
Step 3. Step 2 is repeated for each cross-bridge in the half-sarcomere.
Step 4. The force exerted by each cross-bridge is re-calculated using Equation (5), and the forces from each cross-bridge are summed to yield the net-force exerted by the CE. At this point, the CE and SE are no longer in equilibrium (the forces they exert on each other are no longer equal), and so the point of contact between them is allowed to move to return the system to equilibrium. Specifically, this point moves by a distance
Dx¼ ðFCEf F i
CEÞ=kmf ð14Þ
whereFi CEandF
f
CEare the forces exerted on the CE before and after step (3), respectively.
Be-cause moving this point changes the displacement of each cross-bridge,Δxis added tolcbfor
each cross-bridge.
Step 5. Steps 2–4 are repeated until the sarcomere has evolved for 1 second. At this point, the system has reached equilibrium (data not shown).
Length oscillation—Step 6. The length change is a sinusoidal function given by the func-tion
E¼Asinð2pftÞ ð15Þ
whereAis the amplitude of the oscillation andfis its frequency. The change in lengthΔEis cal-culated for the next interval of timeΔt.ΔEchanges the displacement from equilibrium for both the CE and SE. Specifically, the CE is extended by
Dxoscillation¼DE
k
mf
k
mf þNattachedkcb
ð16Þ
whereNattachedis the total number of cross-bridges in states A1or A2.Δxoscillationis added to the
displacementlcbfor each cross-bridge.
Step 7. Steps 2–4 are repeated to determine the next state of each cross-bridge after anoth-er intanoth-erval of timeΔt.
Step 8. Steps 6 and 7 are repeated until the sarcomere has evolved for 2 seconds in the presence of the oscillation.
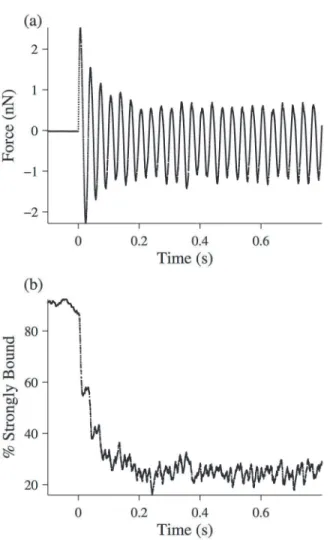
The simulation described above was run with the parameters inTable 1. The force response of the fibers was sinusoidal, and consistent with our hypothesis, the half-sarcomere exhibited thixotropy for frequencies of 5 Hz and higher (Fig 10A). Plotting the percent of strongly-bound cross-bridges as a function of time during the oscillation (Fig 10B) shows that this change in the mechanical properties of the fiber results from a change in the number of bound cross-bridges within a sarcomere
In addition, we calculated the RMS amplitude of the first oscillation (Fig 11A) and last oscil-lation (Fig 11B) for each simulated force trace, and plotted the ratio of these amplitudes as a function of frequency (Fig 11C). Consistent with our data, the magnitude of the thixotropic ef-fect was greater at higher frequencies. Also consistent with our data, the thixotropic efef-fect arises primarily because of an increase in the initial RMS amplitude, with the final RMS amplitude re-maining fairly constant as the frequency is varied.
The simulations were run with the temperature in Equation (4) set to 293 K (20°C). The simulation was also repeated at the temperature of the experiment (278 K) and atin vivo tem-peratures (310 K). Results were nearly indistinguishable (S6 Fig), suggesting that this thixotro-pic mechanism can account for thixotropy across a range of temperatures.
Rheopexy
At frequencies less than 1 Hz, we observed a novel rheopectic behavior of activated muscle fi-bers. This rheopexy was still pronounced following treatment with blebbistatin and EDTA, suggesting an as of yet unknown mechanism that is not cross-bridge dependent.
It is worth noting that before treatment with blebbistatin and EDTA, rheopectic behavior was only seen at oscillation frequencies less than 1 Hz, but following treatment, it was observed at frequencies less than 20 Hz. A likely explanation is that, in the range between 1 Hz and 20 Hz, there are both rheopectic and thixotropic mechanisms at play. However, thixotropy is more pronounced and thus dominates the observed changes in stiffness of the fiber in this fre-quency range. When we quash the thixotropic effect with EDTA and blebbistatin, the rheopexy then becomes apparent at higher frequencies.
In summary, our results suggest that myosin cross-bridges are responsible for the thixotro-pic behavior of muscle fibers. Rheopectic behavior at lower frequencies, on the other hand, is caused by a cross-bridge independent mechanism.
Table 1. Parameter values for the model of a half-sarcomere.
ko
3 4 s
−1 k1 10 s−1
δ3 1×10⁻⁹m ko
1 0.6 s
−1
A 1.3×10⁻⁷m δ
−1 −1×10⁻⁹m
κcb 1×10⁻⁴N/m ko
2 1 s
−1
κmf 0.5 N/m δ2 4×10⁻⁹m
xps 5×10⁻⁹m ko2 1 s
−1
T 293 K δ−2 −1×10⁻⁹m
Parameters used for the simulation of a half-sarcomere experiencing driving sinusoidal oscillations. The model is described in detail in the text.
Fig 10. Simulation of a half-sarcomere experiencing a 30 Hz length oscillation.The simulation is described in detail in the text, and the parameters used are found inTable 1. (a) Force-response time-trace of the half-sarcomere. (b) Percent of strongly bound cross-bridges (i.e. in one of the attached states) as a function of time.
doi:10.1371/journal.pone.0121726.g010
Supporting Information
S1 Fig. Lissajous figures for a relaxed muscle fiber experiencing driving sinusoidal oscilla-tions.The frequency of oscillation in Hz is indicated in the top left corner of the plot. The red line is the first oscillation and the black line is the final oscillation after 20 seconds. The x-axis and y-axis are is 0.1 mm and 0.03 mN in length, respectively. The length of the muscle fiber was 2.6 mm.
(TIFF)
S2 Fig. Lissajous figures for an activated muscle fiber experiencing driving sinusoidal oscil-lations.The frequency of oscillation in Hz is indicated in the top left corner of the plot. The red line is the first oscillation and the black line is the final oscillation after 20 seconds. The x-axis and y-x-axis are is 0.05 mm and 0.8 mN in length, respectively. The length of the muscle fiber was 2.6 mm.
(TIFF)
S3 Fig. Lissajous figures for an activated muscle fiber experiencing driving sinusoidal oscil-lations following treatment with EDTA and blebbistatin.The fiber is experiencing driving sinusoidal oscillations, and the frequency of oscillation in Hz is indicated in the top left corner of the plot. The red line is the first oscillation and the black line is the final oscillation after 20 seconds. The x-axis and y-axis are is 0.05 mm and 0.11 mN in length, respectively.
(TIFF)
S4 Fig. Changing force response for relaxed muscle fibers following treatment.The ratio of the initial and final RMS amplitudes for relaxed muscle fibers following treatment with EDTA and blebbistatin. The total length of the oscillation was 20 seconds. All data points are (MEAN ±SEM), and the number of fibers analyzed was N = 2. A one-sample t-test was used to test the null hypothesis that data collected at each frequency comes from a normal distribution with mean equal to 1. The null hypothesis could not be rejected for all data points (p>0.05). (TIFF)
S5 Fig. Mechanical properties of relaxed muscle fibers following treatment.Magnitude of the complex modulus, phase, elastic modulus, and viscous modulus for relaxed muscle fibers during the final five oscillations following treatment with EDTA and blebbistatin. All data Fig 11. Changing force response for a simulated half-sarcomere.The root-mean-squared (RMS) amplitude for the initial driving oscillation (a) and the final driving oscillation (b) for a simulated half-sarcomere. (c) The ratio of the initial and final RMS amplitudes for a simulated half-half-sarcomere. The total length of the oscillation was 2 seconds.
points are (MEAN±SEM), and the number of fibers analyzed was N = 2. (TIFF)
S6 Fig. Simulated force-response of a half-sarcomere to a 30 Hz length oscillation.The sim-ulation is described in detail in the text, and the parameters used are found inTable 1. The sim-ulation was run with the temperature in Equation (4) set to 310 K (blue), 293 K (red), and 278 K (black).
(TIFF)
Acknowledgments
The authors would like to thank Anabelle Silva Cornachione and Mahroo Mofarrahi for help with experiments.
Author Contributions
Conceived and designed the experiments: DA FM DR. Performed the experiments: DA FM. Analyzed the data: DA FM DR. Contributed reagents/materials/analysis tools: DA DR. Wrote the paper: DA FM DR.
References
1. Alger MSM (1997) Polymer Science Dictionary, 2nd edn. London: Chapman & Hall.
2. Buchtal F, Kaiser E. The rheology of the cross-striated muscle fibre with special reference to isotonic conditions. Det Kongelige Danske Viderskabernes Selskab Biologiske Meddelser, Copenhagen 1951; 21: 1–307.
3. Lakie M, Walsh EG, Wright GW. Resonance at the wrist demonstrated by the use of a torque motor: an instrumental analysis of muscle tone in man. J Physiol 1984; 353: 265–85. PMID:6481624
4. Campbell KS, Moss RL. A thixotropic effect in contracting rabbit psoas muscle: prior movement re-duces the initial tension response to stretch. J Physiol 2000; 252(2): 531–8.
5. Minozzo FC, Rassier DE. Effects of blebbistatin and Ca2+ concentration on force produced during stretch of skeletal muscle fibers. Am J Physiol Cell Physiol 2010; 229: C1127–C1135.
6. Kolega J. Phototoxicity and photoinactivation of blebbistatin in UV and visible light. Biochem Biophys Res Commun 2004; 320(3): 1020–5. PMID:15240150
7. Minozzo FC, Rassier DE. The effects of Ca2+ and MgADP on force development during and after mus-cle length changes. PLoS ONE 2013; 8(7): e68866. doi:10.1371/journal.pone.0068866PMID: 23874795
8. Pavlov I, Novinger R, Rassier DE. The mechanical behavior of individual sarcomeres of myofibrils iso-lated from rabbit psoas muscle. Am J Physiol Cell Physiol 2009; 297(5): C1211–9. doi:10.1152/ajpcell.
00233.2009PMID:19710362
9. Gordon AM, Qian Y, Luo Z, Wang CK, Mondares RL, Martyn DA. Characterization of troponin-C inter-actions in skinned barnacle muscle: comparison with troponin-C from rabbit striated muscle. J Muscle Res Cell Motil 1997; 18: 643–653. PMID:9429158
10. Allingham JS, Smith R, Rayment I. The structural basis of blebbistatin inhibition and specificity for myo-sin II. Nat Struct Mol Biol 2005; 12: 378–379. PMID:15750603
11. Kovacs M, Toth J, Hetenyi C, Malnasi-Csizmadia A, Sellers JR. Mechanism of blebbistatin inhibition of myosin II. J Biol Chem 2004; 279: 35557–35563. PMID:15205456
12. Straight AF, Cheung A, Limouze J, Chen I, Westwood NJ, Sellers JR, et al. Dissecting temporal and spatial control of cytokinesis with a myosin II inhibitor. Science 2003; 299: 1743–1747. PMID:
12637748
13. Kawai M, Brandt PW. Sinusoidal analysis: a high resolution method for correlating biochemical reac-tions with physiological processes in activated skeletal muscles of rabbit, frog and crayfish. J Muscle Res Cell Motil 1980; 3: 279–303. PMID:6971874
14. Lännergren J. The effect of low-level activation on the mechanical properties of isolated frog muscle fi-bers. J Gen Physiol 1971; 58(2): 145–62. PMID:5559620
15. Hill DK. Tension due to interaction between the sliding filaments in resting striated muscle. The effect of stimulation. J Physiol 1968; 199: 637–684. PMID:5710425
16. Proske U, Morgan DL, Gregory JE. Thixotropy in skeletal muscle and in muscle spindles: a review. Prog Neurobiol 1993; 41(6): 705–21. PMID:8140258
17. Herbst M. Studies on the relation between latency relaxation and resting cross-bridges of frog skeletal muscle. Pflugers Arch 1976; 364(1): 71–6. PMID:1085439
18. Campbell KS, Lakie M. A cross-bridge mechanism can explain the thixotropic short-range elastic com-ponent of relaxed frog skeletal muscle. J Physiol 1998; 510: 941–962. PMID:9660904
19. Mutungi G, Ranatunga KW. Do cross-bridges contribute to the tension during stretch of passive mus-cle? A response. J Muscle Res Cell Motil 2000; 21(3): 301–2. PMID:10952178
20. Kellermayer MS, Smith SB, Bustamante C, Granzier HL. Mechanical fatigue in repetitively stretched single molecules of titin. Biophys J 2001; 80(2): 852–63. PMID:11159452
21. Minajeva A, Kulke M, Fernandez JM, Linke WA. Unfolding of titin domains explains the viscoelastic be-havior of skeletal myofibrils. Biophys J 2001; 80: 1442–1451. PMID:11222304
22. Bianco P, Nagy A, Kengyel A, Szatmári D, Mártonfalvi Z, Huber T, et al. Interaction forces between F-actin and titin PEVK domain measured with optical tweezers. Biophys J 2007; 93: 2102–2109. PMID:
17513381
23. Campbell KS, Lakie M. Response to Bianco et al.: interaction forces between F-actin and titin PEVK do-main measured with optical tweezers. Biophys J 2007; 94: 327–328. PMID:17921211
24. Kellermayer MSZ, Bianco P, Martonfalvi Z, Nagy A, Kengyel A, Szatmári D, et al. Muscle Thixotropy: More than Just Cross-Bridges? Response to Comment by Campbell and Lakie. Biophys J 2008; 94(1): 329–330.
25. Cornachione AS, Rassier DE (2012) A non-cross-bridge, static tension is present in permeabilized skel-etal muscle fibers after active force inhibition or actin extraction. Am J Physiol Cell Physiol 302(3): C566–74. doi:10.1152/ajpcell.00355.2011PMID:22094333
26. Rassier DE, Leite FS, Nocella M, Cornachione AS, Colombini B, Bagni MA. Non-crossbridge forces in activated striated muscles: a titin dependent mechanism of regulation? J Muscle Res Cell Motil, Nov 25, 2014. [Epub ahead of print].
27. Campbell KS, Moss RL. History-dependent mechanical properties of permeabilized rat soleus muscle fibers. Biophys J 2002; 82: 929–943. PMID:11806934
28. Lannergren J. The effect of low-level activation on the mechanical properties of isolated frog muscle fi-bers. J Gen Physiol 58: 1971;145–162. PMID:5559620
29. Lakie M, Robson LG. Thixotropy in frog single muscle fibres. Exp Physiol 1990; 75: 123–125. PMID:
2310557
30. Wang MD, Schnitzer MJ, Yin H, Landick R, Gelles J, Block SM. Force and Velocity Measured for Single Molecules of RNA Polymerase. Science 282: 1998;902–7. PMID:9794753