111
PART I. STUDY REGARDING THE OPTIMIZATION OF THE
BIOSCOURING TREATMENT IN ULTRASOUND
ON 60 % COTTON + 40 % COTTONISED FLAX MATERIALS
PUSTIANU Monica
1,2,
SÎRGHIE Cecilia
2,
BÖHM-RÉVÉSZ Gabriella
3,
DOCHIA Mihaela
21 “Aurel Vlaicu” University of Arad, Romania, Faculty of Engineering
Postal address, 310330 Arad, Romania, E-Mail:pustianumonica@yahoo.com
2 “Aurel Vlaicu” University of Arad, Romania, Research Development Innovation
in Technical and Natural Science Institute
Postal address, 310330 Arad, Romania, E-Mail:pustianumonica@yahoo.com, dochiamihaela@yahoo.com, cecilias1369@yahoo.com
3 The University of Oradea, Faculty of Energy Engineering and Industrial Management
Postal address, 410087 Oradea, Romania, revesz_gaby@yahoo.com,
Corresponding author: Dochia Mihaela, E-mail: dochiamihaela@yahoo.com
Abstract: In the past years the commercial products for the bioscouring treatment were usually dedicated only for 100 % cotton or only for 100% lignocelluloses fabrics. The development of hemp/cotton or flax/cotton mixtures fabrics leds to the necessity of finding of the most apropiate products that could be used for different enzymatic treatments on these types of fabrics.The usage of the commercial product SERA ZYME C-PE for bioscouring treatment in ultrasound conditions on 60 % cotton + 40 % cottonised flax was studied in this work. The optimization of the Bioscouring treatment in ultrasound on 60 % cotton + 40 % hemp materials using the same commercial product was previous published. In order to assess more accurately the influence of some process parameters of the bioscouring treatment in a mathematical modeling of the process was made and a central compound rotatable program with two independent variable: x1 - the concentration of enzyme
(%) and x 2 - treatment time (minutes) was used. The independent variable considered was y 1 – the weight
loss. The aim of this study was to investigate the behaviour of cottonised flax/cotton mixtures for the same conditions of bioscouring treatment used as for hemp/cotton mixtures.
Key words: cotton, cottonised flax, enzymes, bioscouring treatment with ultrasound, weight loss.
1.
INTRODUCTION
The aim of the removal of the impurities present in the cellulosic materials is to obtain a good absorbency or wettability of the materials necessary for further dyeing and finishing processes. This treatment is referred to as scouring when conventional alkaline processes are followed. And the treatment is referred to as bioscouring when environmentally friendly enzymes are used. The conventional treatment is carried out at higher temperatures with alkalis, which has the disadvantages such as high energy consumption and polluted wastewaters [1]. The bioscouring treatment unlike the classical alkaline treatment is more environmentally friendly by less energy
112
non-cellulosic impurities [2, 3]. For the enzymatic treatment the commercial product SERA
ZYME C-PE [4], based on 5-15 % Pectate Lyase (E.C.4.2.2.2) in phosphate buffer solution
of 0.1 Molar monosodium/disodium phosphate (pH = 7.5) was used. All the experiments
were carried out in ultrasound. The producer instructions for usage of SERA ZYME C-PE
for 100 % cotton fabrics is to carried out the process less then 20 minutes at 1g/L enzyme
concentration [4]. Considering that the lignocellulosic materials shows higher non-cellulosic
impurities content we appreciated that the treatment conditions (time and enzyme
concentration) for such blended fabrics should be slightly higher than for 100 % cotton
fabrics. In this respect the bioscouring treatment for 60 % cotton/40 % cottonised flax
blended fabrics was performed in ultrasound with a variable concentration of enzyme (1-3
%) and a larger range for the treatment time (20-60 min.). By measuring the weight loss, the
optimum working parameters for the Bioscouring treatment in ultrasound were determined.
2.
EXPERIMANTAL PART
Plain woven of 60 % cotton + 40 % cottonised flax composition was used. The woven material has the width 120 ± 3 cm, weight 220 ± 10 g/m2, warp sett 200 ± 10 fibers/10cm, weft sett
170 ± 10 fibers/10 cm. The treatment was performed in ultrasound in a multi-frequency ultrasonic cleaning unit; model TI-H-10 from Elma Schmidbauer GmbH, Germany. The energy of sonication applied was 200 W (ultrasonic power effective) and 800 W (ultrasonic peak performance max). For the bioscouring treatment a variable concentration between 1-3 % of comercial enzyme was used, 2 mL/L HEPTOL NWS which is a sequestrant agent with binding role for the metal ions in water with high hardness, regardless of temperature; 2 mL/L SULFOLEN 148 a wetting and scouring agent; 10 % of the fleet of treatment was pH = 7.5 buffer solution of 0.1 Molar (sodium phosphate/disodium phosphate,); liquid to fabric ratio - H 10:1, at temperature T = 55 0C and time - t = (20-60) minutes
[5]. After a series of preliminary determinations, to achieve a minimum number of experiments, these were conducted using a central, rotatable second order compound program with two independent variables [6, 7]. The variation limits and experimental plan are presented in Tables 1 and 2.
Table 1: The variation limits of independent variables Table 2: The experimental plan with two independent variables
Value. code
Real value -1,414 -1 0 1 +1,414
x - enzyme concentration 1 1,7 2 2,7 3
y - time (minutes) 20 34 40 54 60
Exp. No. x y
1. -1 -1
2. 1 -1
3. -1 1
4. 1 1
5. -1.414 0
6. 1,414 0
7. 0 -1,414
8. 0 1,414
9. 0 0
10. 0 0
11. 0 0
12. 0 0
13. 0 0
3.
RESULTS AND DISCUSSIONS
113
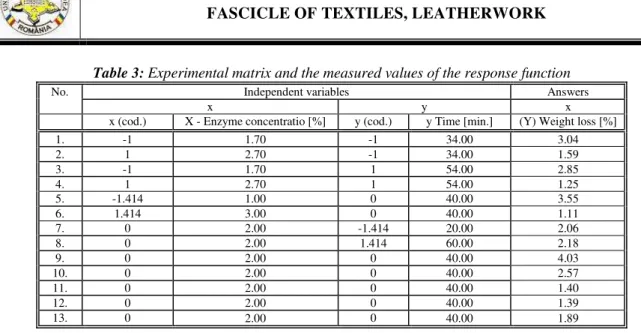
Table 3: Experimental matrix and the measured values of the response function
3.1. Mathematical model interpretation obtained
In order to assess more accurately the influence of some process parameters of the Bioscouring treatment in US of 40 % flax + 60 % cotton blended fabric - the concentration of enzyme (%) and treatment time (minutes) – on the weight loss, a mathematical modeling of the process was made, using a central compound rotatable program with two independent variables. The two chosen independent variables are: x - the concentration of enzyme [%] and y - time (minutes). As goal-function the weight loss (%) (denoted by Y) was chosen. Enzyme concentration varies between 1-3 % and the treatment time between 20 - 60 minutes.The second order central compound rotatable program has the following mathematical expression:
Y = b0 + b1x+ b2y+ b12xy+ b11x2 + b22y2 (1)
For the experimental data a program in Mathcad Professional and Excel was used, and a regression equation was obtained [6, 7, 8, 9]. Coefficients of the regression equation are presented in Table 4.
Table 4: Regression equation coefficients, dispersion and the verification of the significance of the dispersion equation coefficients using the Student test
Regression equation coefficients Calculated dispersion "S"
The coefficients significance using Student test
tT=t, = t0,05;6 = 2,132; (If tc> tT-term is significant)
b0 2.256538
S=0.021251
tc0 9.281732 significant
b1 -0.81252 tc1 -5.34737 significant
b2 -0.04504 tc2 -0.29642 nesignificant
b11 0.027727 tc11 0.158621 nesignificant
b22 -0.07733 tc22 -0.44236 nesignificant
b12 -0.0375 tc12 -0.1234 nesignificant
The regression equation obtained after eliminating insignificant coefficients is:
F(x.y) = 2.256 + (-0.812)x
(2)3.1.1. Verification of the coefficients significance
Verifying the significance of coefficients is important because it can confirm or invalidate the created model. The Student test compares the average of a random variable with mean standard deviation. For the central part of the program, in which all independent variables have zero code value the dispersion "S" is calculated. The dispersion value was shown in Table 4. The significance of the regression equation coefficients was tested using Student test with critical table value for the test t, = t0,05;6 = 2,132. The test values and the significance of the coefficients were presented in
Table 4.
No. Independent variables Answers
x y x
x (cod.) X - Enzyme concentratio [%] y (cod.) y Time [min.] (Y) Weight loss [%]
1. -1 1.70 -1 34.00 3.04
2. 1 2.70 -1 34.00 1.59
3. -1 1.70 1 54.00 2.85
4. 1 2.70 1 54.00 1.25
5. -1.414 1.00 0 40.00 3.55
6. 1.414 3.00 0 40.00 1.11
7. 0 2.00 -1.414 20.00 2.06
8. 0 2.00 1.414 60.00 2.18
9. 0 2.00 0 40.00 4.03
10. 0 2.00 0 40.00 2.57
11. 0 2.00 0 40.00 1.40
12. 0 2.00 0 40.00 1.39
114 3.1.2 Verification of the model adequacy
The appropriate model was verified using Fisher test and percentage deviation.The deviations values are shown in Table 5. To verify the model adequacy and its ability to express the studied phenomenon mathematical, the Ycalc values were calculated and the deviation “A” between
the measured and calculated values was established according to Table 5. It can be observed that some of the individual deviations do not fit within the limits imposed by ± 10 %, which indicates a poor adequacy of the model.
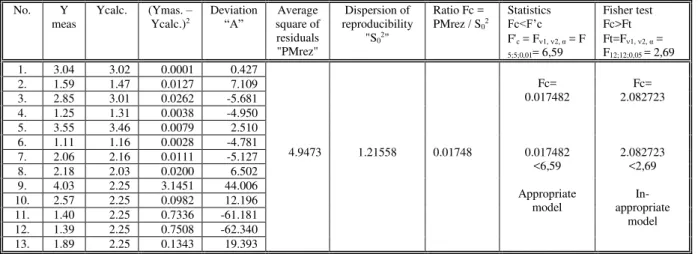
Table 5: Adequacy calculation model
No. Y
meas
Ycalc. (Ymas. – Ycalc.)2
Deviation
“A” square of Average residuals "PMrez"
Dispersion of reproducibility
"S02"
Ratio Fc = PMrez / S02
Statistics
Fc<F’c F'c = F1, 2, α = F
5;5;0,01= 6,59
Fisher test Fc>Ft Ft=F1, 2, α =
F12;12;0,05 = 2,69
1. 3.04 3.02 0.0001 0.427
4.9473 1.21558 0.01748
Fc= 0.017482
0.017482 <6,59
Appropriate model
Fc= 2.082723
2.082723 <2,69
In- appropriate
model
2. 1.59 1.47 0.0127 7.109
3. 2.85 3.01 0.0262 -5.681
4. 1.25 1.31 0.0038 -4.950
5. 3.55 3.46 0.0079 2.510
6. 1.11 1.16 0.0028 -4.781
7. 2.06 2.16 0.0111 -5.127
8. 2.18 2.03 0.0200 6.502
9. 4.03 2.25 3.1451 44.006
10. 2.57 2.25 0.0982 12.196
11. 1.40 2.25 0.7336 -61.181
12. 1.39 2.25 0.7508 -62.340
13. 1.89 2.25 0.1343 19.393
The degree of concordance of the mathematical model was verified using F'c statistics.
Initially the average square of residuals PMrez and the reproducibility of dispersion S02 were
calculated, obtaining the values shown in Table 5. The ratio Fc = PMrez/S02 was compared with the
critical value F'c = F1, 2, α = F 5;5;0,01= 6,59. To verify deviation of the survey data from the mean
value the Fisher-Snedecor test was used. Fc = 2.119134 calculated value is lower than the critical
value Fc = Fα , 1, 2 = F0,05 ; 12, 4 = 5,91 which indicates that the deviations appear due to the
independent variables. The quality of approximation of the mathematical model expressed by the standard error shows the scattering of the experimental values around the regression equation: 84.06 %. The correlation coefficient has the value: rx1x2= -0.02032, rx1y = -0.7756628 and rx2z =
-0.0429969. The significance of the simple correlation coefficients is checked using the Student test. The calculated values are: tc x1y= -4.07604, tc x2y= -0.1427366, tc x1x2 = -0.067393. The calculated
values are lower than the critical table value tα, =t0,05; 11 = 2,201 for tx1y and tx2y which indicates that
there is no any relationship between variables, tx1x2 = -0.3752093 so there is some correlation
between independent variables The multiple determination coefficient 0.519859 shows that the influence of the two independent variables on the outcome is 51,98 %, the rest being caused by other factors. The response interpretation and search of extremes are more difficult and it preferred to bring the surface into a form more accessible for the analysis using canonical transformation. Allowing a much easier localization of the extreme, the canonical transformation can be seen as an optimization method. The canonical analysis transforms the regression equation in a more simple form and interprets the resulting expression using geometric concepts:
F(x.y) = 2.256 + (-0.812)x
(3)115
M
Fig. 1: The dependence of the goal-function on the independent variables:
M
Fig. 2: Contour curves for various values of Y (weight loss)
Figure 1 presents the plot which shows the dependence of the goal-function on the two independent variables. The response surface of the regression equation is a plane surface. The constant level curves obtained by cutting the response surface with constant level plans presented in Figure 2 allows the evaluation of the dependent variable Y, according to the conditions imposed by the independent variables x and y. The figure presents contour curves for various values of weight loss, 1.11 to 4.03 between
3.2 Interpretation of the obtained mathematical model technology
By analyzing the expression of the obtained goal function:
F(x.y) = 2.256 + (-0.812)x
(4)These can be seen: the influence of the two independent parameters, x (enzyme concentration) and y (treatment time) on the dependent variable Y (weight loss) manifests in different way. Only x variable (enzyme concentration) influences directly the outcome Y (weight loss): the deacreasing of x (enzyme concentration) conducts to the increasing of Y (weight loss); the influence of variable x (enzyme concentration), on Y (weight loss) is 31.5 %; the influence of variable y (treatment time), on Y (weight loss) is 0 %; the absence of quadratic form for both parameters indicates that the response surface defined by the obtained mathematical model, is not well formed, reinforcing the hypothesis regarding the influence of only one parameter on the outcome.
Figure 3 shows the dependence of the goal-function on one of the two independent variables for all significant values of the parameters, given that the second independent variable is constant. It can be observed how, for a constant value of enzyme concentration, the graph representing the variation of weight loss versus time, indicates for the interval [–1414, 1,414], (between 20–60 minutes) a constant weight loss, which indicates a zero influence of this parameter on the weight loss.
2 1 0 1 2
x=0 x1=-1.414 x2=-1 x3=1 x4=1.414
T=f(y) pentru x=c onstant
t imp ul [m in.]
pi er de re a m a si ca [ % ]
3 .40 4
1 .10 8 g x y() g x 1 y( ) g x 2 y( ) g x 3 y( ) g x 4 y( )
1 .40 6 1 .41 4
y
2 1 .6 1 .2 0 .80 .4 0 0 .4 0 .81 .2 1 .6 2 1 1 .3 1 .6 1 .9 2 .2 2 .5 2 .8 3 .1 3 .4 3 .7 4 y=0 y=-1.414 y=-1 y=1 y=1.414
Z=f(x) pentru y=c onstant
con cent rat ia de en zima [%]
pi er de re a m a si c a [% }
3 .40 4
1 .11 4 f x y() f x y 1( ) f x y 2( ) f x y 3( ) f x y 4( )
1 .40 6 1 .41 4
x
Fig. 3: The dependence of the goal-function on all significant values of y parameters for x =
constant
Fig. 4: The dependence of the goal-function on all significant values of x
parameters for y = constant
116
observed that conducting the experiment with values for variable y between 20–60 minutes will result a linear decrease of weight loss in the same time with the increasing of the enzymes concentration.
4. CONCLUSIONS
It was found that the chosen range of the treatmet parameters (time and concentration) does not influence the process because the enzymatic reaction occurs in less than 20 minutes (as recommended by the producer for 100 % cotton materials). It appears that the behaviour of the 40 % cottonised flax + 60 % cotton fabrics are different from the 40 % hemp + 60 % cotton fabrics [1]. The behaviour of the 40 % cottonised flax + 60 % cotton fabrics is simmilar with 100 % cotton fabrics which can be explained by the fact that previous cottonisation method applied to flax fibers led to fibers with similar characteristics to cotton ones.
ACKNOWLEDGEMENT
This work was supported by a grant of the Romanian National Authority for Scientific
Research and Innovation, CNCS – UEFISCDI, project number PN-II-RU-TE-2014-4-1370
and ‘‘Bast plants - Renewable Strategic Resources for European Economy - BASTEURES’’
project, no. 210/2010 POS-CCE - supported by Structural Founds - “Investment in Your Future”.
REFERENCES
[1] Q. Wang, X.-R. Fan, Z.-Z. Hua, J. Chen, “Optimizing bioscouring condition of cotton knitted fabrics with an alkaline pectinase from Bacillus subtilis WSHB04-02 by using response
surface methodology”, Biochemical Engineering Journal, 34, pp. 107–113, 2007.
[2] I. V. Istoc, M. Pustianu, A. Bucevschi, M. A. Dochia and C. Sîrghie, “Study regarding
the optimization of the bioscouring treatment on 100 % cotton materials”, in Advanced in
Environmental Technologies, Agriculture, Food and Animal Science. ISSN 2227-4359, ISBN 978-1-61804-188-3. Proceeding of the 2nd International Conference on Energy and Environment
Technologies and Equipment (EEETE '13), series 10, Brașov, Romania, 2013.
[3] E.S. Abdel-Halim, H.M. Fahmy, Moustafa M.G. Fouda, “Bioscouring of linen fabric in
comparison with conventional chemical treatment”, Carbohydrate Polymers, 74, pp. 707–711, 2008.
[4] Catalog DyStar Textilfarben GmbH, 2007.
[5] M. Pustianu,M. Dochia, M.S. Pernevan, C.Sîrghie, “Study regarding the influence of the
bioscouring treatment in ultrasound on 60 % cotton+40 % hemp materials, Part 1:Study regarding
the optimization of the bioscouring treatment”, in Annals of the University of Oradea, Fascicle of
Textiles, Leatherwork, VOLUME XV, No. 1, 2014, pp. 93– 98.
[6] A. Popescu, A. Grigoriu, C. Zaharia, R. Mureşan and A. Mureşan, “Mathematical
modeling and the technological process optimization for the bio-scouring of the cotton textile
materials”, Industria Textilă, vol. 61, pp. 70-80, 2010.
[7] R. Butnaru and L. Stoichițescu, “Special finishing procedures of textiles fabrics”, Editura
Gh. Asachi, Iași, 1995.
[8] R. Mihail, “Introduction to the strategy experimenting with applications in chemical
technology”, Ed. Scientific and Encyclopedic, Bucharest, 1976.
[9] S. Akhnazarova and V. Kafarov, “Experiment optimization in chemistry and chemical