382
O
RIGINALA
RTICLERev Bras Oftalmol. 2015; 74 (6): 382-5
Perfil paquimétrico horizontal
para a detecção do ceratocone
Horizontal pachymetric profile
for the detection of keratoconus
Bernardo Teixeira Lopes
1,2,3, Isaac de Carvalho Ramos
1, Marcella Quaresma Salomão
1,2,3, Ana Laura Caiado
Canedo
1, Renato Ambrósio Jr.
1,2,31 Rio de Janeiro Corneal Tomography and Biomechanical Study Group, Rio de Janeiro, RJ, Brasil. 2 Departamento de Oftalmologia, Universidade Federal de São Paulo, São Paulo, SP, Brasil. 3 Instituto de Olhos Renato Ambrósio, Rio de Janeiro, RJ, Brasil.
Received for publication 01/08/2015 - Accepted for publication 25/08/2015
The authors declare no conflicts of interests.
Objetivo: Avaliar a capacidade de dados de perfil paquimétrico horizontal para distinguir o ceratocone de córneas normais, e comparar a precisão desses índices com índices tomográficos mais complexos. Métodos: Em um estudo retrospectivo, um olho selecionados aleatoriamente de 225 pacientes com ceratocone bilateral e de 335 pacientes com córneas normais foram incluídos. Todos os pacientes foram examinados por um especialista em córnea e foram submetidos ao exame de tomografia de córnea, Pentacam HR (Oculus, Wetzlar, Alemanha). Os dados de perfil paquimétrico horizontal em 6 milímetros passando pelo ápice foi avaliado. Com esses dados, a espessura no ápice corneano (P.ápice), a espessura no ponto mais fino do perfil horizontal (P.min.H), a progressão paquimétrica do ponto mais fino para o mais espesso (PPmin-máx), a progressão paquimétrica média no meridiano tendo como referencial a média normal (PPméd) e a adequação a uma linha de tendência polinomial do segundo grau (R2). Um modelo de inteligência artificial foi construído para combinar esses dados. O desempenho para distinguir ceratocone do normal foi avaliada por curvas ROC. Resultados:
Todos os índices avaliados foram estatisticamente diferentes entre os dois grupos (p <0,001). A área sob a curva ROC (AUC) de paquimetria no ápice e no TP foram de 0,904 e 0,938, respectivamente. O índice tomográfica com maior AUC foi o BAD-D (0,997).Em relação ao perfil horizontal, a AUC do P.min.H e PPmin-max foram 0,915 e 0,927, respectivamente. A adequação à linha de tendência para o gráfico de espessura no ápice apresentou AUC 0,896. O melhor desempenho foi obtido com o PPméd (AUC 0,932 Sensibilidade = 84,4% e especificidade de 92,5%). O modelo de inteligência artificial combinando todos os itens derivados do perfil horizontal melhorou o desempenho (AUC 0,991 Sens. = 96% e espec. = 98%). Conclusão: O perfil de espessura horizontal permite detectar ceratocone, com capacidade comparável aos índices mais complexos. Esse tipo de análise pode fornecer o básico para novas aborda-gens, que utilizem dados presentes em aparelhos mais simples que o tomógrafo reduzindo o custo para os pacientes.
Descritores: Ceratocone/diagnóstico; Doenças da córnea; Córnea/anatomia & histologia;Tomografia/normas
R
ESUMOPurpose: To evaluate the ability of horizontal thickness profile to distinguish keratoconus from normal corneas, and compare the accuracy of these indices with more complex tomographic indices. Methods: In a retrospective study, one eye randomly selected from 225 patients with bilateral keratoconus and 335 patients with normal corneas were included. All patients were examined by a corneal specialist and underwent the examination of corneal tomography, Pentacam HR (Oculus, Wetzlar, Germany). Data of horizontal pachymetric profile passing through the apex of 6 mm was evaluated. With these data, the thickness at the corneal apex (P.ápice), the thickness of the thinnest point of the horizontal profile (P.min.H), the pachymetric progression from the thinnest point to the thickest (PPmin-max), the average pachymetric progression in the meridian as reference the average from the normal population (PPméd) and the fitness with a second degree polynomial trendline (R2). An artificial intelligence model was built to combine this data. The performance for distinguishing normal keratoconus was evaluated by ROC curves. Results: All of these indices were statistically different between the two groups (p <0.001). The area under the ROC curve (AUC) thickness at the apex and TP were 0.904 and 0.938, respectively. The tomographic index with higher AUC was BAD-D (0.997). Regarding the horizontal profile, the AUC of PP.min.H and PPmin-max were 0.915 and 0.927, respectively. The fitness to the trendline to the horizontal thickness graph AUC was 0.896. The best performance was obtained with the PPméd (AUC 0.932 sensitivity = 84.4% and specificity of 92.5%). The artificial intelligence model combining all items derived from horizontal profile improved performance (AUC 0.991 Sensitivity = 96% and specificity of 98%). Conclusion: The horizontal thickness profile can detect keratoconus, with a capacity comparable to more complex indices. This type of analysis can provide the basics for new approaches, using data present in simpler devices than the tomographer reducing the cost for the patients.
Keywords: Keratoconus/diagnosis; Coneral diseases; Córnea/anatomy & histology; Tomography/standards
A
BSTRACT383 Horizontal pachymetric profile for the detection of keratoconus
I
NTRODUCTIONK
eratoconus, the most common corneal ectasia, had its diagnosis boosted by the introduction of new technologies for ophthalmic practice in recent decades(1, 2). Since the introduction of the computerized analysis of the Placido images in 1959 by Reynolds and Kratt(3) and its development completed by Klyce in the 80’s(4) with the introduction of colored maps of anterior corneal surface, the use of new diagnostic tools has grown at intense pace.Currently we have sectional images of the cornea able to provide images of the anterior and posterior corneal surfaces, as well as a complete pachymetric map with thickness measurements at more than 10,000 points (the corneal tomography)(5-7). However, along with this introductory arsenal there is an associated cost which limits its widespread use throughout the population. Specially in a country with serious problems in the health system like ours.
Keeping that in mind, there is a growing effort to try to extract as much diagnostic power as possible from minimum information of the cornea. With the aid of machine learning and artificial intelligence tools we describe a new approach to the diagnosis of keratoconus which uses only the thickness data in extension of 6 mm in the horizontal meridian of the cornea centered in its apex.
M
ETHODSSelection of patients
The present study followed the recommendations of the resolution of CNS 466/12, and had the approval of the Ethics Committee of the Federal University of São Paulo (UNIFESP). In a retrospective model, the medical records of patients with clinical diagnosis of keratoconus and patients with normal corneas were reviewed. One randomly selected eye of each patient was included in the study. All patients were examined by the same specialist in cornea (RAJr). Patients with the diagnosis in this study were defined by the following signs: typical findings in Placido topography as inferior-superior asymmetry to-center and/or pattern in asymmetrical butterfly tie, with or without skewed axes and at least one clinical sign including: stromal thinning, conical protrusion of the cornea, Fleischer ring, Vogt’s striae, increase of corneal nerves, increased intensity of the reflection of the corneal endothelial, subepiteliais fibrous lines and signs of Munson and Rizutti.
The use of contact lenses has been discontinued for at least three weeks for the rigid and a week for gelatinous ones beforethe measurements. Patients with a previous history of eye surgery, extensive corneal scarring, conjunctive tissue disease or pregnancy in the last 12 months were excluded.
CT Examination
All patients underwent corneal tomography examination by the rotational method of Scheimpflug (Pentacam HR, Oculus Gmbh, Wetzlar, Germany). An experienced examiner acquired the images automatically after correct alignment by using the
joystick. Twenty-five simple Scheimplug images captured in 2
seconds for each eye were used. The quality of the images was checked so that only images with good quality were included in the study. This type of automatic capture allows greater reliability in the identification of the corneal apex and reproducibility of the results of the scanner.
The thickness data of the horizontal meridian passing through the apex with 6 mm long (0.2 mm intervals) and the center corneal Apex were evaluated. The main variables included in the analysis were: corneal thickness at the apex (P.ápice), the point of least thickness in that meridian (P.min.H), the pachymetric progression of the thinnest point to the thickest point (PPmin-max), the average pachymetric progression in the meridian taking as a reference the normal average (PPmed) and the adaptation to a line of second degree polynomial trend (R2), since the horizontal pachymetry graph in the normal case forms a parabola, while in cases of keratoconus this form is not seen in most cases (Figure 1). Cases of keratoconus were staged in four groups according to the topographic system of classification present in the pentacam (TKC).
Statistical analysis
The normal distribution of the samples was inferred through a Kolmogorov-Smirnov test of adhesion to normality. The groups were then compared by the non-parametric method of Mann-Whitney. ROC curves were constructed for the variables with a statistically significant difference, and the accuracy was measured by the area under the ROC curve. The data were analyzed using the program SPSS 20.0 (IBM SPSS statistics, Armonk, New York, USA).
Support vector machine
In our study we employ an automated classification method using thickness data to discriminate between normal eyes and eyes with keratoconus in an objective and quantitative way. The support vector machine (SVM) was generated by artificial intelligence algorithm of kernlab software (R packages, version 0.9.19). This approach is particularly useful when the data set is not linearly separable. In this case the data is mapped into a more advanced dimensional space where a separation surface can be found (hyperplane). Figure 2 illustrates the hyperplane. To evaluate the ability of generalization of our model we used within the algorithm a cross-validation technique in ten
Figure 1: Horizontal pachymetric profile of a patient with normal
cornea (blue) and keratoconus (red), and their adequacy to the second degree polynomial graph (parabola).
384 Lopes BT, Ramos IC, Salomão MQ, CanedoAC , Ambrósio Jr R
R
ESULTSWe included 335 eyes of 335 patients with normal corneas, and 225 eyes of 225 patients with keratoconus. The average age in the normal group was 35 ± 3.2 years and 33 ± 5.1 years. All indexes evaluated showed a statistically significant difference between groups (p<0.001).
The area under the ROC curve (AUC) was 0.904 (sensitivity 81%, specificity 86%) for the corneal thickness at the apex (P.apex) and 0.938 (sensitivity 85%, specificity 90%) for the corneal thickness at the thinnest point (P.min)
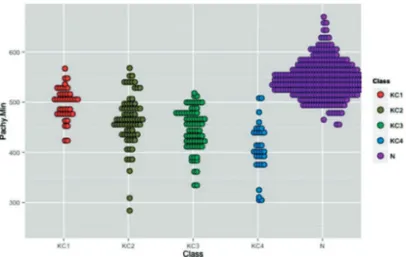
regarding the indixes derived from corneal thickness at the apex. The thickness at the thinnest point of the horizontal profile (P.min.H) had AUC of 0.915 (sensitivity 80.1%, specificity 88.3%), and the pachymetric progression of the thinnest point to the thicker (Ppmin-max), AUC 0.927 (sensitivity 85.8%, specificity 90.7%). The adequacy of the trend line (R2) had AUC of 0.896 (sensitivity 75%, specificity 95%). The best performance was seen in the average pachymetric progression compared to normal (PPmed), AUC 0.932 (sensitivity 85%, specificity 92.5%). The model generated by the support vector machine (SVM) showed AUC of 0.991 (sensitivity 96%, specificity 98%). Figures 3 and 4 show the distribution of patients with keratoconus in the four groups of staging compared to normal for P.min and SVM indexes. It is possible to see that for the SVM, even in groups of milder disease (I and II) there is a small overlay between patients with keratoconus and the nor-mal ones, while for the P.min this overlay occurs even in the groups of more advanced disease.
The best tomographic indexes considering all corneal area were the posterior rising in the thinnest point (EPPMF) AUC 0.988 (sensitivity 95.7%, specificity 97.3%), and the total deviation in the display of Belin and Ambrose (D-total) AUC 0.997 (sensitivity 98%, specificity 99%). However, there was no statistically significant difference between the performance of these indixes and the performance of SVM. Table 1 summarizes the data accuracy.
Figure 2: Example of optimized hyperplane to separate non-linearly
separable data.
Figure 3: Distribution of patients with keratoconus in the four groups
of staging compared to normal for P.min
Figure 4: Distribution of patients with keratoconus in the four groups
of staging compared to normal for SVM
Table 1
Accuracy of the indexes derived from the horizontal pachymetric profile and of corneal tomography indexes.
AUC Sensitivity % Specificity %
P.apex 0.904 81 86 P. min. 0.938 85 90 P. min. H 0.915 80,1 88.3 P. min-max 0.927 85.8 90.7 R2 0.896 85 95 SVM 0.991 96 98 EPPMF 0.988 95.7 97.3 D-total 0.997 98 99
Rev Bras Oftalmol. 2015; 74 (6): 382-5
partitions (10-fold cross validation). This way we estimated how accurate is the model in practice, i.e., its performance to a new set of data. This method is employed by randomly dividing the sample into 10 subsamples of roughly the same size. Then the data of 9 of these subsamples is used to build the model, and the sample omitted is used to evaluate the error rate of the model. The process is repeated 10 times and the model with the lowest estimated error in cross-validation is used.
D
ISCUSSIONThe diagnosis of keratoconus is still presented as a challenge for the daily ophthalmic practice, mainly in its milder forms. An arsenal of increasingly contrived devices is there to try to solve this problem.
385 Horizontal pachymetric profile for the detection of keratoconus
Corresponding Author:
Bernardo T Lopes
Rua Conde de Bonfim, 211/712 TijucaRio de Janeiro, RJ, BrasilCEP 20520-050
E-mail: blopesmed@gmail.com
Rev Bras Oftalmol. 2015; 74 (6): 382-5 adapted an optical pachymeter with electronic records to map
the corneal thickness by the horizontal meridian, and they found out that the difference from the center to the periphery was higher in patients with keratoconus(8). With more complex analyses of the same data of horizontal thickness we tried to develop this concept, so that ot could be used to separate even the milder cases of the disease.
The method of artificial intelligence, or support vector machine (SVM), is a widely used method for the recognition of patterns, such as face recognition(9,10), handwritten character recognition(11). In the medical field it has already been applied on several occasions as in the detection of lung cancer(12) and even in ophthalmology to predict the quality of life related to vision from data of acuity and visual field in patients with glaucoma(13). This approach has also been used for the diagnosis of keratoconus. Arbelaez et al. used data of corneal tomography to build a model of SVM, and they obtained a sensitivity of 95% for keratoconus detection and specificity of 97.2%(14).
By using the approach of machine learning we could com-bine the data obtained only from the horizontal thickness profile. The accuracy of this analysis was superior to the thickness data in single points, as the pachymetry at the apex and the thinnest point. The performance obtained in our study was also similar to that obtained using the thickness, curvature and elevation data of the entire cornea by Arbelaez et al., as well as it was similar to the tomographic data in relation to the posterior surface (EPPMF) and the regression analysis of the thickness data, curvature and elevation (D-total) of our sample. These data suggest that a complex analysis of simpler data can be as effective as the analysis of complex data, even to identify mild cases of the disease (groups I and II). The advantage of the first method is that it potentially requires less investment and can be more widely spread to the population in general. Not only the Pentacam and other devices based on the Scheimpflug principle will benefit from this analysis, but virtually any device that provides a cross section of the cornea will be covered by this methodology, such as OCT, UBM, some biometers and even simpler equipment as some auto-refractors that provide this kind of analysis. The use of cross-validation allowed us to infer the external validity of the model. However, prospective studies to confirm this result are important.
R
EFERENCES1. Rabinowitz YS. Keratoconus. Surv Ophthalmol. 1998;42(4):297-319. 2. Krachmer JH, Feder RS, Belin MW. Keratoconus and related noninflammatory corneal thinning disorders. Surv Ophtalmol. 1984;28(4):293-322.
3. Reynolds A, Kratt H. The photo-electronic keratoscope. Contacto. 1959;3(3):53-9.
4. Klyce SD. Computer-assisted corneal topography. High-resolu-tion graphic presentaHigh-resolu-tion and analysis of keratoscopy. Invest Ophthalmol Vis Sci. 1984;25(12):1426-35.
5. Huang D. A reliable corneal tomography system is still needed. Ophthalmology. 2003;110(3):455-6.
6. Ambrosio R Jr, Belin MW. Imaging of the cornea: topography vs tomography. J Refract Surg. 2010;26(11):847-9.
7. Belin MW, Khachikian SS, McGhee CN, Patel D. New technology in corneal imaging. Int Ophtalmol Clin. 2010;50(3):177-89. Arch Ophtahlmol.1969;82(2):182-8.
9. Heisele BH, Poggio, T. Face recognition with support vector ma-chines: global versus component-based approach. Computer Vi-sion, 2001 ICCV 2001. Proceedings Eighth IEEE International Conference;2001. Available from: http://cbcl.mit.edu/cbcl/publi-cations/ps/iccv2001.pdf
10. Kashihara K. A brain-computer interface for potential non-ver-bal facial communication based on EEG signals related to spe-cific emotions. Front Neurosci. 2014;8:244.
11. Sk M, Ujjwal B, Swapan KP. Unconstrained Bangla online hand-writing recognition based on MLP and SVM. Proceedings of the 2011 Joint Workshop on Multilingual OCR and Analytics for Noisy Unstructured Text Data; Beijing, China: ACM; 2011.
12. Kureshi N, Abidi SS, Blouin C. A predictive model for personal-ized therapeutic interventions in non-small cell lung cancer. IEEE J Biomed Health Inform. 2014 Dec 4.
13. Hirasawa H, Murata H, Mayama C, Araie M, Asaoka R. Evalua-tion of various machine learning methods to predict vision-re-lated quality of life from visual field data and visual acuity in patients with glaucoma. Br J Ophthalmol. 2014;98(9):1230-5. 14. Arbelaez MC, Versaci F, Vestri G, Barboni P, Savini G. Use of a