Diagnostic use of neuro-spect
quantified with
99m
Tc-ECD
A model based on normal data
Belmonte Juarez Marroni1, Sabine Possa Marroni2, Caroline Muller Mayer3, Betina R. Braga4
ABSTRACT. Objective: The purpose of the present study was to prospectively quantify the normal limits of brain perfusion using specific software in a group of asymptomatic young volunteers submitted to single-photon emission tomography (SPECT) with
99mTc-ethyl cysteinate dimer (99mTc-ECD). Methods: We used 15 MBq/kg of intravenous 99mTc-ECD in 30 healthy volunteers
submitted to brief neuropsychological tests and a clinical questionnaire. These data were normalized relative to the cerebellum (Group 1) and to the brain cortex (Group 2). Statistical analysis was performed with Student’s t-test. The average radioactivity was 6.5 million counts/study. Results: The normalized (Group I) revealed an average value of 78.03%, with standard deviation (SD) of 4.07. Two volunteers in this group had slightly greater than two standard deviations from the mean. When we used (Group II), the average value was 71.01%, with a SD of 4.66. We observed a difference between groups of 9% (P<0.001). Conclusion: The present study suggests normal cortical perfusional values for a group of young asymptomatic volunteers, utilizing 99m
Tc-ECD. This allows further quantification of neuro-SPECT data, specifically comparisons across patient populations. Furthermore, this method represents a new tool that can be used to further explore the field of neuroimaging, particularly neuropsychiatry. Key words: SPECT, radiopharmaceutical, database, anatomical and functional normalization.
USO DE NEURO-SPECT QUANTIFICADO COM 99mTc-ECD: UM MODELO BASEADO EM DADOS NORMAIS
RESUMO. Objetivo: O objetivo do presente estudo foi quantificar prospectivamente os limites normais de perfusão cerebral utilizando software específico em um grupo de jovens voluntários assintomáticos submetidos a tomografia por emissão de fóton único (SPECT) com 99mTc-etil cisteinato dímero (99mTc-ECD). Métodos: Foram utilizados 15 MBq/kg intravenoso de 99mTc-ECD em 30 voluntários sadios submetidos a uma bateria breve de testes neuropsicológicos e questionário clínico. Estes
dados foram normalizados para o cerebelo (Grupo 1) e no córtex cerebral (Grupo 2). A análise estatística foi obtida através do teste T de Student. A atividade média foi de 6,5 milhões de contagens/estudo. Resultados: A normalização (Grupo I) revelou um valor médio de 78,03%, com um desvio-padrão (DP) de 4,07. Dois voluntários neste grupo tiveram valores ligeiramente maiores do que dois desvios padrões da média. Quando utilizado (Grupo II), o valor médio foi de 71,01%, com um desvio padrão de 4,66. Observou-se uma diferença entre grupos de 9% (P<0,001). Conclusão: O presente estudo sugere valores corticais perfusionais normais para um grupo de jovens voluntários assintomáticos, utilizando 99mTc-ECD. Isto permite ainda
a quantificação dos dados de neuro-SPECT, especificamente a comparação entre populações de pacientes. Além disso, este método apresenta uma nova ferramenta que pode ser usada para explorar ainda mais o campo da neuroimagem, particularmente em neuropsiquiatria.
Palavras-chave: SPECT, radiofármaco, base de dados, normalização anatômica e funcional.
INTRODUCTION
M
any previous studies have describedthe usefulness of scintigraphy cerebral perfusion, single-photon emission computed tomography (SPECT), as a
qualitative/quan-titative measure using hexamethyl-phenyle-thyleneaminexime (HMPAO) for neurologi-cal and psychiatric diseases.1,2
his investigative technique requires the
1Head of Nuclear Medicine Department, Hospital Ernesto Dornelles, Porto Alegre RS, Brazil. 2Neuropsychologist, Nuclimagem, Porto Alegre RS, Brazil. 3Nuclear
Physician, Nuclimagem, Porto Alegre RS, Brazil. 4 Medical Physicist, Nuclimagem. Porto Alegre RS, Brazil.
Belmonte J. Marroni. Av. Ipiranga, 1801 - 90160-092- Porto Alegre RS – Brasil. E-mail: [email protected] Disclosure: The authors report no conflicts of interest.
use of protocols for data acquisition and analysis pro-grams that contain basic population data. his tech-nique also recognizes some diferences in the biodistri-bution of the various neuroanatomical radiotracers.3
We developed a database using quantiied 99mTc ethyl cysteinate dimer (99mTc-ECD) that included information about the normal variation of regional brain perfusion in asymptomatic volunteers that we believe will con-tribute to the development of the neuropsychiatry spe-cialty. he database was developed using Mirage station and NeuroGam software on the Segami platform.
he gold standard for studying regional brain blood low is the use of radiolabeled markers that cross the in-tact blood-brain barrier, typically the inert gas 133Xe.4,5 For over two decades, molecular markers called static tracers, such as N-isopropyl-p-Iodoanphfetamine (IMP), HMPAO and 99mTc ECD, have been used to study chang-es in relative regional blood low using SPECT systems.6 his technique is called brain perfusion, and it relies on the coupled behavior of blood low and metabolism, which is used as a marker of neuronal activity.3,7
Because of their chemical stability, biodistribution and facilitating biochemical properties, such as being neutral and lipophilic,8 these tracers are taken from brain circulation and are retained in neurons for many hours. he coeicient of extraction of these tracers is dependent on the neuronal metabolic state and on the vascular integrity.
he purpose of the present study was to assess and visualize the brain perfusion with 99mTc-ECD using a quantiication program with anatomical and functional standardization to allow the conducting of comparative analyses between populations and individuals with a new critical overview about brain dysfunction.
METHODS
he present study aimed to evaluate normal brain per-fusion with scintigraphy using 99mTc-ECD from the In-stituto de Pesquisas Energéticas e Nucleares (IPEN) in an asymptomatic group of volunteers and was approved by the research ethics committee of Hospital Ernesto Dornelles of Porto Alegre. he sample consisted of 30 volunteers (12 men (40%) and 18 women (60%)) aged between 18 and 30 years, with a mean age of 23.17 years (±3.45 SD). his group was referred to as the Stan-dard Group of Young Adult (SGYA). Among the subjects, there was a predominance of medium and high levels of education (mean 12.13 years ±2.76 SD), which instilled increased conidence in the reliability of the answers given for the clinical questionnaire.
he data collection phase of the present study lasted
for 45 days, during which all of the volunteers under-went a brief neuropsychological screening. he volun-teers completed a standard informed consent form and answered a clinical questionnaire that was used to exclude individuals with a history of neurological, psychiatric, oncological or vascular disease, diabetes, traumatic brain injury, a history of cranial surgery, hy-pertension, epilepsy and individuals in chronic use of medications or drugs.
A brief neuropsychological screening was performed with the investigation prerequisite, aiming to exclude cognitive deicits, behavioral deicits and neuropsy-chiatric diseases, although without a depression scale. Several tasks were selected such as: sensitive neuropsy-chological executive function/attention and working memory tests / subtests. he Wechsler Adult Intelli-gence Scale (WAIS-R) subtest (digit span and digit sym-bol), phonemic Verbal Fluency (FAS), Attention/Con-centration Test (AC) and Stroop test were administered to all participants.
For the scintigraphic procedure, the participants were required to abstain from the use of central ner-vous system (CNS) stimulants or depressants, such as alcohol, tobacco, xanthines, cafeine and psychotropic drugs, for at least 12 hours before the start of the in-vestigation. Also, all volunteers that had a history of psychotrophic drugs use were excluded from the study.
he present study was performed with an IV injec-tion of 15 MBq/kg of 99mTc-ECD in an environment pro-tected from sensory stimulation. he patients had their eyes closed and were placed in an environment without auditory or visual stress for ive minutes before the in-jection. All of the doses were analyzed using column chromatography, with a minimum acceptance criterion of 95%. he acquisition of the images started between 30 and 60 minutes after the IV injection.
he data acquisition protocol used the following pa-rameters: a window energy of 20% for 99mTc with a 128 x 128 matrix, a low-energy high resolution (LEHR) col-limator at 30 seconds per projection and 120 images in a Helix gamma camera (Elscint). he processing was formed using a ramp ilter, and reconstruction was per-formed by iltered back projection. A Chang attenuation correction of 0.12 cm-1 was applied, and the data was post-iltered using a Butterworth ilter (order 9, cutof of 0.32 cycles/cm).
During the data acquisition process, the traditional images were adjusted to a Talairach map and underwent a step known as anatomic standardization. he choice of the cerebellum as an anatomical landmark has both anatomical and functional advantages. his brain region is easily identiiable, is well deined and has an excellent perfusion status compared to other brain structures. Additionally, according to the work by Tumeh et al.,9 cer-ebellar metabolism has no direct relationship with age, and this region’s metabolic loss is minimal during life.
Functional normalization is usually performed us-ing the cerebellum. However, other brain regions can also be used. In the present study, the SGYA data that were normalized using the cerebellum were identiied as Group I, and the SGYA data that were normalized relative to the cerebral cortex were identiied as Group II. For this comparative analysis, we chose the bilat-eral lobes of the brain (frontal, temporal, parietal and occipital) and the cerebellum, thalamus, putamen and caudate points. All of the data were expressed as a per-centage of the maximum voxel perfusion in relation to that of the cerebellum (Group I) or of the cerebral cor-tex (Group II). Subsequently, these data were compared using Student’s t-test to characterize their similarities and diferences. To determine the average global corti-cal perfusion level, we used all of Brodmann’s areas in both hemispheres in addition to a joint analysis of each region. As an additional reference analysis, we chose Brodmann’s area 44 (Broca’s area). We used the z-score value, which is the value that is obtained by subtracting the average perfusion of the patient by average perfu-sion of the group divided by the standard deviation of the same group, to better identify the perfusional vari-ables that were above or below 2 SD from the mean for each Brodmann’s area.
Measurement model. his model was designed using the
mathematical concept of volume in digital space and isotropic voxels.8 he unit of this division was the voxel, and the compartments that were formed were not the brain lobes, as is traditionally deined anatomically, but were spaces that were deined using a system of coor-dinates. By convention, we deined a reference line, de-nominated as the anterior and posterior commissures (AC-PC ), to be the line that follows the direction orbito-meatal direction.
hese commissural references encompass each ver-tical line automaver-tically and characterize a slice of each brain hemisphere into six compartments.
Processing of information. hese images underwent typical
processing methods, which were used to eliminate noise - and movement-related artifacts, as shown in Figure 1.
Anatomic standardization allows for the localiza-tion of the radiotracer signal from diferent scans into the same mathematical space that is deined by three orthogonal planes. he user must always aim at the boundary of the brain cortex, with lines that are deined in the anatomical model of Talairach (10). Notably, the only large central nervous system (CNS ) structure that remains outside of the lines is the cerebellum.
he functional normalization step is based on a model of the maximum or average radioisotopic activity of a region of the brain. his technique is referred to as relative quantiication, and it compares the reference to a known activity.
he model for relative quantiication that is de-scribed in the present paper allows for a variety of in-formation. he system allows the user to distinguish the brain perfusion in the three orthogonal planes, to distinguish the vascular area, to view Brodmann’s areas and to view anatomical structures as a reference, such as the basal ganglia and the brain lobes.
In this way, the system uses AC-PC lines and pro-vides volumes with inite areas, which is essential for comparative and serial analyses. he data for a particu-lar selection are expressed as the number of pixels, its percentage in relation to the total area selected, and its standard deviation.
tion. Moreover, this model allows for the selection of other references, including the entire brain, with aver-age or maximum activity. We have considered the possi-bility of using the z-score, which yields a 99% inclusion of the SGYA data for each Brodmann’s area. he result of this procedure is a display of the neuronal activity of a particular region, which is expressed using a color scale.
In the quantiied model, the color scale acquires the connotation of a statistical expression. An analysis of this display data should be observed with caution be-cause its statistical power is limited and is dependent on the incorporation of the population data to reliably ex-press the main characteristics of the community that is being studied. Moreover, the comparison groups must have similar demographics, such as age, to be consid-ered valid. Furthermore, for the comparisons to be ap-propriate there should be a greater similarity in the de-mographics between the patients under study and the normal controls.
Functional normalization: the importance of a correct refer-ence – Case 1: Patient CMFF is an 18-year-old female with a history of brain abscess in childhood who is cur-rently diagnosed with attention deicit and learning diiculties. he brain perfusion demonstrated a signii-cant cortical loss that was restricted to the peripheral area of the left parietal lobe, with no other diferences in regional perfusion. his result was conirmed by mag-netic resonance imaging, as shown in Figure 2. Below, we describe how to properly perform functional nor-malization and how to avoid hyperperfusion statistical artifacts using the cerebellum as a reference.
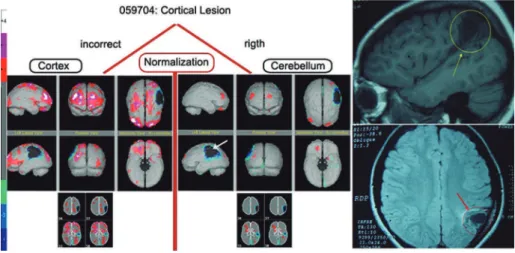
Conversely, when there is a cerebellar lesion and the cerebellum is used as a reference, there will be an
arti-icially high level of cortical activity that prevents the proper interpretation of the regional brain perfusion. his result can lead to false positives and false negatives after the inappropriate use of functional normalization and its validation as a statistical tool.
Case 2: Patient DCL is a 47-year-old male with AIDS-positive serum, and an abnormal inding at the right fron-tal lobe from Magnetic Resonance Imaging (MRI) and history of headache, memory dysfunction, depression and treated for convulsion ictus for 13 years (Figure 3).
RESULTS
All of the volunteers answered a clinical questionnaire that assessed their medical history, in order to exclude history of neuropsychiatric disorders. A brief neuro-psychological screening was performed to exclude pos-sible cognitive deicits, mainly those involving executive function, attention and working memory (Table 1). he Figure 3. MRI and brain perfusion quantification of case 2.
SGYA group had a chromatographic average of 97.5% of binding of 99mTc-ECD, and the average count of the ra-dioactivity per acquisition was 6.5 million counts.
he quantitative representation of the regional neu-ronal perfusion activity, which is localized to the gray matter of the brain, is provided by a color scale that is Table 1. Neuropsychological testing of the SGYA group.
Routine cognitive screening for cerebral perfusion results of volunteers – group 18-30 years
N Name Gender
Age (years)
Educational level (years of
schooling)
Digit Symbol Scaled score
(FC)
Digit Span Scaled score
(FC)
Focused Attention
(FC)
Stroop Test III (FC)
Verbal Fluency (F,A,S)
(FC)
1 R.S.T. M 19 11 8 (MI) 9 (M) 70% (MS) 19”59 (+0,3 SD) 30 (–1,0 SD)
2 A.J.D.A. M 21 10 8 (MI) 6 (MI) 90% (S) 23”25 (–0,4 SD) 34 (–0,6 SD)
3 B.B.B.D. M 19 11 8 (MI) 7 (MI) 85% (S) 19”87 (+0,3 SD) 41 (0 SD)
4 G.G.S.D. M 21 11 8 (MI) 11 (M) 75% (MS) 20”75 (+0,1 SD) 30 (–1,0 SD)
5 C.S.A. F 30 7 6 (MI) 6 (MI) 35% (MI) 24”69 (0 SD) 30 (–0,7 SD)
6 G.C.B. F 21 13 9 (M) 11 (M) 85% (S) 14”37 (+1,3 SD) 33 (–1,0 SD)
7 G.S.J. F 18 8 6 (MI) 6 (MI) 20% (MI) 26”56 (–1,0 SD) 26 (–1,0 SD)
8 V.S.S. F 24 11 9 (M) 8 (MI) 85% (S) 20”30 (+0,2 SD) 34 (–0,6 SD)
9 V.M.A. F 30 16 11(M) 7 (MI) 20% (MI) 15”53 (+1,0 SD) 54 (+0,8 SD)
10 M.V.D.M. M 22 10 7 (MI) 8 (MI) 80% (MS) 24”94 (–0,7 SD) 30 (–1,0 SD)
11 M.F.A. M 20 10 9 (M) 10 (M) 80% (MS) 21”69 (–0,1 SD) 38 (–0,2 SD)
12 R.P.B. M 20 11 8 (MI) 8 (MI) 95% (S) 23”43 (–0,4 SD) 30 (–1,0 SD)
13 M.H.S.C. M 20 11 9 (M) 7 (MI) 90% (S) 20”75 (+0,1 SD) 37 (–0,3 SD)
14 W.D. M 22 14 8 (MI) 6 (MI) 60% (M) 25”93 (–0,9 SD) 41 (–0,3 SD)
15 T.R.N. M 23 14 10 (M) 14 (MS) 80% (MS) 15”47 (+1,1 SD) 45 (0 SD)
16 J.C.O.N. M 20 11 11 (M) 6 (MI) 85% (MS) 18”94 (+0,4 SD) 55 (+1,3 SD)
17 J.M.G. M 19 11 11 (M) 8 (MI) 85% (S) 26”75 (–1,0 SD) 60 (+1,8 SD)
18 S.L.P.C. F 24 15 8 (MI) 10 (M) 65% (MS) 16”97 (+0,8 SD) 46 (+0,1 SD)
19 R.K.N. F 26 14 12 (MS) 12 (MS) 65% (MS) 16”81 (+0,8 SD) 47 (+0,2 SD)
20 R.M.G. F 21 11 7 (MI) 6 (MI) 85% (MS) 27”02 (–1,0 SD) 36 (–0,4 SD)
21 L.J.L. F 25 16 10 (M) 7 (MI) 70% (MS) 24”10 (–0,5 SD) 49 (+0,4 SD)
22 F.L. F 24 16 10 (M) 11 (M) 40% (M) 21”06 (0 SD) 40 (–0,4 SD)
23 G.S.S. F 25 10 10 (M) 10 (M) 50% (M) 24”94 (–0,7 SD) 30 (–1,0 SD)
24 S.S.F.B. F 25 8 8 (MI) 6 (MI) 70% (MS) 25”46 (0,8 SD) 26 (–1,0 SD)
25 Q.L.S. F 27 15 10 (M) 6 (MI) 75% (MS) 19”28 (–0,4 SD) 35 (–0,9 SD)
26 L.M.P. F 21 14 11 (M) 6 (MI) 35% (MI) 23”03 (–0,3 SD) 33 (–1,0 SD)
27 J.V.G. F 25 10 6 (MI) 6 (MI) 20% (MI) 26”50 (–1,0 SD) 32 (–0,8 SD)
28 A.C.R. F 26 11 8 (MI) 10 (M) 35% (MI) 25”35 (–0,7 SD) 30 (–1,0 SD)
29 B.B. F 27 18 10 (M) 8 (MI) 45% (M) 23”98 (+0,1 SD) 33 (–1,0 SD)
30 R.N. F 30 16 8 (MI) 7 (MI) 20% (MI) 22”19 (+0,3 SD) 45 (0 SD)
based on the normalized average values of the SGYA scans. Our study with 99mTc-ECD showed that for this ra-diotracer, the mean brain perfusion value was 74.67%, with a standard deviation of 3.31 in the SGYA group. herefore, if a test measurement changes within 2 SD of this value (between 68.05% and 81.29%), the event can be classiied as normal. Such normal results are rep-resented with gray coloring in the three-dimensional images. For deviations above the average normal range, hyperperfusion occurs (represented by colors ranging from red to white), which represents neuronal hyperac-tivity. Conversely, hypoperfusion is represented by col-ors that range from light green to dark blue to black and suggest a progressive reduction in neuronal activity in the topography of the cortical cerebral gray matter.
When we selected the bilaterally-paired Brodmann’s areas to represent the average brain perfusion of the SGYA group, we noted that a small number of neuro-functional segments were more than 2 SD away from the mean. We believe that this result is due to statisti-cally small deviations from normal that represent a physiological variant. We also observed relative hy-perperfusion in the primary visual cortex and relative hypoperfusion in the inferior-mesial and dorsal-lateral temporal lobes (hippocampi and parahippocampal gyri) and in the middle area of the cingulate gyrus.
When the cerebellum was used as a reference in the functional normalization step (Group I), we found an average perfusion value of 78.03%, with a standard deviation of 4.07. his group had two volunteers with variations that were greater than one standard
devia-tion away from the mean. When the cerebral cortex was used as a reference (Group II), the mean perfusion was 71.01%, with a standard deviation of 4.66. We observed a 9% perfusion decrease between Groups I and II, when the functional reference was changed.
When we only analyzed Brodmann’s area 44 (Broca’s area, which is responsible for implementation of lan-guage) in the 30 SGYA volunteers, we found that the relative quantiication of the brain activity, with the cer-ebellum and cortex as references, reproduced the values shown above. he results of this analysis also conirmed the 9% variation between groups of relative perfusion when the reference was switched from the cerebellum to the cerebral cortex (Table 2 ).
We observed a greater level of uptake in the occipital lobe and a lower level of uptake in the basal ganglia in both groups. his diference may have been related to the physiologic distribution of 99mTc-ECD and also due to the physical characteristics of the image.
DISCUSSION
Brain SPECT has been used in the ield of nuclear medi-cine for diagnosis, prognosis and risk stratiication. his scintigraphic technique has been shown to be important for vascular / neurodegenerative / psychiatric diseases, epilepsy, head trauma, malignant tumors, movement disorders, and drug addiction, as reported by Camargo and Heuser et al.11-13
he normal distribution of 99mTc-ECD radiotracer in the brain is symmetric, with higher levels of activity in the occipital region and lower levels of activity in the tempo-ral lobe and the posterior portion of the cingulate gyrus.3 he physical characteristics of 99mTc-ECD are such that it is both neutral and lipophilic, which enables it to cross the blood-brain barrier and allows for the analysis of brain activity. he latter efect is possible because of this tracer’s high intraneuronal concentration in gray matter compared to that in white matter.2,14 Further-more, this tracer’s brain blood low is similar to the bio-distribution of the gas 133Xe, which is between 20 and 80 ml/min/100g of brain tissue.8
he concentration and removal of 99mTc-ECD from brain tissue depends on several factors. hese factors include the intracellular metabolic state, speciically the ability of the neuron to maintain 99mTc-ECD retention, the neural population density, blood supply, as well as the presence and concentration of esterases in the cell membrane.15,18
Many studies have demonstrated the diferences be-tween HMPAO and 99mTc-ECD, which are both markers of brain perfusion.3,7,18,19 With 99mTc-ECD, the reports
Table 2. Selective uptake between organs and groups.
Areas
Groups
U4 Cerebellum
U6 EB*
Percentage difference
Caudate Nucleus 55.92 50.98 11.62
Cerebellum 75.71 68.53 8.59
Cerebral Cortex 75.72 68.80 8.58
Frontal Lobe 72.84 66.20 8.92
Occipital Lobe 81.12 73.65 8.01
Parietal Lobe 74.34 67.58 8.74
Putamen 75.12 68.33 8.65
Temporal Lobe 72.31 65.54 8.99
Thalamus 67.88 62.46 9.58
Average of whole areas 72.33 65.79 –
Difference between groups – – 9.08
point to a greater concentration because of neuronal density at the occipital and parietal cortices.3,18
his method uses the quantiication model that was used in the present work and also used by Darcourt et al.14 hese authors demonstrated that the data analyzed using NeuroGam, as compared to the other systems, for slices analysis and traditional qualitative images of 99mTc-ECD activity in the brain cortex, were better.
his software used data from the traditional SPECT images in axial cuts, and the volume in which it was project-ed was the standardizproject-ed anatomical model of Talairach.10 For the process of functional normalization, the cer-ebellum is typically chosen as a reference. he reasons for this choice are based on the topography of the body, which often difers between individuals and can difer from the standard anatomical model. Additionally, this region is chosen because of its high blood supply, neu-ronal density and neuro-functional stability compared to other structures.18 In cases of cerebellar disease, it is important to consider using another reference.
A quantiied assessment of the functional normal-ization by the cerebellum (Group I) revealed an average perfusion value of 78.03%, with a standard deviation of 4.07. Two volunteers from this group had average val-ues that were slightly greater than one standard devia-tion away from the mean. When the cortex was used as a reference (Group II), the average perfusion value was 71.01%, with a standard deviation of 4.66. hus, switch-ing the functional reference decreased the average per-fusion between groups by 9%, with a 95% conidence interval of 7-11%. When considering only Brodmann’s area 44, we conirmed this diference of 9%, which when comparing between groups, was statistically signiicant (p<0.001). herefore, one may obtain inaccurate results
when analyzing the neuro-functionality of this seg-ment. As a result, the evaluation of brain perfusion in-dices with relative quantiications and z-score measures should be accompanied by additional studies, such as neuroanatomical Computed Tomography (CT) or MRI.
More recently, 18F-FDG studies were compared with SPECT studies for the early diagnosis of Alzheimer’s dis-ease.15 Both techniques used isotropic model voxels, a normal database, anatomic normalization, data recording and statistical tests. he results of these two techniques were similar. hese techniques can now serve as impor-tant predictors of the development of a mild cognitive decline by identifying the areas of hypometabolism in the precuneus, posterior cingulate and parietal cortex.15,20 In conclusion, the present study suggests normal cortical perfusional values for a group of young asymp-tomatic volunteers, utilizing 99mTc-ECD with the pro-posed standard clinical protocol.
It is evident that further quantiied neuro-SPECT studies with a population-speciic database and suit-able tools for the analysis of correlations will provide an improved understanding of the behavior of neuro-functional structures and the brain. his technique will help lead the way towards a new frontier in contempo-rary neuropsychiatry and neuroimaging, both of which are yet to be explored.21-23
We also believe that the little that we have learned in this area of neuroscience points to a large variability in the dominance of brain regions and in the plasticity of neuronal functions. herefore, it may be inappropri-ate to assume that anatomical and functional similari-ties exist among individuals in various higher cognitive functions, such as judgment, memory, language, calcu-lation, orientation and behavior.
REFERENCES
1. Migneco O, Darcourt J, Benoliel J, et al. Computerized localization of brain structures in single photon emission computed tomography us-ing a proportional anatomical stereotactic atlas. Comput Med Imagus-ing Graph 1994;18:413-22.
2. Morano GN, Seibyl JP. Technical overview of brain SPECT imaging: improving acquisition and processing of data. J Nucl Med Technol 2003;31:191-195.
3. Koyama M, Kawashima R, Ito H, et al. SPECT imaging of normal sub-jects with technetium-99m-HMPAO and technetium-99m-ECD. J Nucl
Med. 1997;38:587-592.
4. Obrist WD, Thompson HK, King CH, Wang HS . Determination of regional cerebral blood flow by inhalation of 133-xenon. Circ Res 1967;20:124-135.
5. Celsis P, Goldman T, Henriksen L, Lassen NA. A method for calculating regional cerebral blood flow from emission computerized tomography of inert gas concentrations. J Comput Assist Tomogr 1981;5:641-645. 6. Holman BL, Helmann RS, Goldsmith SJ, et al. Biodistribution, dosim-etry, and clinical evaluation of technetium-99m ethyl cysteinate dimer in normal subjects and in patients with chronic cerebral infarction. J Nucl Med 1989;30:1018-24.
7. Jacquier-Sarlin MR, Polla BS, Slosman DO. Cellular basis of ECD brain retention. J Nucl Med 1996;37:1694-1697.
8. Devous MD. SPECT instrumentation, radiopharmaceuticals and techni-cal factors: functional cerebral SPECT and PET imaging. In: Van Heer-tum RL, Tikofsky RS, eds. Functional Cerebral SPECT and PET Imag-ing, 4th ed. Philadelphia: Lippincott Williams & Wilkins; 2009:3-22.
9. Tumeh PC, Alavi A, Houseni M, et al. Structural and functional imag-ing correlates for age-related changes in the brain. Semin Nucl Med 2007;37:69-87.
10. Talairach J, Tournoux P. Co-planar Stereotactic Atlas of the Human Brain. Stuttgart: Thieme; 1988.
11. Camargo EE. Brain SPECT in neurology and psychiatry. J Nucl Med 2001;42:611-623.
12. Heuser G, Mena I. Neurospect in neurotoxic chemical exposure dem-onstration of long-term functional abnormalities. Toxicol Ind Health 1998;14:813-27.
13. Miller BL, Ikonte C, Ponton M, et al. A study of the Lund-Manchester research criteria for frontotemporal dementia: clinical and single-photon emission CT correlations. Neurology 1997;48:937-42.
system state of the art methodology. Médecine nucléaire 2002;26:605-613.
15. Minoshima S, Frei KA, Koeppe RA, Foster NL, Kuhl DE. A diagnostic approach in Alzheimer’s disease using three-dimensional stereotactic surface projections of fluorine-18-FDG PET. J Nucl Med 1995;36:1238-1248.
16. Papazyan JP, Delavelle J, Burkhard P, et al. Discrepancies between HMPAO and ECD SPECT imaging in brain tumors. J Nucl Med 1997;38:592-596.
17. Schiepers C, Verbruggen A, Casaer P, De Roo M. Normal brain perfu-sion pattern of technetium-99m ethilcysteinate dimer in children. J Nucl Med 1997;38:1115-1120.
18. Oku N, Matsumoto M, Hashikawa K, et al. Intra-individual differences between technetium-99m-HMPAO and technetium-99m-ECD in the
nor-mal medial temporal lobe. J Nucl Med 1997;38:1109-1111.
19. Mena FJ, Mena I, Alamos F, et al. Children normal HMPAO brain SPECT.
Alasbimn Journal 1998;1(2):article n. AJ01-3. http://www.alasbimnjour-nal.cl/revistas/2/index.html
20. Matsuda H. Role of neuroimaging in Alzheimer’s disease, with emphasis on brain perfusion SPECT. J Nucl Med 2007;48:1289-1300. 21. Mena I, Correa R, Nader A et al. Bipolar affective disorders:
assess-ment of functional brain changes by means of Tc99m HMPAO Neu-roSPECT. Alasbimn Journal 2004;6(23):article n° AJ23-2. http://www2. alasbimnjournal.cl/alasbimn/CDA/sec_b/0,1206,SCID%253D6213,00. html
22. Mena I, Prado C, Correa M. Comparative functional study of two psychiatric pathologies by means of BrainSPECT Tc99 HMPAO. Ma-jor depression and borderline personality disorder. Alasbimn Journal. 2001;1(3): article nº AJ11-1. http://www.alasbimnjournal.cl/revistas/11/ mena.html