Skeletal displacements following
mandibular advancement surgery:
3D quantitative assessment
Alexandre Trindade Simões da Motta*, Felipe de Assis Ribeiro Carvalho**, Lúcia Helena Soares Cevidanes***, Marco Antonio de Oliveira Almeida****
Objective: To evaluate changes in the position and remodeling of the mandibular rami, condyles and chin with mandibular advancement surgery through the superimposition of
3D Cone-Beam Computed Tomography (CBCT) models. Methods: This prospective
ob-servational study used pre-surgery and post-surgery CBCT scans of 27 subjects presenting skeletal Class II with normal or horizontal growth pattern. An automatic technique of cra-nial base superimposition was used to assess positional and/or remodeling changes in ana-tomic regions of interest. Displacements were visually displayed and quantified by 3D color maps. Descriptive statistics consisted of mean values, standard deviations and minimum/ maximum displacements. Changes greater than 2 mm were considered clinically relevant, and a categorization was done. Positive and negative displacements showed each region di-rectional tendency. To test if displacements in anatomic regions were associated with each other, Pearson correlation coefficients were used under a 95% significance level. Results: The chin moved anterior-inferiorly 6.81±3.2 mm on average and the inferior portion of the rami moved laterally (left: 2.97±2.71 mm; right: 2.34±2.35 mm). Other anatomic regions showed <2 mm mean displacements, but with evident individual variability. Significant sta-tistical correlations were positive and moderate. The condyles, posterior border and superior portion of the rami showed a bilateral correlation, and the superior and inferior portion of the rami an ipsilateral correlation. Conclusion: This 3D method allowed clear visualization and quantification of surgery outcomes, with an anterior-inferior chin displacement and a lateral movement on the inferior portion of the rami, but with considerable individual vari-ability in all the evaluated anatomic regions.
Abstract
Keywords: Cone-Beam Computed Tomography. Image processing, Computer-assisted. Surgery, computer-assisted. Computer simulation. Orthodontics. Surgery, oral.
* PhD, MSc and Specialist in Orthodontics (UERJ). PhD Scholarship CAPES 382705-4 at University of North Carolina at Chapel Hill (UNC). Professor, Depart-ment of Orthodontics, Fluminense Federal University (UFF), Niterói, Brazil.
** MSc and Specialist in Orthodontics (UERJ). Specialist in Oral Radiology (ABORJ). PhD student in Orthodontics (UERJ) and Visiting Scholar (UNC). *** PhD in Oral Biology (UNC). Assistant Professor, Department of Orthodontics, University of North Carolina at Chapel Hill.
IntROduCtIOn
Bilateral sagittal split ramus osteotomy (BSSO) is frequently performed in cases of man-dibular advancement surgery. Despite its popular-ity, post-surgical instability due to displacement of the condyle from its seated position in the glenoid fossa in the three planes of space (ie, sagittal, verti-cal, and transverse) remains an area of concern.1
A post-surgical superior and posterior dis-placement of the condyle can happen with sur-gery, and it has been described to be correlated to the amount of mandibular advancement.2-5 The
association of condylar displacement and treat-ment relapse has been described,5,6 and the
con-trol of the proximal segment was considered to be the most important aspect in the stability of this surgical modality.7
Assessment of surgical treatment outcomes us-ing Cone-Beam Computed Tomography (CBCT) has the potential to unravel the interactions be-tween the dental, skeletal and soft tissue com-ponents that contribute to treatment response.8
The use of 3-dimensional (3D) superimposition tools allows the identification and quantification of bone displacement and remodeling.9,10
Previous studies9,11-14 have used the 3D
vir-tual models superimposition technique to assess post-surgical outcomes and stability in Class III patients, but the post-surgical outcomes of Class II correction have not been evaluated by this method.
The purpose of the present study was to tri-dimensionally assess surgical displacements of the condyles, rami (superior, inferior and posterior) and chin after mandibular advancement, testing directional correlation between them.
MethOds
For this prospective observational study, twenty-seven patients (9 males and 18 females; mean age 30.04±13.08 years) who were submit-ted to orthognathic surgery at the UNC Memo-rial Hospital, with an attending resident from the
Department of Oral and Maxillofacial Surgery, were recruited. All patients underwent orth-odontic treatment and had mandibular advance-ment surgery by means of a bilateral sagittal split osteotomy (BSSO). Nine of them also had genio-plasty as an adjunctive procedure. CBCT scans were taken before surgery and after surgery at splint removal with the NewTom 3G (Aperio Services LLC, Sarasota, FL, 34236). Two of those patients had at least 1 scan done with the New-Tom 9000 (Aperio Services LLC, Sarasota, FL) which has a smaller field of view (FOV), there-fore, the chin was not included.
All patients had skeletal discrepancies severe enough to justify an orthognathic surgery. Patients with anterior open bite were excluded, so that the entire sample presented a skeletal Class II with normal or horizontal growth pattern. Lip-palatal fissures, problems resulting from trauma or degen-erative conditions like rheumatoid arthritis were also excluded. Informed consent was obtained from all subjects. All patients agreed in having CBCTs in different phases of treatment as it was described in the experimental protocol approved by UNC ethical committee.
The imaging protocol involved a 36-second head CBCT scanning with a field of view of 230 x 230 mm. All CT scans were acquired with the patient in centric occlusion. The 3D models were constructed from CBCT images with a voxel di-mension of 0.5x0.5x0.5 mm. Image segmentation of the anatomic structures of interest and the 3D graphic rendering were done by using the ITK-SNAP15 open-source software
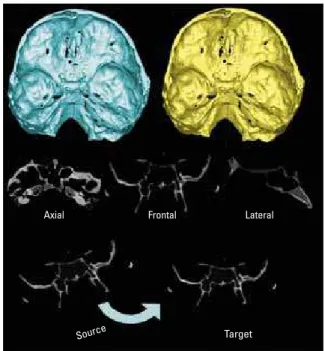
(http://www.itk-snap.org/). Virtual models corresponding to the cranial bases (Fig 1); condyles (right and left); pos-terior rami (right and left); superior rami (right and left); inferior rami (right and left) and chin were built (Fig 2).
Axial Frontal
Target
Source
Lateral
used through the IMAGINE free software (devel-oped by NIH and modified at UNC, http://www.
ia.unc.edu/dev/download/imagine/index.htm).9
The software compares both images using the in-tensity of gray scale for each voxel of the region, so that the pre-surgical cranial base was used as reference for the superimposition of post-surgery models (Fig 1).
Following the registration step, all the re-ori-ented virtual models, originally saved in a .GIPL format were converted to a SGL open
inven-tor format (IV) by the free software VOL2SURF (http://www.cc.nih.gov/cip/software.html), allow-ing the quantitative evaluation of greatest displace-ments using the CMF application software (Mau-rice Müller Institute, Bern, Switzerland).16
The previously proposedcolor maps method17
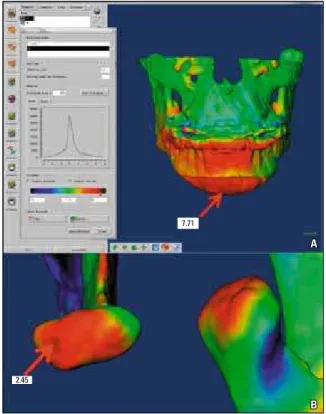
was used to generate the closest-point distances between the surfaces. The CMF software calcu-lates thousands of color-coded surface distances in millimeters between before and after-treatment 3D models by using surface triangles at two dif-ferent time points, so that the difference between the two surfaces at any location can be quantified. The isoline (contour line) tool was recently in-cluded in the method and considered a technique improvement, since it is used to quantitatively measure the greatest displacement (mm) for the specific anatomic regions of interest (Fig 3).
The quantitative changes were visualized using color maps, which can be used to indicate inward (blue) or outward (red) displacement between superimposed structures. An absence of change is indicated by the green color code. For example, in mandibular advancement surgery, the forward chin displacement would be shown in a red color code; in mandibular set-back surgery the chin sur-faces would be shown in a blue color code.
Semi-transparency constitutes another method used in this study for visualization of the location and direction of skeletal displacements, with one of the models in an opaque view superimposed to an-other in a partially transparent view. This method for quantitative change exhibition at multiple loca-tions has been validated and used since 2005.9
Positive values indicated an anterior-inferior displacement of the chin while negative values in-dicated a posterior-superior displacement. For the condyles, positive values represented a posterior-superior displacement and negative values indi-cated anterior-inferior movements. For the rami posterior borders, positive values represented pos-terior displacements and negative values indicated anterior displacements.
FIGURE 1 - Registration of CBCTs generated 3D virtual models using the cranial base surface through a fully automated voxel-wise method. Pre-surgery cranial base was used as a reference (source) for the post-surgery one (target) which were relocated along with the virtual maxillary and mandibular models.
2.45
7.71
A
B
The lateral portions of the mandibular rami were divided in two parts (superior and inferior) aiming to identify the complex torque or me-dial/lateral movement of this region. This way, positive values represented a lateral displace-ment of the rami, and negative values showed a medial displacement. When both portions of the ramus showed displacements in opposite di-rections, it indicated a torque movement of this anatomic region.
To assess surgical outcomes, the largest dis-placements between pre-surgery/post-surgery (splint-removal) were computed for all anatomic regions of interest.
To check the reproducibility of greatest dis-placements’ measurements done by the iso-lines, 10 randomly selected superimpositions were measured twice, at a 2-week interval and
compared through intraclass correlation coef-ficient (P <0.001). The agreement between the measurements was high for all anatomic regions: chin (r=0.98); condyles (r=0.92); posterior bor-ders (r=0.97); superior rami (r=0.97) and infe-rior rami (r=0.95).
Descriptive statistics consisting of mean val-ues, standard deviations and minimum/maximum displacements were done. Since changes greater than 2 mm can be considered clinically relevant, a categorization shows the number of patients that had displacements greater than 2 mm, between 2 mm and -2 mm and smaller than -2 mm, along with the mean values, standard deviations, and minimum and maximum values for each group. Descriptive statistics was divided in positive and negative displacements according to each region directional tendency.
To test if displacements in anatomic regions were associated with each other, i.e., if changes at the condyles and/or ramus were associated with changes at the chin, the Pearson correlation coef-ficients were used under 95% significance level.
Results
Mean displacements of all the evaluated ana-tomic regions showed that the chin and the infe-rior portion of the rami presented changes greater than 2 mm, which are considered clinically rele-vant. The chin moved anterior-inferiorly 6.81±3.2 mm on average and the inferior portion of the rami moved laterally 2.97±2.71 mm on the left side and 2.34±2.35 mm on the right side (Table 1 and Fig 4).
All the other anatomic regions showed mean displacements smaller than 2 mm, but the indi-vidual variability was evident, with the maximum displacements ranging outside the 2 mm limit (Table 1 and Fig 5).
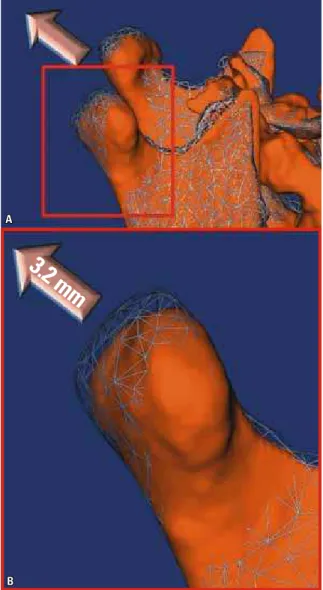
Condylar maximum displacements, for exam-ple, ranged between -3.7 mm and +3.2 mm. Fig-ure 6 shows a patient who underwent a condyle displacement of +3.2 mm.
FIGURE 3 - The ISOLINE tool allowed the identification of the greatest dis-placement of a specific anatomic region. A) Example of a 7.71 mm chin advancement between pre-surgery and after splint removal (surgical outcomes). B) Right condyle displaced 2.45 mm posterior-superiorly after surgery.
2.45
A B 6.8
3.8 2.3
0 20
14.8 14.8
3.7 3.7 11.1
7.4 3.7
40 60 80 100
11.1
100.0 11.1
22.2 18.5 25.9
59.3 29.6
70.4
0.0
0.0
20 %
x < -2 mm
x > 2 mm
Anatomic Regions
Left Inferior Ramus
Right Inferior Ramus Left Superior Ramus
Right Superior Ramus
Right Posterior Border
Left Posterior Border
Chin Right Condyle
Left Condyle
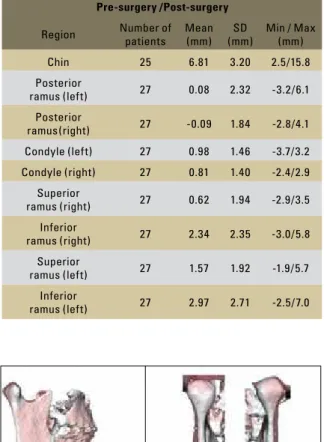
TABLE 1 - Descriptive statistics of surgical displacements. Considering changes greater than 2 mm as
being clinically relevant, it is possible to quan-tify the number of anatomic regions that dis-placed significantly. As one should expect, the chin had a displacement greater than 2 mm with surgery in all the patients (n=25). Look-ing at the posterior border of the rami (right and left, n=54), 8 had displacements smaller than -2 mm and 6 greater than 2 mm. For the condyles (right and left, n=54) 2 showed dis-placements smaller than -2 mm and 11 greater than 2 mm (Table 2).
The superior portion of the rami (right and left, n=54) underwent displacements smaller than -2 mm in 3 patients and greater than 2 mm in 15. After the chin, the inferior portion of the rami was the region with the most rel-evant changes, showing displacements smaller than -2 mm in 3 cases and greater than 2 mm in 35 (right and left, n=54) (Table 2).
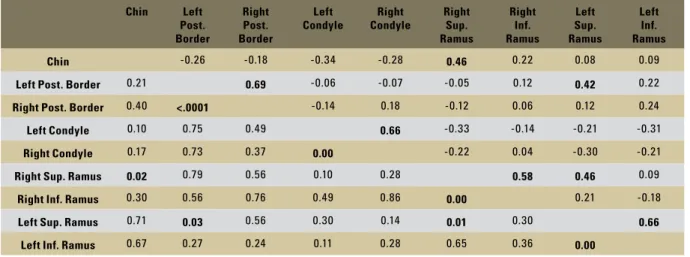
Correlations of displacements between the evaluated anatomic regions by means of a Pear-son correlation coefficient showed that all the significant statistical correlations were posi-tive and moderate (Table 3). The chin anterior displacement was correlated with the lateral movement of the superior portion of the right ramus (r=0.46, p=0.02).
FIGURE 4 - A) Semi-transparent visualization showing a 6.8 mm mean mandibular advancement measured at the chin. B) Proximal segment lateral displacement after mandibular advancement surgery. The sagittal osteotomy probably acted like a wedge and the condyles as a fulcrum, causing the inferior rami to be the anatomic region with the greatest mean displacement after the chin.
Pre-surgery /Post-surgery
Region Number of
patients Mean
(mm) SD (mm)
Min / Max (mm)
Chin 25 6.81 3.20 2.5/15.8
Posterior
ramus (left) 27 0.08 2.32 -3.2/6.1
Posterior
ramus(right) 27 -0.09 1.84 -2.8/4.1
Condyle (left) 27 0.98 1.46 -3.7/3.2
Condyle (right) 27 0.81 1.40 -2.4/2.9
Superior
ramus (right) 27 0.62 1.94 -2.9/3.5
Inferior
ramus (right) 27 2.34 2.35 -3.0/5.8
Superior
ramus (left) 27 1.57 1.92 -1.9/5.7
Inferior
ramus (left) 27 2.97 2.71 -2.5/7.0
A
B
3.2 m
m
TABLE 2 - Descriptive statistics of surgical displacements: number ofpatients showing displacements greater than 2 mm, between 2 mm and -2mm and smaller than -2 mm, along with the mean values, standard deviations, and minimum/maximum values for each group.
PRE-SURGERY / SPLINT REMOVAL
Chin (n=25)
N Mean SD Min Max
x < -2 0 - - -
--2 ≤ x ≤ 2 0 - - -
-x > 2 25 6.81 3.20 2.50 15.80
Left Posterior Border (n=27)
N Mean SD Min Max
x < -2 4 -3.00 0.22 -3.20 -2.70
-2 ≤ x ≤ 2 20 -0.05 1.15 -2.00 1.60
x > 2 3 5.03 1.29 3.60 6.10
Right Posterior Border (n=27)
N Mean SD Min Max
x < -2 4 -2.40 0.32 -2.80 -2.10
-2 ≤ x ≤ 2 20 -0.13 1.27 -2.00 1.40
x > 2 3 3.23 1.03 2.10 4.10
Left Condyle (n=27)
N Mean SD Min Max
x < -2 1 -3.70 - -3.70 -3.70
-2 ≤ x ≤ 2 20 0.78 1.00 -1.40 1.90
x > 2 6 2.45 0.40 2.10 3.20
Right Condyle (n=27)
N Mean SD Min Max
x < -2 1 -2.40 - -2.40 -2.40
-2 ≤ x ≤ 2 21 0.56 1.10 -1.80 1.80
x > 2 5 2.50 0.26 2.20 2.90
Right Superior Ramus (n=27)
N Mean SD Min Max
x < -2 3 -2.57 0.31 -2.90 -2.30
-2 ≤ x ≤ 2 17 0.26 1.35 -1.90 2.00
x > 2 7 2.86 0.34 2.60 3.50
Right Inferior Ramus (n=27)
N Mean SD Min Max
x < -2 2 -2.65 0.49 -3.00 -2.30
-2 ≤ x ≤ 2 9 0.70 1.38 -1.80 2.00
x > 2 16 3.89 1.01 2.60 5.80
Left Superior Ramus (n=27)
N Mean SD Min Max
x < -2 0 - - -
--2 ≤ x ≤ 2 19 0.65 1.40 -1.90 2.00
x > 2 8 3.76 0.97 3.00 5.70
Left Inferior Ramus (n=27)
N Mean SD Min Max
x < -2 1 -2.50 - -2.50 -2.50
-2 ≤ x ≤ 2 7 -0.30 1.44 -1.30 1.90
x > 2 19 4.46 1.33 2.30 7.00
FIGURE 6 - A) Mesh-transparencies visualization showing a condyle displacement of 3.2 mm after surgery. B) Close-up view of the displaced condyle.
The posterior movement of the left and right ramus posterior border showed correla-tion (r=0.69, p<0.0001). The posterior move-ment of the left ramus posterior border also correlated to the superior portion of the ramus on the same side (r=0.42, p<0.03).
TABLE 3 - Pearson correlation coefficients for the surgical displacements between all anatomical regions. The upper right part of the table shows r values and the lower part p values. Statistically significant values are in bold.
(r=0.66, p=0.0002). The superior portions of the rami were also correlated between sides (r=0.46, p=0.0148).
On both sides, the superior and inferior portion of the ramus were correlated, showing a lateral movement tendency (right: r=0.58, p=0.0016; left: r=0.66, p=0.0002).
dIsCussIOn
In conventional cephalometrics, the cranial base often is used for superimpositions because it shows minimal changes after neural growth is completed. In 3D image analysis, registra-tion can be based on choice of stable surfaces or landmarks. While landmark location in 2D is hampered by identification of hard and soft tissues on x-rays due to the superimposition of multiple structures, locating 3D landmarks on complex curving structures is significantly more difficult.19 There are no suitable operational
def-initions for craniofacial landmarks in the three
planes of space (coronal, sagittal, and axial). In the context of facial changes, superimposition should not rely on landmark identification nor on best-fit techniques on structures that may
have changed between image acquisitions.18
The major strength of the superimposition method used in this study is that registration does not depend on the precision of the 3D sur-face models. The cranial base models are only used to mask anatomic structures that do not change with growth and treatment. The regis-tration procedure actually compares voxel by voxel of gray level CBCTs images, containing only the cranial base, and calculates the rotation and translation parameters between the two time-point images.
Regional superimposition in the cranial base does not completely define the movement of the mandible relative to the maxilla9,10,20-23.Previous
studies20,22,24-26 revealed that relative
displace-ment of mandibular and maxillary skeletal and
Chin Left Post. Border
Right Post. Border
Left Condyle
Right Condyle
Right Sup. Ramus
Right Inf. Ramus
Left Sup. Ramus
Left Inf. Ramus
Chin -0.26 -0.18 -0.34 -0.28 0.46 0.22 0.08 0.09
Left Post. Border 0.21 0.69 -0.06 -0.07 -0.05 0.12 0.42 0.22
Right Post. Border 0.40 <.0001 -0.14 0.18 -0.12 0.06 0.12 0.24
Left Condyle 0.10 0.75 0.49 0.66 -0.33 -0.14 -0.21 -0.31
Right Condyle 0.17 0.73 0.37 0.00 -0.22 0.04 -0.30 -0.21
Right Sup. Ramus 0.02 0.79 0.56 0.10 0.28 0.58 0.46 0.09
Right Inf. Ramus 0.30 0.56 0.76 0.49 0.86 0.00 0.21 -0.18
Left Sup. Ramus 0.71 0.03 0.56 0.30 0.14 0.01 0.30 0.66
dental components is critical because the result-ing information may differ from conclusions for-mulated from the cranial base superimposition.
Although a 3D superimposition study pres-ents additional information when compared to traditional cephalometric methods, analysis of the 3D morphology poses methodological chal-lenges. Current methods, including methods used in commercially available software (Geomagic Studio, Geomagic U.S. Corp, Research Triangle Park, NC, 27709 and Vultus, 3dMD, Atlanta, GA, 30339), calculate the closest point between two surfaces. However, the closest point is not neces-sarily the corresponding point in both surfaces.
The quantification utilizing isolines in this study determined the absolute maximum change in the anatomic region, where positive or nega-tive values based on operator observation aided the assessment of the direction of displacement. For example, positive values at the chin indicate an anterior-inferior displacement, but it’s not pos-sible to distinguish how anterior and how inferior the displacement is. A method that quantifies vec-torial displacements is being developed at UNC, which will be able to analyze shape correspon-dence between two structures, and in the future will improve directional evaluation. Another issue is that differences between the surfaces are not only a result of displacement as this method sug-gests, there may occur a remodeling process too.
It has being advocated in the literature27 that a
precise repositioning of the condyles during sur-gery would ensure stability of the surgical results and reduce temporomandibular joint noxious effects. It might improve postoperative mastica-tory function, but the extent of condylar change that is compatible with normal function post-surgically is still unknown. In this study, mild mean condylar displacements with surgery (left 0.98±1.46 mm and right 0.81±1.40 mm) were observed, but some patients experienced an im-portant condylar displacement up to 3.7 mm an-terior-inferiorly and 3.2 mm posterior-superiorly.
The use of devices for preserving the preop-erative position of the mandibular condyle dur-ing bilateral sagittal split osteotomy has been
proposed, but it was concludedthat there is no
scientific evidence to support its routine use in orthognathic surgery, which makes the condylar positioning a critical procedure to be handled.28
With the increased use of rigid fixation, there has been a decrease in the amount of re-lapse but an increase in the amount of force transmitted to the condyles. Gradual advance-ment of the mandible by distraction osteogen-esis slowly overcomes the soft-tissue envelope and may decrease the amount of force exerted on the condyles. Using an animal model to measure the magnitude of pressure associated with immediate versus gradual mandibular ad-vancement, it was found that the superior joint space fluid pressures increased and remained elevated over a 5-week period after immediate advancement, contrasting with the results of gradually advancement of the mandible where the pressures were elevated but returned to near baseline prior to the activation the follow-ing day. Based on these findfollow-ings, the authors could conclude that it is likely that gradual advancement of the mandible by distraction osteogenesis produces less force and causes less condylar resorption than large mandibular advancement stabilized with rigid fixation, but further studies are needed to compare
meth-ods for mandibular advancement.29
This study found that the inferior portion of the rami was the region with the most rel-evant displacements after the chin, showing displacements smaller than -2 mm in just 3 rami of a total of 54 and greater than 2 mm in 35 (right and left). The average lateral dis-placement was 2.97±2.71 mm on the left side and 2.34±2.35 mm on the right side. These re-sults agree with another study1 that found an
BSSO using miniplates for fixation. The sum of mean displacements for right and left sides of the inferior portion of the rami was 5.28 mm in the present study, very close to the results of the study cited above1 even with the different
measurement methods.
Besides the chin and the inferior portion of the rami, all the other anatomic regions showed mean displacements smaller than 2 mm, but with the maximum displacements ranging be-yond the clinical acceptable limit. Relevant dis-placements of distal and proximal mandibular segments and surgically induced posterior con-dylar displacement seem to be important sur-gical risk factors for postoperative condylar re-sorption. Although these displacements are hard to predict during surgery, it might be an area of concern especially for those patients who are at a high risk of condylar resorption.30
COnClusIOns
Superimposition of 3-dimensional (3D) vir-tual surface models allowed clear visualization and quantification of outcomes of mandibular advancement surgery.
On average, mandibular advancement sur-gery resulted in clinically significant (greater than 2 mm) anterior-inferior chin displacement as well as lateral movement on the inferior por-tion of the rami. On the other hand, a consider-able individual variability was observed for all the evaluated anatomic regions, with changes ranging beyond the clinically acceptable limit.
Contact address
Alexandre Trindade Motta
Av. das Américas, 3500 – Bloco 7/sala 220
CEP: 22.640-102 – Barra da Tijuca - Rio de Janeiro / RJ, Brazil E-mail: [email protected]
Submitted: January 2010 Revised and accepted: July 2010
1. Becktor JP, Rebellato J, Sollenius O, Vedtofte P, Isaksson S. Transverse displacement of the proximal segment after
bilateral sagittal osteotomy: a comparison of lag screw ixation
versus miniplates with monocortical screw technique. J Oral Maxillofac Surg. 2008 Jan;66(1):104-11.
2. Rebellato J, Lindauer SJ, Sheats RD, Isaacson RJ. Condylar positional changes after mandibular advancement surgery with
rigid internal ixation. Am J Orthod Dentofacial Orthop. 1999 Jul;116(1):93-100.
3. Van Sickels JE, Larsen AJ, Thrash WJ. Relapse after rigid
ixation of mandibular advancement. J Oral Maxillofac Surg. 1986 Sep;44(9):698-702.
4. Alder ME, Deahl ST, Matteson SR, Van Sickels JE, Tiner BD, Rugh JD. Short-term changes of condylar position after sagittal split osteotomy for mandibular advancement. Oral Surg Oral
Med Oral Pathol Oral Radiol Endod. 1999 Feb;87(2):159-65.
5. Gassmann CJ, Van Sickels JE, Thrash WJ. Causes, location,
and timing of relapse following rigid ixation after mandibular advancement. J Oral Maxillofac Surg. 1990 May;48(5):450-4.
6. Van Sickels JE, Larsen AJ, Thrash WJ. A retrospective study of
relapse in rigidly ixated sagittal split osteotomies: contributing
factors. Am J Orthod Dentofacial Orthop. 1988 May;93(5):413-8.
7. Schendel SA, Epker BN. Results after mandibular advancement
surgery: an analysis of 87 cases. J Oral Surg. 1980
Apr;38(4):265-82.
8. Bastir M, Rosas A, O’Higgins P. Craniofacial levels and the morphological maturation of the human skull. J Anat. 2006
Nov;209(5):637-54.
9. Cevidanes LH, Bailey LJ, Tucker GR Jr, Styner MA, Mol A,
Phillips CL, et al. Superimposition of 3D cone-beam CT models of orthognathic surgery patients. Dentomaxillofac Radiol. 2005
Nov;34(6):369-75.
10. Cevidanes LH, Franco AA, Gerig G, Profit WR, Slice DE, Enlow
DH, et al. Assessment of mandibular growth and response to orthopedic treatment with 3-dimensional magnetic resonance images. Am J Orthod Dentofacial Orthop. 2005 Jul;128(1):16-26. 11. Cevidanes LH, Bailey LJ, Tucker SF, Styner MA, Mol A,
Phillips CL, et al. Three-dimensional cone-beam computed tomography for assessment of mandibular changes after orthognathic surgery. Am J Orthod Dentofacial Orthop. 2007 Jan;131(1):44-50.
12. Cevidanes LH, Oliveira A, Phillips C, Motta AT, Styner M, Tyndall D. Three dimensional short-term mandibular displacements following class III surgery. J Dent Res. 2007;(Spec Iss A):1827.
13. Grauer D, Cevidanes LHS, Phillips C, Mol A, Styner M, Profit
W. Assessment of maxillary surgery outcomes one year post-surgery. J Dent Res. 2006;(Spec Iss A):0813.
14. Lee B, Cevidanes LHS, Phillips C, Mol A, Styner M, Profit
W. 3D assessment of mandibular changes one year after orthognathic surgery. J Dent Res. 2006;(Spec Iss A):1610. 15. Yushkevich PA, Piven J, Hazlett HC, Smith RG, Ho S, Gee JC, et
al. User guided 3D active contour segmentation of anatomical
structures: signiicantly improved eficiency and reliability.
Neuroimage. 2006 Jul 1;31(3):1116-28.
RefeRenCes
16. Chapuis J, Schramm A, Pappas I, Hallermann W, Schwenzer-Zimmerer K, Langlotz F, et al. A new system for computer-aided preoperative planning and intraoperative navigation during corrective jaw surgery. IEEE Trans Inf Technol Biomed. 2007 May;11(3):274-87.
17. Gerig G, Jomier M, Chakos M. Valmet: a new validation tool for assessing and improving 3D object segmentation. Med Image Comput Comput Assist Interv Int Conf. 2001;2208:516-28.
18. Bookstein F, Schäfer K, Prossinger H, Seidler H, Fieder M,
Stringer C, et al. Comparing frontal cranial proiles in archaic and modern homo by morphometric analysis. Anat Rec. 1999
Dec 15;257(6):217-24.
19. Bookstein FL. Morphometric tools for landmark data. 1st ed. Cambridge: Cambridge University Press; 1991.
20. Baumrind S, Ben-Bassat Y, Bravo LA, Curry S, Korn EL. Partitioning the components of maxillary tooth displacement by the comparison of data from three cephalometric
superimpositions. Angle Orthod. 1996;66(2):111-24.
21. Efstratiadis S, Baumrind S, Shofer F, Jacobsson-Hunt U, Laster L, Ghafari J. Evaluation of Class II treatment by cephalometric regional superimpositions versus conventional measurements. Am J Orthod Dentofacial Orthop. 2005 Nov;128(5):607-18. 22. Ghafari J, Baumrind S, Efstratiadis SS. Misinterpreting growth
and treatment outcome from serial cephalographs. Clin Orthod
Res. 1998 Nov;1(2):102-6.
23. Cevidanes LH, Styner MA, Profit WR. Image analysis and
superimposition of 3-dimensional cone-beam computed tomography models. Am J Orthod Dentofacial Orthop. 2006
May;129(5):611-8.
24. Björk A, Skieller V. Normal and abnormal growth of the mandible. A synthesis of longitudinal cephalometric implant
studies over a period of 25 years. Eur J Orthod. 1983
Feb;5(1):1-46.
25. Halazonetis DJ. Computer-assisted cephalometric analysis. Am
J Orthod Dentofacial Orthop. 1994 May;105(5):517-21.
26. Johnston LE Jr. Balancing the books on orthodontic
treatment: an integrated analysis of change. Br J Orthod. 1996 May;23(2):93-102.
27. Harris MD, Van Sickels JE, Alder M. Factors inluencing
condylar position after the bilateral sagittal split osteotomy
ixed with bicortical screws. J Oral Maxillofac Surg. 1999
Jun;57(6):650-4.
28. Costa F, Robiony M, Toro C, Sembronio S, Polini F, Politi M. Condylar positioning devices for orthognathic surgery: a literature review. Oral Surg Oral Med Oral Pathol Oral Radiol
Endod. 2008 Aug;106(2):179-90.
29. Herford AS, Hoffman R, Demirdji S, Boyne PJ, Caruso JM, Leggitt VL, et al. A comparison of synovial luid pressure after
immediate versus gradual mandibular advancement in the miniature pig. J Oral Maxillofac Surg. 2005 Jun;63(6):775-85. 30. Hwang SJ, Haers PE, Seifert B, Sailer HF. Surgical risk
factors for condylar resorption after orthognathic surgery. Oral Surg Oral Med Oral Pathol Oral Radiol Endod. 2000