AN INTEGRATED MULTICRITERIA DECISION-MAKING APPROACH TO REAL ESTATE EVALUATION: CASE OF THE TODIM METHOD
Helen M. Moshkovich
1, Luiz Fl´avio Autran Monteiro Gomes
2*and Alexander I. Mechitov
3Received June 2009 / Accepted May 2010
ABSTRACT.Evaluation of real estate properties is an important factor in any economy. The appraisal process is rather subjective, based on the appraiser’s experience and intuition. Attempts are being made to help appraisers produce more stable and reliable results. In the paper the authors present an integrated approach to the problem based on the multicriteria decision making framework. The process is carried out through three phases using the multicriteria method TODIM. An “adjusted value” iterative procedure for market value estimation is proposed. The final property price ensures that the overall quality of the alter-native obtained through the TODIM method is not farther from the comparable properties on the market than the stated threshold. The process is illustrated through an application in the city of Volta Redonda (Brazil). The results are compared with the “proportional approach”. The “adjusted value” approach showed significant improvement compared to the “proportional” adjustment of market values.
Keywords: multiple criteria decision analysis, real estate market, TODIM method.
1 INTRODUCTION
Real estate evaluation is important to many stakeholders. Real estate owners and real estate agents are interested in the market value of properties with the goal to sell, local authorities are interested in fair evaluation of property value for tax purposes, real estate investors need data for locating promising properties, house buyers and renters are interested in fair price. In spite of different goals, all participants are interested in knowledge of a realistic market value for real estate properties (Kettani, Oral & Siskos, 1998).
There are three major approaches to property valuation: Cost, Income and Sales Comparison (The Appraisal Institute, 2008). The Sales Comparison approach is most frequently used for estimation of residential properties, while Income approach is mostly used for commercial real
*Corresponding author
estate, and Cost approach is preferred for newer and/or special properties. This study will con-centrate on the Sales Comparison approach to property valuation.
The Sales Comparison approach requires identifying, locating, and estimating similar proper-ties at the close location as differences exist between individual properproper-ties as well as between neighborhoods. It is assumed that the market value of a real estate under consideration is directly related to the prices of comparable competitive properties.
Traditionally, the Sales Comparison approach is utilized through the, so-called, adjustment-grid method (Lentz & Wang, 1998) where comparative characteristics of similar properties are eva-luated and adjustments for the differences are made. It is commonly accepted that the process is rather subjective and heavily relies on appraisers’ experience and intuition (see,e.g.Gau, Lai & Wang, 1992; Lipscomb & Gray, 1990) Attempts are being made to help appraisers produce more stable and reliable results.
The paper proposes an integrated approach to the evaluation of property value in three phases. The research builds on the previous studies of Gomes & Rangel (2009) and Rangel & Gomes (2007), which proposed ranking all properties on the real estate market including sold ones, using the TODIM method. In our approach this is the first phase of the process. Results of the evaluation in this phase are used to determine “close in value” properties with the known market price. The third phase of the process proposes an “adjusted value” iterative procedure market to estimate market value of each property.
The next section of the paper will review the current developments in this area. Section 3 will present the proposed approach. The effectiveness of the integrated approach will be demonstra-ted through an application in Section 4 followed by the discussion of the results and a conclusion.
2 DECISION SUPPORT FOR REAL ESTATE EVALUATION
As many qualitative and quantitative factors affect the value of each property, multivariate models seem suitable in the appraisal process. The multiple-regression method or the “hedonic pricing model” emerged as one of the first alternatives to the adjustment method (Cronan, Epley & Perry, 1986; Dubin & Sung, 1990). The main problem with this method is the requirement for many observations to produce reliable parameters of evaluation (see, e.g. Colwell, Cannaday & Wu, 1983; p. 20). Rather often the requirement may not be met especially in less developed property markets (see,e.g.Gomes & Rangel, 2009; Maliene, Kakaluskas & Zavadskas, 2002) stimulating other approaches to appear.
assigned market values to “tune” necessary parameters and then apply them for new properties. As with multiple-regression approach it requires substantial amount of “known” cases.
Case-based reasoning (Taffese, 2007; O’Roarty, Patterson, McGreal & Adair, 1997) simulates the process of locating close in value real estate properties. Previous cases (evaluated proper-ties) are stored in the system’s memory. Each new case is analyzed from the point of view of “closeness” to one of the previous cases. The set of cases and ways to analyze similarity between them is usually done with the help of the experts. The process is usually time consuming for the experts and has to be updated rather often in active markets while not provide enough cases in slower markets.
Expert systems are usually constructed as a set of rules formulated by experts in the field (Czernkowski, 1990). Rules have to be updated if conditions and/or evaluation changes which may be complicated. As with case-based reasoning, process is rather difficult and needs involve-ment of an expert each time.
Multiple criteria decision analysis is also appropriate for real estate valuation as it deals with multiple factors of both quantitative and qualitative nature. As AI methods, multiple criteria methods rely on the input from human experts (decision makers) but on a much lesser scale and allow systematic approach to the decision process (Keeney & Raiffa, 1993; Roy & Bouyssou, 1993; Barba-Romero & Pomerol, 2000; Belton & Stewart, 2002). For a presentation of different multicriteria methods and their limitations see Belton & Stewart (2002).
There were few attempts to apply a multicriteria approach to real estate problems. Most of those attempts were connected either with real estate investment (Kettani, Oral & Siskos, 1998; Markland, 1979; Gratcheva & Falk, 2003) or were carried out within sustainability/urban de-velopment studies ( ˇSaparauskas & Turskis, 2006; Zavadskas & Antucheviˇcien˙e, 2004). These studies concentrated on selecting the best alternative on the basis of multicriteria evaluation of properties. Gomes & Rangel (2009) used the multicriteria method TODIM (Gomes & Lima, 1992a, b) to rank order properties on a local market but the study did not address the determina-tion of the market value of the properties. Kaklauskas, Zavadskas, Banaitis & Satkauskas (2007) used an additive value function to compare three “close in value” properties. Known market values for two of them provided the basis for market value determination for the third alterna-tive. The question of how to find “close in value” properties was no discussed.
3 INTEGRATED APPROACH TO MARKET VALUE ESTIMATION
bedrooms, bathrooms, square footage as well as more subjective characteristics such as quality of construction, level of updates, quality of neighborhood and others. Multiple criteria decision methods traditionally deal with this type of problems. The whole process may be assisted by systematic application of a multicriteria approach and will include the following phases:
All properties on the market (including recently sold ones) are evaluated against a set of criteria (characteristics) important for the market. A multicriteria method is used to evaluate overall quality of each property on this basis.
Quality evaluation is used to rank order properties and estimate the “closeness in quality” of properties under valuation to others with the goal of selecting a small number of the appropriate properties for detailed comparison. Estimates of the market value of properties using the same multicriteria method and the principle that the market price should make the property as attractive as the comparative “sold” ones are then determined.
3.1 Multicriteria evaluation of properties
The goal of this step is to use a multicriteria method to evaluate the overall quality of properties. Although a number of other methods could have been selected, the multicriteria method chosen for that evaluation was the TODIM method for the reasons presented next. TODIM (an acronym in Portuguese of Interactive and Multicriteria Decision Making), was conceived in its current form at the beginning of the nineties and is a discrete multicriteria method based on Prospect Theory (Kahneman & Tversky, 1979). Thus, while practically all other multicriteria methods start from the premise that the decision maker always searches for the solution corresponding to the maximum of some global measure of value – for example, the highest possible value of a multiattribute utility function, in the case of MAUT (Keeney & Raiffa, 1993) – , the TODIM method makes use of a global measurement of value calculable by the application of the paradigm of Prospect Theory. In this way, the method is based on a description, proved by empirical evidence, of how people effectively make decisions in the face of risk. Although not all multi-criteria problems deal with risk, the shape of the value function of the TODIM method is the same as the gain/loss function of Prospect Theory. The use of TODIM relies on a global multiattribute value function. This function is built in parts, with their mathematical descriptions reproducing the gain/loss function of Prospect Theory. The global multiattribute value function of TODIM then aggregates all measures of gains and losses over all criteria.
although based both on elements of the European and the American Schools, relies on the use of a multiattribute value function and is founded on a psychological theory on how we humans decide in face of risk, i.e. Prospect Theory (Gomes, Gomes & Rangel, 2009).
It is important to emphasize peculiarities of the proposed multicriteria approach compared to traditional approaches:
All properties in the local market as well as recently sold properties should be analyzed and used in the evaluation. This is necessary as the market value of the property is based not only on the qualities of the property itself but also on the qualities of other properties in the market.
Properties are evaluated against a set of characteristics (criteria) important for the local market but this set does not include “price”. The “price” is considered to be the result of the overall “quality” of the property (not an “input” value).
The evaluation will be used to rank properties with the goal of locating “close” in quality” sold properties for a detailed comparative analysis.
The initial step of multicriteria decision making is the formation of a set of alternatives (pro-perties) and a set of criteria for their evaluation. This step requires input from the decision maker (expert) in the problem, e.g., the most experienced appraiser(s) in the local agency. The number and content of criteria depend on the peculiarities of the area as well as on the task at hand. There are examples of using up to 27 criteria for comparative evaluation of quality of three single-family residences (Kaklauskas, Zavadskas, Banaitis & Satkauskas, 2007) and of using just eight criteria for comparative evaluation of 15 rental properties (Gomes & Rangel, 2009). Criteria usually include such characteristics as “Quality of Construction”, “Year of Cons-truction,”, “Number rooms/bedrooms/bathrooms,” “Number of garage spaces”, “Neighborhood Quality,” etc.
Once criteria are formed, alternative properties are estimated against them by the decision ma-ker/experts and these estimations are used to evaluate overall quality of alternatives.
The problem may be formulated as follows:
There is a set of alternatives A= {a1,a2, . . . ,an}
There is a set of criteriaC = {C1,C2, . . . ,Cm}
Each alternativeajis evaluated against a set of criteriaC1,C2, . . . ,Cmand may be presented as
a vectoraj = {a1j,a2j, . . . ,am j}, j =1,2, . . . ,n.
On the basis of this information and the decision maker’s preferences, determine their overall valueV(aj), j =1,2, . . . ,n.
methods (Roy & Bouysou, 1993; Brans & Mareschal, 1992) as it evaluates the overall value of each alternative as a sum of relative “gains and losses” of each alternative against all other alter-natives in the set. This makes evaluation on the overall quality of properties more dependent on their current set. The evaluation for each alternative may change when the set of alternatives is changed. This corresponds to the general notion that the market value of properties depends not only on the qualities of the property but also on the actual set of properties on the market at the current time.
As the method is not widely known we will briefly describe its main steps:
The decision maker evaluates criteria importance using some interval or cardinal scales (e.g., if the most important criterion is 100 points, assign appropriate points to other criteria, or use a 5 point scale to assign importance values to criteria). The results of such evaluation are normali-zed, so that the sum of all criterion weights is equal to 1:w1+w2+ ∙ ∙ ∙ +wm =1.
Quantitative criterion scales are normalized to produce comparable valuesvi j. Qualitative
crite-rion scales are converted into values either directly by the decision maker (e.g., the most preferred value is 1 and the least preferred is 0, others are assigned values between 1 and 0) or some car-dinal scales (e.g., from 1 to 5) may be used. These estimates are then normalized in the same way as quantitative scales to produce comparable values. Formula (1) below is used for “maxi-mizing” criteria while the set of formulae (2-4) are used for “mini“maxi-mizing” criteria. Formula (2) normalizes values. Formula (3) reverses the higher values into smaller ones to give more value to lower initial alternatives’ estimates. Formula (4) normalizes new values.
vi j =
ai j
Pn
k=1ai k
i =1,2, . . . ,m; j =1,2, . . . ,n (1)
pi j =
ai j
Pn
k=1ai k
i =1,2, . . . ,m; j =1,2, . . . ,n (2)
pi j =
min
j pi j
pi j
i =1,2, . . . ,m; j =1,2, . . . ,n (3)
vi j =
pi j′
Pn k=1p′i k
i =1,2, . . . ,m; j =1,2, . . . ,n (4)
Individual criterion weights are recalculated using the most “important” one (criterioncwith the highest weightwc)presenting criteria weights as a proportion of the most important one: for
eachwi,i=1,2, . . .mwi c=wi/wc.
For each criterioni = 1,2, . . .m for each two alternativesaj andak(j,k = 1,2, . . . ,n)the
“single-attribute dominance”8i(aj,ak)is calculated as:
8i(aj,ak)=
− r Pm
r=1wr c|vi j−vi k|
wi c , (vi j−vi k) <0 0, (vi j−vi k)=0
r
wi c|vi j−vi k|
Pm
Formula (5) allows presentation of the value of relative “gains” and “losses” for two alternatives to be presented as anS-shape function which reflects findings of the Prospect Theory (Kahneman & Tversky, 1979) about how people essentially make decisions connected with risks.
1) For each pair of alternatives aj andak(j,k = 1,2, . . . ,n)the relative “dominance” is
calculated as a sum of single-attribute dominance measures8i(aj,ak),i =1,2, . . . ,m
δ(ajak)= m
X
i=1
8i(ajak) (6)
The “global dominance” G(aj)of each alternative aj,j = 1,2, . . .n is calculated as a
sum of “dominances” over all other alternatives:
G(aj)= m
X
k=1
δ(aj,ak) j =1,2, . . . ,n (7)
2) The last step normalizes “global dominances” to produce the relative overall valueV(aj)
of each alternative using formula (8):
V(aj)=
G(aj)−min k G(ak)
max
k (ak)−mink G(ak)
(8)
3.2 Defining “close in quality” properties
The overall valuesV(a), obtained through formula (8) ranging from 0 to 1, are used to rank order alternatives. In multiple criteria decision making, the results are rarely checked against previous cases, as problems are usually unique each time for each decision maker. While evaluating real estate, there are always “cases with known outcomes” – sold properties. They are the usual basis for appraisal decisions. These properties provide an additional advantage as this information may be used to ensure the validity of obtained alternatives’ ranking. If the selling price is higher for higher quality alternatives in the obtained ranking, the established procedure may be considered reasonable for application. If not, the cases of reverse preferences should be investigated by the decision maker concerning:
1. Correctness of alternatives’ evaluation against criteria.
2. Adequate system of criteria.
3. Appropriateness of scales.
4. Appropriateness of single-attribute utilities (values).
The analysis is easier as the attention may be concentrated on differences in a small number of close alternatives, fine-tuning the subjectively estimated parameters. If all previous estimates were found to be appropriate, the selection of the normative model applied may be questioned. Once the system is fined-tuned and the final alternatives’ ranking is accepted, the second step is to find “close in quality” sold properties to the property under valuation.
Using the TODIM method all adequate properties on the local market (sold as well as unsold) are rank ordered according to their overall quality (value). The ranking is applied to sold properties as well as to unsold ones. In the majority of cases, there will be two comparable sold properties (alternatives) – one property more preferable than the alternative under valuation, and one pro-perty which is less preferable that the alternative under valuation. These are the two “closest” properties on the current market.
Let us mark the alternative under valuation asa∗, whilea+will be alternative with the assigned price which is more preferable than alternativea∗anda−will be alternative with the assigned price which is less preferable than alternative a∗or V(a+) > V(a∗) > V(a−). One would expect that the selling price (market value) of alternative a∗will be between selling prices for alternatives a+ anda−. Let P(ai)mark the price of alternativeai, then P(a+) > P(a∗) >
P(a−).
The easiest way to assign price to alternative a* is to propagate the difference of alternatives in the overall value (quality) to difference in price through the “proportional approach”:
P(a∗)=P(a+)−P(a+)−P(a−)V(a+)−V(a∗).V(a+)−V(a−) (9)
This approach, though, is not consistent with the overall multicriteria paradigm of alternatives’ evaluation. The real goal is to assign price (market value) to a∗ in a way to make it equally competitive with alternativesa+anda−. Within the framework of this approach, price should be considered as one more criterion, and the task is to find price P(a∗)that ensures that overall value ofa∗(including price) will be comparable with corresponding values ofa+anda−.
3.3 An “adjusted value” approach to market value of real estate
To implement the “adjusted value” approach it is necessary to: 1) evaluate alternatives’ overall valuesVp(ai)including price as an additional criterion; 2) formulate the notion “comparable”
for the alternatives’ overall values.
The first requirement is easy to implement if we assign price to alternativea∗as the average of prices for alternativesa+anda−: P(a∗) = [P(a+)+ P(a−)]/2. This price may be used to evaluate overall values Vp(ai)using the TODIM method as previously stated. The price may
be adjustedif theVp(a∗)is not close enough to Vp(a+)andVp(a−)until the “closeness” is
satisfactory. The second requirement should provide the measure of this “closeness”.
pattern of values with the “Price” criterion included: Vp(a+) = 1 andVp(a−) = 0. In these
circumstances the “comparable value” may be expressed as the difference between the overall value ofa∗with and without the “Price” criterion:
d =V(a∗)−Vp(a∗) (10)
If some threshold d∗ is set to this distance, then the price for a∗ should be re-adjusted until |d|< d∗. If the distance is negative (value is lower than it should be), it is necessary to lower the price to make the alternative more attractive. The re-adjustment may be done usingd as a correcting parameter: new price = old price(1+d)or:
P′(a∗)=P(a∗)(1+d) (11)
Ifd is negative the price is lowered, ifd is positive (which means the price is too low for the alternative, making it “too attractive”), the price is increased.
The whole process of defining the price in the “adjusted value” approach may be carried out through the following steps:
1) Add the criterion Cm+1 “Price” to the initial set of criteria with quantitative scale (actual monetary value).
2) Assigned weight of 0.5 for criterionCm+1“Price” (equal importance to all other criteria together). Recalculate criterion weights for criteriaC1,C2, . . . ,Cm as half of their
previ-ous value(wr/2r =1,2, . . . ,m). Sum of weights will still equal to 1.
3) Use previous initial estimates for alternatives a+, a∗, a− for criteria C1,C2, . . . ,Cm
and normalize them as described before to obtain valuesvi j.
4) Evaluate the initial price for alternative a∗ as the average of prices for alternatives a+ anda−.
5) Normalize estimates for criterion Cm+1 “Price” for alternatives a∗, a+, and a−, using formulae (2)-(4) as “Price” is a minimization criterion.
6) Calculate overall values V(ai)and Vp(ai)for alternativesa+, a∗, and a−, using these
data.
7) Set the limit to the relative difference in values for the alternatives d∗ at some level (e.g., 5% or 0.05).
8) Calculated using formula (10).
9) If|d|>d∗, re-calculateP(a∗), using formula (11) and return to step 5.
The process is easy to implement and reflects the general multiple criteria approach but it does not work when there is only one alternative with known price comparable to the alternative under valuation. To overcome this problem the absolutely “best” and “worst” hypothetical alternatives are formed based on all the best and all the worst reasonable criterion values (e.g., best and worst values presented in alternatives under consideration). The decision maker is asked to assign “price” to these two properties. The evaluation process should not be too difficult for the expert as the “best” property dominates all the others while the “worst” is dominated by all other properties in the market. These two alternatives are used as the “third” alternative in the “adjusted value” process when needed.
4 APPLICATION OF THE INTEGRATED APPROACH TO MARKET VALUE
ESTIMATION
The case is a continuation of the case from Gomes & Rangel (2009). The study sought to eva-luate rent value for some residential properties in the city of Volta Redonda (Brazil). In order to evaluate the properties a set of criteria with corresponding scales and importance weights were established with the help of an experienced realtor in the area (see Table 1). Verbal scales of qua-litative criteria were converted to cardinal ones. Weights were evaluated by the decision maker using a 5-point scale and then normalized.
Table 1– Criteria, scales, and weights.
No. Criterion Scale Weight Normalized
description weight
C1. Location Qualitative, score 1 to 5 5 0.25
C2. Constructed area Square meters 3 0.15
C3. Construction quality Qualitative, score 1 to 3 2 0.10 C4. State of conservation Qualitative, score 1 to 4 4 0.20
C5. Number of garage spaces Number 1 0.05
C6. Number of rooms Number 2 0.10
C7. Attractions Qualitative, score 0 to 4 1 0.05
C8. Security Qualitative, score 0 to 1 2 0.10
Fifteen alternative properties in the area were identified and evaluated against the set of criteria by specialists from the real estate agency (see Table 2). A set of six alternatives with known rental values were in the set.
4.1 Evaluating alternatives
The first step is to normalize all scales, so that all criteria data are compatible. Formula (1) is used to obtainvi j as all criteria are to be maximized. To evaluate the overall value of each alternative
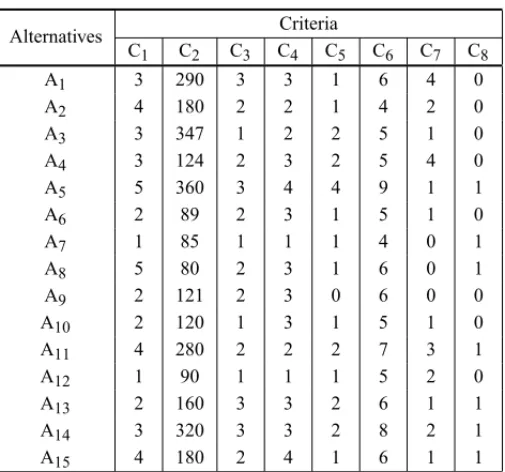
Table 2– Evaluated alternatives.
Alternatives Criteria
C1 C2 C3 C4 C5 C6 C7 C8
A1 3 290 3 3 1 6 4 0
A2 4 180 2 2 1 4 2 0
A3 3 347 1 2 2 5 1 0
A4 3 124 2 3 2 5 4 0
A5 5 360 3 4 4 9 1 1
A6 2 89 2 3 1 5 1 0
A7 1 85 1 1 1 4 0 1
A8 5 80 2 3 1 6 0 1
A9 2 121 2 3 0 6 0 0
A10 2 120 1 3 1 5 1 0
A11 4 280 2 2 2 7 3 1
A12 1 90 1 1 1 5 2 0
A13 2 160 3 3 2 6 1 1
A14 3 320 3 3 2 8 2 1
A15 4 180 2 4 1 6 1 1
The first step is to transform initial criterion weightswi(i =1,2, . . . ,m)into relative weights
using the reference (most important) criterion weight. Reference criterion in this problem is the first criterionC1, so relative weightswi1=wi/w1i =1,2, . . .,m, wherew1=0.25.
Using these weights, functions8i(aj,ak)for each criterioni and for each pair of alternatives j
andkare calculated according to formula (5). Let illustrate the process for alternatives A1and A2for criterionC2∙v21=0.103 andv22=0.064∙v21> v22so
82(A1,A2)= +
s
w21|v21−v22|
Pm
i=1wi1 =
r
0.6|0.103−0.064|
4 =0.0764
Let us now calculate the same function for criterion C1. In this case v21 = 0.068 and v22=0.091, sov21< v22and
81(A1,A2)= −
s Pm
i=1wi1|v21−v22| w11
= −
r
4|0.0.068−0.091|
1 = −0.3015
To evaluate dominance of alternative A1over alternative A2we have to calculate functions8i
for each criterion(i =1,2, . . . ,m)and sum up the results to produce a delta function according to formula (6):
δ(A1,A2)= m
X
i=1
8(A1,A2)=0.0764+(−0.3015)+ ∙ ∙ ∙ + =0.01723
δ(A1,A2)= m
X
i=1
To evaluate the global dominance measure for alternative A1delta values for all alternatives are summed up according to formula (7): G(A1) = Pnj=1δ(A1,Aj). Overall value of
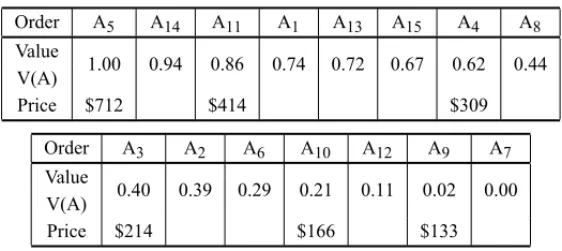
alterna-tive A1is obtained through normalization of global measures using formula (8). Results for all alternatives are presented in Table 3. As have been stated above six properties among fifteen alternatives are already rented, so that the amount of rent is known. These data are used to evalu-ate the quality of the resulting rank ordering of alternatives. Alternatives in the table are ordered according to their overall valuesV(aj).
Table 3– Overall values for alternatives.
Order A5 A14 A11 A1 A13 A15 A4 A8
Value
1.00 0.94 0.86 0.74 0.72 0.67 0.62 0.44 V(A)
Price $712 $414 $309
Order A3 A2 A6 A10 A12 A9 A7
Value
0.40 0.39 0.29 0.21 0.11 0.02 0.00 V(A)
Price $214 $166 $133
As can be seen, the TODIM method produced a very good rank order of alternatives with no rank reversals for rented properties and no need for additional analysis.
4.2 Evaluating rent for residential properties
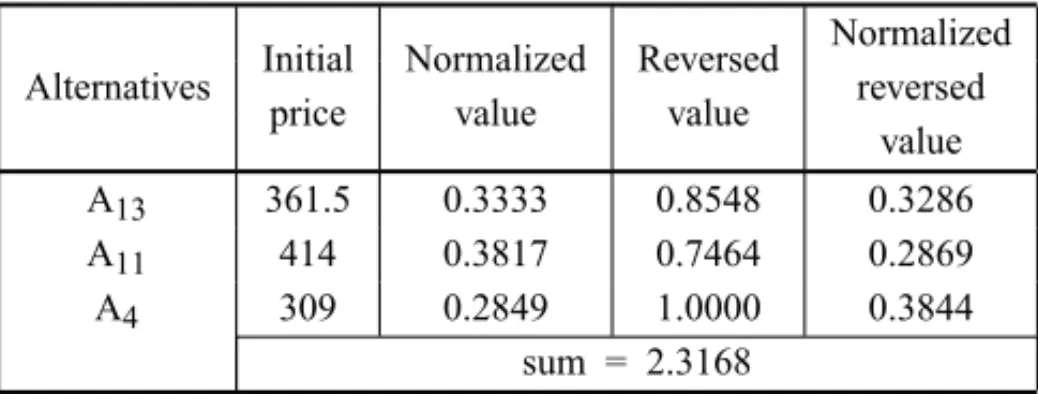
Now the rent amount will be evaluated through the “adjusted value” approach. Let us illustrate the process of evaluating the amount of rent for the property using alternative A13. According to the ranking, alternative 13 is better than alternative 4 (A4)but less preferable that alternative 11(A11). First, we add criterion “Price”(C9)and assign alternative A13the price equal to the average of rents for A4andA11: P(A14)= [P(A5)+P(A11)]/2=(414+309)/2=$361.5.
Table 4– Normalizing values for criterion “price”.
Initial Normalized Reversed Normalized Alternatives
price value value reversed
value
A13 361.5 0.3333 0.8548 0.3286
A11 414 0.3817 0.7464 0.2869
A4 309 0.2849 1.0000 0.3844
sum = 2.3168
Table 5– Evaluating overall value with criterion “price”.
Overall value V(A) Alternative Rent
without price with “price” Difference d
A13 361.5 0.2837 0.2495 -0.0342
A11 414 1 1
A4 309 0 0
The overall value for each alternative with and without the criterion “Price” is calculated. The process is carried out in the way illustrated for 15 alternatives. Only three alternatives are used: A13,A11, and A4. Due to the specific way of normalization used in the TODIM method, the resulting overall values in each case will include 0 and 1 and one alternative with the value between 0 and 1 (see Table 5).
These values are used to calculate the average distanced =0.2495−0.2837= −0.0342. This means that alternative A13is more attractive (by 3.42% of value) without the price than with the price of $361.5 for the property rent. The threshold for the distance was set at 1%(d∗ =0.01). With this limit it is necessary to re-adjust price for A13 (lower the price) to make A13 more attractive. New priceP′(A
13) = P(A13)(1+d)= 361.5(1−0.0342)= $349.1. This price is used instead of $361.5 in the initial values (see Table 6) and all other “Price” values are re-calculated. New distance isd = −2.37%. Overall there were four iterations with the resulting rent price of $332.
Table 6– The “adjusted value” procedure.
Iterations 0 1 2 3 4
Price Vp(A) 361.5 349.1 340.8 335.4 332
Difference d -3.42% -2.37% -1.59% -1.04% -0.67%
The procedure was repeated for all fifteen properties including properties with known rent. To evaluate properties A5,A7, and A9, the “best” and the “worst” alternatives were formed and assigned price with the help of the decision maker as following:
To evaluate alternative A5 the “best” alternative was used. To evaluated rent for alternatives A7and A9, the “worst” alternative was used. There may be a, so-called, “rank reversal” when using only three alternatives compared to fifteen. As the overall value of alternatives in the TODIM method is a result of gains and losses compared to all other alternatives, the reversals can happen. In our case, we had only one rank reversal with the alternative A15. When compared only to alternatives A11 andA4,A4happened to be more preferable than alternative A15 (even without the “Price” criterion). To resolve the issue alternatives A4and A3of less value were used to determine the adjusted price for property A15. The results are presented in Table 7. The agency was satisfied with the results and acknowledged that the process helped establish a more systematic to rent evaluation.
Table 7– Results with “adjusted value” procedure.
“Adjusted value” procedure Known
Alternative Compare Assigned No. of Final
rent with
rent iterations value of d
712 A5 “best,”A4 $607.00 0 0.68%
A14 A5,A11 $515.00 4 -0.96%
414 A11 A5,A4 $510.50 0 -0.62%
A1 A11,A4 $322.70 3 -0.33%
A13 A11,A4 $332.00 4 -0.67%
A15 A4,A3 $305.65 3 0.77%
309 A4 A11,A3 $314.00 0 -0.03%
A8 A4,A3 $217.70 4 -0.87%
214 A3 A4,A10 $237.50 0 -0.22%
A2 A3,A10 $211.50 3 0.15%
A6 A3,A10 $174.80 2 -0.42%
166 A10 A3,A9 $175.30 1 0.90%
A12 A3,A9 $151.20 1 0.90%
133 A9 A10,“worst” $123.00 0 0.25%
A7 A9,“worst” $111.30 3 0.94%
4.3 Evaluation of the results
To evaluate the efficiency of the approach, assigned prices were compared with those obtai-ned through the “proportional approach”. The “proportional approach” is implemented through formula (9) but using overall valuesV(aj)obtained through the TODIM method. For example,
for alternativeA13the “proportional” rent value is:
P(A13) = P(A11)−P(11)−P(A4)V(11)−V(A13)
.
V(A11)−V(A4)
= 414−
(414−309)(.8578−0.7188).
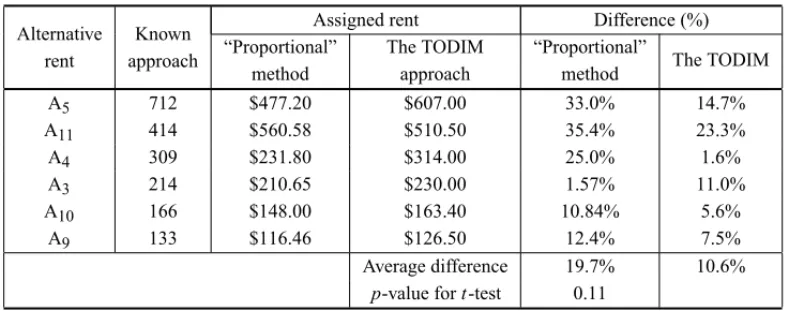
To evaluate the accuracy of the proposed approach, properties with known prices were used. Real prices and prices assigned using the “proportional” and the “adjusted value” approaches are presented in Table 8. The results show that the “adjusted value” approach provides on average more accurate results than the “proportional approach:” 10% average error compared to 19.7%, though the difference is not significant statistically –p-value in at-test is equal to 0.11.
Table 8– Accuracy of assigned rent values using two approaches.
Assigned rent Difference (%)
Alternative Known
“Proportional” The TODIM “Proportional”
The TODIM rent approach
method approach method
A5 712 $477.20 $607.00 33.0% 14.7%
A11 414 $560.58 $510.50 35.4% 23.3%
A4 309 $231.80 $314.00 25.0% 1.6%
A3 214 $210.65 $230.00 1.57% 11.0%
A10 166 $148.00 $163.40 10.84% 5.6%
A9 133 $116.46 $126.50 12.4% 7.5%
Average difference 19.7% 10.6%
p-value fort-test 0.11
5 DISCUSSION AND CONCLUSION
The study proposed an integrated approach to property valuation based on multicriteria deci-sion making process. The approach is carried out through three main phases. In the first phase the property alternatives on the local market are rank ordered using the multiple criteria method TODIM. The results of the first phase are used to locate “closest” in value properties with already known value (price). This knowledge is used in the process of assigning appropriate market value to the property without the known price through the proposed “adjusted value” approach. The “adjusted value” approach to assigning price to the property showed its good potential in the application. Prices obtained through the proposed approach were closer to the real ones than the “proportional approach,” and the difference was significant. It is especially important for the emerging markets with relatively small number of market properties and small number of qualified real estate valuators available. The calculation process is not complicated. An Excel spreadsheet was used in the application. The process may be easily adjusted to a web-based access if needed.
applied on the basis of large property data sets (Lentz & Wang, 1998). The application of the approach was successful and well accepted by the decision maker.
The relative drawbacks of using the TODIM method are connected with the possibility of rank reversals and the absence of a logical way to evaluate properties with only one “close” value. Both problems may be resolved through introducing “best” and “worst” alternatives and adjus-ting the set of comparable properties. Future research may include attempts at applying nor-malization using the “largest” and the “smallest” possible values for all scales for all sets of alternatives. It may help overcome the “rank reversal” problem in most cases. It may also may be interesting to look at the application of other multicriteria methods within the framework of the proposed approach and to re-adjust the notion of “right market price.”
ACKNOWLEDGEMENTS
The authors are grateful to the referees for their insightful comments on the first version of this paper. Research leading to this article was partially supported by the National Council for Scientific and Technological Development (CNPq) of Brazil through Process No. 310603/ 2009-9.
REFERENCES
[1] BARBA-ROMEROS & POMEROLJC. 2000. Multicriterion Decision in Management: principles and practice. Boston: Kluwer Academic Publishers.
[2] BELTON V & STEWART TJ. 2002. Multiple criteria decision analysis: an integrated approach. Massachusetts: Kluwer Academic Publishers.
[3] BRANSJP & MARESCHALB. 1992. PROMETHEEV: MCDM problems with additional segmenta-tion constraints.INFOR,30(2): 85–96.
[4] COLWELLPF, CANNADAY RE & WUC. 1983. The Analytical Foundations of Adjustment-Grid Methods.Journal of the American Real Estate and Urban Economics Association,11: 11–29.
[5] CRONAN TP, EPLEY RR & PERRY G. 1986. The Use of Rank Transformation and Multiple Regression Analysis in Estimating Residential Property Values with Small Sample.Journal of Real Estate Research,1: 19–31.
[6] CZERNKOWSKIRJ. 1990. Expert systems in real estate valuation.Journal of Property Valuation & Investments,8(4): 376–393.
[7] DUBINRA & SUNGC. 1990. Specification of Hedonic Regressions: Non-nested Tests on Measures of Neighborhood Quality.Journal of Urban Economics,27: 97–110.
[8] EVANA, JAMESH & COLLINSA. 1993. Artificial Neural Networks: an Application to Residential Valuation in the UK.Journal of Property Valuation & Investment,11: 195–204.
[9] GAUGW, LAIT & WANGK. 1992. Optimal Comparable Selection and Weighting in Real Property Valuation: An Extension.Journal of the American Real Estate and Urban Economics Association,
20: 107–23.
[11] GOMES LFAM, GOMES CFS & RANGEL LAD. 2009. A comparative decision analysis with THOR and TODIM: rental evaluation in Volta Redonda.Revista Tecnologia,30(1): 7–11.
[12] GOMESLFAM & LIMA MMPP. 1992a. TODIM: basics and application to multicriteria ranking of projects with environmental impacts. Foundations of Computing and Decision Sciences, 16(4): 113–127.
[13] GOMES LFAM & LIMA MMPP. 1992b. From Modeling Individual Preferences to Multicriteria Ranking of Discrete Alternatives: a look at Prospect Theory and the additive difference model. Foun-dations of Computing and Decision Sciences,17(3): 171–184.
[14] GOMESLFAM & RANGELLAD. 2009. An application of the TODIM method to the multicriteria rental evaluation of residential properties.European Journal of Operational Research,193: 204–211.
[15] GRATCHEVAEM & FALKJE. 2003. Optimal deviations from an asset allocation.Comp. Oper. Res.,
30(11): 1643–1659.
[16] KAHNEMAND & TVERSKYA. 1979. Prospect theory: An analysis of decision under risk. Econo-metrica,47: 263–292.
[17] KAKLAUSKASA, ZAVADSKASEK, BANAITISA & SATKAUSKASG. 2007. Defining the utility and market value of a real estate: a multiple criteria approach.International Journal of Strategic property Management,11: 107–120.
[18] KEENEYRL & RAIFFAH. 1993. Decisions with multiple objectives: preferences and value trade-offs. Cambridge: Cambridge University Press.
[19] KETTANI O, ORAL M & SISKOS Y. 1998. A Multiple Criteria Analysis Model for Real Estate Evaluation.Journal of Global Optimization,12(2): 197–214.
[20] LENTZ G & WANGK. 1998. Residential Appraisal and the Lending Process: A Survey of Issues.
Journal of Real Estate Research,15: 11–39.
[21] LIPSCOMBJB & GRAYJB. 1990. An Empirical Investigation of Four Market-Derived Adjustment Methods.Journal of Real Estate Research,5: 53–66.
[22] MALIENE V, KAKALUSKAS A & ZAVADSKAS EK. 2002. Application of a New Multiple Crite-ria Analysis Method in the Valuation of Property. TS9.3 Special Valuation Problems I, FIG XXII International Congress, Washington, D.C. USA, April 19-26, 1–14.
[23] MARKLANDRE. 1979. A simulation approach to real estate investment analysis.Comp. Oper. Res.,
6(3): 121–128.
[24] O’ROARTYB, PATTERSOND, MCGREALWS & ADAIRAS. 1997. A case based reasoning ap-proach to the selection of comparable evidence for retail rent determination.Expert Systems with Applications,12(4): 417–28.
[25] PAGOURTZI E, METAXIOTIS K, NIKOLOPOULOS K, GIANNELOS K & ASSIMAKOPOULOS V. 2007. Real estate valuation with artificial intelligence approaches.International Journal of Intelli-gent Systems Technologies and Applications,2(1) 50–57.
[26] RANGEL LAD & GOMES LFAM. 2007. Determinac¸˜ao do Valor de Referˆencia do Aluguel de Im´oveis Residenciais Empregando o M´etodo TODIM.Pesquisa Operacional,27(2): 357–372, Maio-Agosto.
[28] ˇSAPARAUSKASJ & TURSKISZ. 2006. Evaluation of construction sustainability by multiple criteria methods.Technological and Economic Development of Economy, XII(4): 21–326.
(http://www.tede.vgtu.lt).
[29] TAFFESEWZ. 2007. Case-based reasoning and neural networks for real estate valuation.Artificial Intelligence and Applications, 98–104.
[30] THEAPPRAISALINSTITUTE. 2008. The Appraisal of Real Estate, 13th Ed. Chicago: The Appraisal Institute.
[31] WORZALAE, LENKM & SILVAA. 1995. An Exploration of Neural Networks and Its Application to Real Estate Valuation.Journal of Real Estate Research,10: 185–201.