ACPD
13, 21427–21453, 2013Ozone recovery on tropospheric chemistry and air
quality
H. Zhang et al.
Title Page
Abstract Introduction
Conclusions References
Tables Figures
◭ ◮
◭ ◮
Back Close
Full Screen / Esc
Printer-friendly Version Interactive Discussion
Discussion
P
a
per
|
D
iscussion
P
a
per
|
Discussion
P
a
per
|
Discuss
ion
P
a
per
Atmos. Chem. Phys. Discuss., 13, 21427–21453, 2013 www.atmos-chem-phys-discuss.net/13/21427/2013/ doi:10.5194/acpd-13-21427-2013
© Author(s) 2013. CC Attribution 3.0 License.
Atmospheric Chemistry and Physics
Open Access
Discussions
Geoscientiic Geoscientiic
Geoscientiic Geoscientiic
This discussion paper is/has been under review for the journal Atmospheric Chemistry and Physics (ACP). Please refer to the corresponding final paper in ACP if available.
E
ff
ects of stratospheric ozone recovery
on tropospheric chemistry and air quality
H. Zhang1, S. Wu2, and Y. Wang3
1
Department of Geological and Mining Engineering and Sciences, Michigan Technological University, Houghton, Michigan, USA
2
Atmospheric Sciences Program, Department of Geological and Mining Engineering and Sciences and Department of Civil and Environmental Engineering, Michigan Technological University, Houghton, Michigan, USA
3
Ministry of Education Key Laboratory for Earth System Modeling, Center for Earth System Science, Institute for Global Change Studies, Tsinghua University, Beijing, China
Received: 14 July 2013 – Accepted: 24 July 2013 – Published: 20 August 2013
Correspondence to: S. Wu ([email protected])
ACPD
13, 21427–21453, 2013Ozone recovery on tropospheric chemistry and air
quality
H. Zhang et al.
Title Page
Abstract Introduction
Conclusions References
Tables Figures
◭ ◮
◭ ◮
Back Close
Full Screen / Esc
Printer-friendly Version Interactive Discussion
Discussion
P
a
per
|
D
iscussion
P
a
per
|
Discussion
P
a
per
|
Discuss
ion
P
a
per
|
Abstract
The stratospheric ozone has decreased greatly since 1980 due to ozone depleting substances (ODSs). As a result of the implementation of the Montreal Protocol and its amendments and adjustments, stratospheric ozone is expected to recover towards its pre-1980 level in the coming decades. We examine the implications of stratospheric
5
ozone recovery for the tropospheric chemistry and ozone air quality with a global chem-ical transport model (GEOS-Chem). Significant decreases in surface ozone photolysis rates due to stratospheric ozone recovery are simulated. Increases in ozone lifetime by up to 7 % are calculated in the troposphere. The global average OH decreases by 1.74 % and the global burden of tropospheric ozone increases by 0.78 %. The
per-10
turbations to tropospheirc ozone and surface ozone show large seasonal and spatial variations. General increases in surface ozone are calculated for each season, with increases by up to 5 % for some regions.
1 Introduction
Significant decreases in stratospheric ozone driven by ozone depleting substances
15
(ODSs), in particular over the high latitudes, have been observed since the 1980s (Far-man et al., 1985). The decreases in stratospheric ozone have allowed increasing solar UV radiation, especially the UV-B (280–315 nm) radiation to reach into the troposphere and Earth surface. Previous studies (McKenzie et al., 1991; Bais et al., 1993; Kerr and McElroy, 1993) have shown the general increases in ground-level solar UV-B radiation
20
associated with the reduction of stratospheric ozone at various sites around the world. Stratospheric ozone is expected to recover towards its pre-1980 level (generally de-fined as the ozone recovery level) due to the reduction in ODSs as a result of the im-plementation of Montreal Protocol as well as its Amendments and Adjustments (WMO, 2003). The change in solar UV-B radiation associated with the stratospheric ozone
25
ACPD
13, 21427–21453, 2013Ozone recovery on tropospheric chemistry and air
quality
H. Zhang et al.
Title Page
Abstract Introduction
Conclusions References
Tables Figures
◭ ◮
◭ ◮
Back Close
Full Screen / Esc
Printer-friendly Version Interactive Discussion
Discussion
P
a
per
|
D
iscussion
P
a
per
|
Discussion
P
a
per
|
Discuss
ion
P
a
per
of many tropospheric gas species. First, the photochemical destruction of tropospheric
ozone would be affected. The photolysis of ozone followed by reaction with water vapor
is the most important pathway for ozone destruction in the troposphere:
O3+hν(λ≤330 nm)→O2+O(1D) (R1)
O(1D)+H2O→OH+OH (R2)
5
The above reactions also provide the dominant source for hydroxyl radical (OH) in the troposphere which controls the oxidizing capacity of the troposphere and hence the lifetimes of many atmospheric species (Thompson, 1992). On the other hand, the
changes in UV radiation can also affect the photochemical production of ozone through
the photolysis of NO2:
10
NO2+hν(λ≤400 nm)→NO+O(3P) (R3)
O(3P)+O2→O3 (R4)
Liu and Trainer (1988) used a box model to study the response of tropospheric ozone
and OH to increasing UV radiation due to total zone reduction with fixed NOx
concen-tration. It was found that tropospheric ozone changes in the same direction as
col-15
umn ozone while in polluted regions, an inverse relationship was seen. In addition,
the change of tropospheric OH was independent of NOxlevel. Thompson et al. (1989)
also found that tropospheric ozone will increase with stratospheric ozone depletion at
high NOx level and decrease at low NOx level applying a one-dimension model.
Fu-glestvedt et al. (1994) found that the decline of stratospheric ozone would result in an
20
increase in tropospheric OH and a general reduction of tropospheric O3 using model
simulated stratospheric ozone. Schnell et al. (1991) showed that a 17 % decrease in measured surface ozone concentrations at the South Pole in the austral summer was mostly caused by the increases in surface radiation resulting from stratospheric ozone
hole where NOxlevel is low.
25
re-ACPD
13, 21427–21453, 2013Ozone recovery on tropospheric chemistry and air
quality
H. Zhang et al.
Title Page
Abstract Introduction
Conclusions References
Tables Figures
◭ ◮
◭ ◮
Back Close
Full Screen / Esc
Printer-friendly Version Interactive Discussion
Discussion
P
a
per
|
D
iscussion
P
a
per
|
Discussion
P
a
per
|
Discuss
ion
P
a
per
|
health problems (Desqueyroux et al., 2002; Peden, 2001) and damage vegetation and the ecosystem (Mauzerall and Wang, 2001; Oksanen and Holopainen, 2001). Because
of the inhomogeneous distribution of NOxand NMHCs and the nonlinear chemistry, the
response of ground level ozone to change in surface UV radiation should vary between
different locations depending on the NOxlevel as studied by (Isaksen et al., 2005).
5
In this study, we investigate the responses of tropospheric chemistry and surface ozone air quality to stratospheric ozone recovery by carrying out sensitivity studies with a global chemical transport model.
2 Methodology and model description
GEOS-Chem is a global 3-D chemical transport model, which is driven by
meteoro-10
logical data from the Goddard Earth Observing System (GEOS) of the NASA Global
Modeling and Assimilation office. Here we use GEOS-Chem version v8-03-01 driven
by GEOS-5 meteorology with temporal resolution of 6 h (3 h for surface meteorological variables).
In this study, the simulations are run at a resolution of 4◦ latitude by 5◦ longitude
15
with 47 vertical layers. We use the tropospheric Ozone-NOx-VOC full chemistry
sim-ulation with GEOS-Chem, which has been described in previous studies (Yuhang et al., 1998a, b; Wang et al., 1998). The Linoz stratospheric ozone chemistry pack-age (McLinden et al., 2000) is used. Photolysis rates in the troposphere are calculated
using fast-J mechanism, which takes into account the effects of clouds and aerosol on
20
photolysis rates (Wild et al., 2000). 7 wavelength bins with different widths cover the
wavelength range from 291 nm to 850 nm. Below 289 nm, Fast-J2 was developed to compute the photolysis rates in stratosphere (Bian and Prather, 2002).
To derive the sensitivity of troposphere photochemistry to stratospheric ozone recov-ery, two groups of simulations are performed: one as the control run and the other as
25
ACPD
13, 21427–21453, 2013Ozone recovery on tropospheric chemistry and air
quality
H. Zhang et al.
Title Page
Abstract Introduction
Conclusions References
Tables Figures
◭ ◮
◭ ◮
Back Close
Full Screen / Esc
Printer-friendly Version Interactive Discussion
Discussion
P
a
per
|
D
iscussion
P
a
per
|
Discussion
P
a
per
|
Discuss
ion
P
a
per
done followed by a three year simulation using meteorology for 2006 to 2008. Unless noted otherwise, all the model results discussed in this study refer to the 3 yr averages. We follow the WMO report (Randel, 2003; Fioletov, 2006) for the stratospheric ozone depletion in the past decades, which varies significantly with season and latitudes. The expected increases in stratospheric ozone column associated with the ozone recovery
5
in the coming decades are shown in Table 1.
3 Results
To quantify the responses of photolysis rates, tropospheric chemistry, and surface ozone to stratospheric ozone recovery, a sensitivity analysis was performed by using the sensitivity factor as defined by (Fuglestvedt et al., 1994):
10
SX = ∆X
X ∆PO3
PO 3
(1)
WhereX is the variable of interest (e.g, it can be the photolysis rates, concentrations
or global burden of any tropospheric species), PO3 is the total column ozone. ∆X
and∆PO3represents the differences between results from the sensitivity run and the
control run. Therefore, the value ofSx indicates the percentage change in X resulting
15
from 1 % increase in total ozone column.
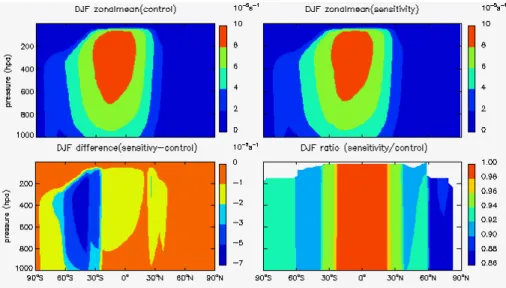
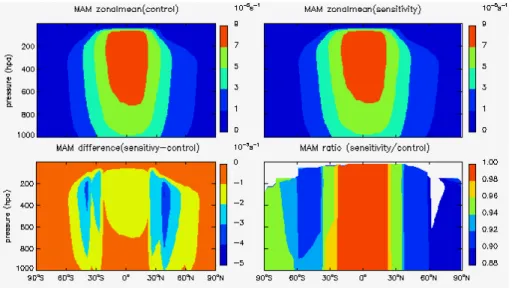
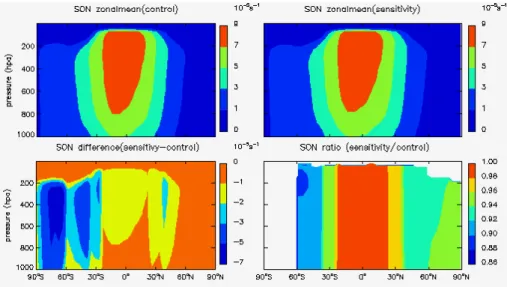
3.1 Impacts on photolysis rates in troposphere
The photolysis of O3 and NO2are critical for the chemical destruction and production
of troposphere ozone respectively, therefore we focus our analysis on the photolysis
rates of these two species –J(O3) and J(NO2). Figures 1 to 4 show the zonal mean
20
Ta-ACPD
13, 21427–21453, 2013Ozone recovery on tropospheric chemistry and air
quality
H. Zhang et al.
Title Page
Abstract Introduction
Conclusions References
Tables Figures
◭ ◮
◭ ◮
Back Close
Full Screen / Esc
Printer-friendly Version Interactive Discussion
Discussion
P
a
per
|
D
iscussion
P
a
per
|
Discussion
P
a
per
|
Discuss
ion
P
a
per
|
stratospheric ozone recovery as well as their sensitivity factors for different latitudes
and seasons. The largest percentage change of (JO3) by up to 22 % is found in spring
time over the southern polar region associated with the strong stratospheric ozone recovery expected.
All of the sensitivity factors show negative values indicating that the stratospheric
5
ozone recovery would lead to less solar radiation in the troposphere as expected. The
calculatedSx forJ(O3) is about 20–80 times greater thanSx forJ(NO2), reflecting the
different absorption spectrum for O3and NO2. This implies that the stratospheric ozone
recovery would have much stronger effects on the photochemical ozone destruction
than the ozone production in the troposphere. The absolute values forJ(O3) are always
10
larger than 1, implying that the percentage change ofJ(O3) would be always larger than
the percentage change for stratospheric ozone.
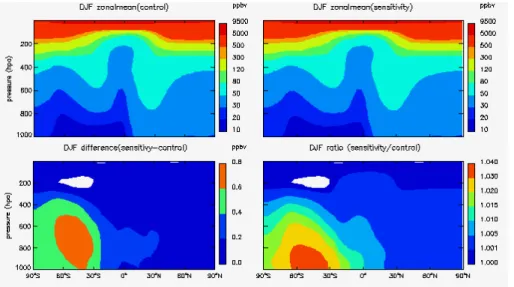
3.2 Impacts on tropospheric ozone and OH
Due to the reduced photolysis rates in the troposphere associated with the strato-sphere ozone recovery, the global tropospheric ozone burden is calculated to increase
15
by 0.78 % (from 383 Tg yr−1in the control run to 386 Tg yr−1in the sensitivity run). In the
mean time, the global average tropospheric OH concentration is found to decrease by
1.74 % (from 1.15×10⁶molecules cm−3in the control run to 1.13×10⁶molecules cm−3).
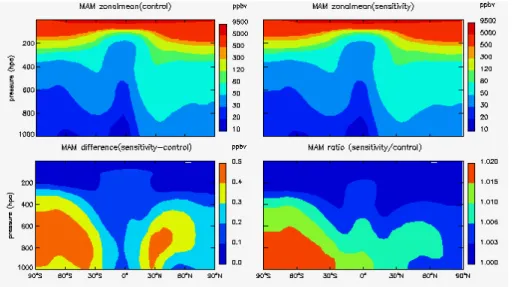
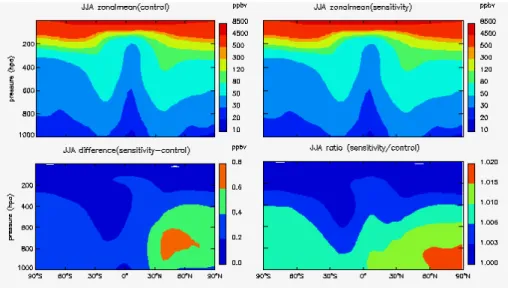
Figures 5 to 8 show the zonal mean concentrations for tropospheric ozone as well as the impacts due to stratospheric ozone recovery for each season. As we can see from
20
the figures, the effects of stratospheric ozone recovery present a seasonal and spatial
variation. O3concentration in the lower troposphere will be mostly affected. The largest
increases by up to 4 % are found in the lower troposphere over southern mid-latitudes in summer time.
Figures 9 and 10 show the annual mean surface OH concentration and annual zonal
25
tro-ACPD
13, 21427–21453, 2013Ozone recovery on tropospheric chemistry and air
quality
H. Zhang et al.
Title Page
Abstract Introduction
Conclusions References
Tables Figures
◭ ◮
◭ ◮
Back Close
Full Screen / Esc
Printer-friendly Version Interactive Discussion
Discussion
P
a
per
|
D
iscussion
P
a
per
|
Discussion
P
a
per
|
Discuss
ion
P
a
per
posphere also decreases, which should be also due to the less penetration of solar radiation into the troposphere.
The changes in photolysis rates of ozone would affect the life time of tropospheric
ozone against chemical destruction. The calculated average ozone lifetime in the tropo-sphere are 32.39 days and 32.79 days for control run and sensitivity run, respectively,
5
with a 1.23 % increase. In the lower troposphere over the oceans, the chemical lifetime of ozone increases by up to 7 %. The longer life time would enhance the intercontinen-tal transport of ozone.
3.3 Impacts on surface ozone air quality
General increases in surface ozone due to stratospheric ozone recovery are
calcu-10
lated for each season (Figs. 11 to 14). The largest increases (up to 5 %) are always found over remote ocean regions. The largest percentage change of surface ozone is found in summer time while the least change in winter time, reflecting the strongest photochemical activities during summer time.
4 Conclusions and discussions
15
We examine the potential impacts on tropospheric chemistry and ozone air quality from the expected stratospheric ozone recovery in the coming decades with a chemi-cal transport model. With the full recovery of stratospheric ozone to its pre-1980 level, we find significant decreases in photolysis rates for tropospheric ozone, with the
sur-face O3 photolysis rates decrease by up to 22 %. The sensitivity factor for surface
20
ozone photolysis rate, defined as the percentage changes in surface ozone photolysis rate for 1 % change in stratospheric ozone, is always larger than one. Compared to
tropospheric ozone, tropospheric NO2shows much weaker sensitivity to stratospheric
de-ACPD
13, 21427–21453, 2013Ozone recovery on tropospheric chemistry and air
quality
H. Zhang et al.
Title Page
Abstract Introduction
Conclusions References
Tables Figures
◭ ◮
◭ ◮
Back Close
Full Screen / Esc
Printer-friendly Version Interactive Discussion
Discussion
P
a
per
|
D
iscussion
P
a
per
|
Discussion
P
a
per
|
Discuss
ion
P
a
per
|
creases in both the photochemical destruction and production of tropospheric ozone, but the decreases in destruction would be much stronger than that for production.
The global tropospheric ozone burden is calculated to increase by 0.78 % while the average tropospheric OH concentration would decrease by 1.74 %. The perturbations to tropospheric chemistry and surface ozone show strong seasonal and spatial
varia-5
tions. The largest perturbations are generally found in the lower troposphere and dur-ing summer time when there are strong photochemical activities. General increases in surface ozone are calculated for each season associated with the stratospheric ozone recovery, in particular over oceans where surface ozone can increase by up to 5 % dur-ing summertime. The general increases in background ozone and the longer lifetime
10
of tropospheric ozone imply that the stratospheric ozone recovery would enhance the intercontinental transport of ozone pollution and therefore has significant implications for air quality policy and management.
In this sensitivity study, we focus on the effects of stratospheric ozone recovery on
tropospheric chemistry and ozone air quality through the changes in photochemical
15
reactions. The recovery of stratospheric ozone could also affect tropospheric ozone
by enhancing the ozone flux into the troposphere through stratosphere–troposphere
exchange (STE) (Zeng et al., 2010) but this effect is not accounted for in this study.
The STE effect could be particularly important for ozone in the upper troposphere while
our study show that the photochemical effect is very important for ozone in the lower
20
troposphere and surface air.
Acknowledgement. This work was initially inspired by a discussion with Daniel J. Jacob at Harvard University. This publication was made possible by US EPA grant (grant 83428601). Its contents are solely the responsibility of the grantee and do not necessarily represent the official views of the USEPA. Further, USEPA does not endorse the purchase of any commercial 25
ACPD
13, 21427–21453, 2013Ozone recovery on tropospheric chemistry and air
quality
H. Zhang et al.
Title Page
Abstract Introduction
Conclusions References
Tables Figures
◭ ◮
◭ ◮
Back Close
Full Screen / Esc
Printer-friendly Version Interactive Discussion
Discussion
P
a
per
|
D
iscussion
P
a
per
|
Discussion
P
a
per
|
Discuss
ion
P
a
per
References
Bais, A. F., Zerefos, C. S., Meleti, C., Ziomas, I. C., and Tourpali, K.: Spectral measurements of solar UVB radiation and its relations to total ozone, SO2, and clouds, J. Geophys. Res.-Atmos., 98, 5199–5204, doi:10.1029/92jd02904, 1993.
Bian, H. S. and Prather, M. J.: Fast-J2: accurate simulation of stratospheric photolysis in global 5
chemical models, J. Atmos. Chem., 41, 281–296, doi:10.1023/a:1014980619462, 2002. Desqueyroux, H., Pujet, J. C., Prosper, M., Squinazi, F., and Momas, I.: Short-term effects
of low-level air pollution on respiratory health of adults suffering from moderate to severe asthma, Environ. Res., 89, 29–37, doi:10.1006/enrs.2002.4357, 2002.
Farman, J. C., Gardiner, B. G., and Shanklin, J. D.: Large losses of total ozone in Antarctica 10
reveal seasonal ClOx/NOxinteraction, Nature, 315, 207–210, doi:10.1038/315207a0, 1985. Fuglestvedt, J. S., Jonson, J. E., and Isaksen, I. S. A.: Effects of reductions in stratospheric
ozone on tropospheric chemistry through changes in photolysis rates, Tellus B, 46, 172– 192, doi:10.1034/j.1600-0889.1992.t01-3-00001.x-i1, 1994.
Isaksen, I. S. A., Zerefos, C., Kourtidis, K., Meleti, C., Dalsoren, S. B., Sundet, J. K., Grini, A., 15
Zanis, P., and Balis, D.: Tropospheric ozone changes at unpolluted and semipolluted re-gions induced by stratospheric ozone changes, J. Geophys. Res.-Atmos., 110, D02302, doi:10.1029/2004jd004618, 2005.
Kerr, J. B. and McElroy, C. T.: Evidence for large upward trends of ultraviolet-B radiation linked to ozone depletion, Science, 262, 1032–1034, doi:10.1126/science.262.5136.1032, 1993. 20
Liu, S. C. and Trainer, M.: Responses of the tropospheric ozone and odd hydrogen radicals to column ozone change, J. Atmos. Chem., 6, 221–232, 1988.
Mauzerall, D. L. and Wang, X. P.: Protecting agricultural crops from the effects of tropospheric ozone exposure: reconciling science and standard setting in the United States, Europe, and Asia, Ann. Rev. Energ. Env., 26, 237–268, doi:10.1146/annurev.energy.26.1.237, 2001. 25
McKenzie, R. L., Matthews, W. A., and Johnston, P. V.: The relationship between erythemal UV and ozone, derived from spectral irradiance measurements, Geophys. Res. Lett., 18, 2269– 2272, doi:10.1029/91gl02786, 1991.
McLinden, C. A., Olsen, S. C., Hannegan, B., Wild, O., Prather, M. J., and Sundet, J.: Strato-spheric ozone in 3-D models: a simple chemistry and the cross-tropopause flux, J. Geophys. 30
ACPD
13, 21427–21453, 2013Ozone recovery on tropospheric chemistry and air
quality
H. Zhang et al.
Title Page
Abstract Introduction
Conclusions References
Tables Figures
◭ ◮
◭ ◮
Back Close
Full Screen / Esc
Printer-friendly Version Interactive Discussion
Discussion
P
a
per
|
D
iscussion
P
a
per
|
Discussion
P
a
per
|
Discuss
ion
P
a
per
|
Oksanen, E. and Holopainen, T.: Responses of two birch (Betula pendula Roth) clones to different ozone profiles with similar AOT40 exposure, Atmos. Environ., 35, 5245–5254, doi:10.1016/s1352-2310(01)00346-6, 2001.
Peden, D. B.: Air pollution in asthma: effect of pollutants on airway inflammation, Ann. Allerg. Asthma Im., 87, 12–17, 2001.
5
Schnell, R. C., Liu, S. C., Oltmans, S. J., Stone, R. S., Hofmann, D. J., Dutton, E. G., Desh-ler, T., Sturges, W. T., Harder, J. W., Sewell, S. D., Trainer, M., and Harris, J. M.: De-crease of summer tropospheric ozone concentrations in Antarctica, Nature, 351, 726–729, doi:10.1038/351726a0, 1991.
Thompson, A. M.: The oxidizing capacity of the Earths atmosphere – probable past and future 10
changes, Science, 256, 1157–1165, 1992.
Thompson, A. M., Stewart, R. W., Owens, M. A., and Herwehe, J. A.: Sensitivity of tropo-spheric oxidants to global chemical and climate change, Atmos. Environ., 23, 519–532, doi:10.1016/0004-6981(89)90001-2, 1989.
Wang, Y. H., Jacob, D. J., and Logan, J. A.: Global simulation of tropospheric O3-NOx -15
hydrocarbon chemistry 3. Origin of tropospheric ozone and effects of nonmethane hydro-carbons, J. Geophys. Res.-Atmos., 103, 10757–10767, 1998.
Wild, O., Zhu, X., and Prather, M. J.: Fast-J: accurate simulation of in- and below-cloud photolysis in tropospheric chemical models, J. Atmos. Chem., 37, 245–282, doi:10.1023/a:1006415919030, 2000.
20
Yuhang, W., Jacob, D. J., Logan, D. J., and Logan, J. A.: Global simulation of tropospheric O3-NOx-hydrocarbon chemistry. 1. Model formulation, J. Geophys. Res., 103, 10713–10725, doi:10.1029/98JD00158, 1998a.
Yuhang, W., Logan, J. A., and Jacob, D. J.: Global simulation of tropospheric O3-NOx -hydrocarbon chemistry. 2. Model evaluation and global ozone budget, J. Geophys. Res., 25
103, 10727–10755, doi:10.1029/98JD00157, 1998b.
ACPD
13, 21427–21453, 2013Ozone recovery on tropospheric chemistry and air
quality
H. Zhang et al.
Title Page
Abstract Introduction
Conclusions References
Tables Figures
◭ ◮
◭ ◮
Back Close
Full Screen / Esc
Printer-friendly Version Interactive Discussion
Discussion
P
a
per
|
D
iscussion
P
a
per
|
Discussion
P
a
per
|
Discuss
ion
P
a
per
Table 1.Increase in stratopsheric ozone column due to expected ozone recovery in the sensi-tivity run.
90◦ S–60◦
S 60◦ S–35◦
S 35◦ S–25◦
S 25◦ S–25◦
S 25◦ N–35◦
N 35◦ N–60◦
N 60◦ N–90◦
N
DJFa 4 % 6.3 % 3.15 % 1 % 2.8 % 5.6 % 12 % MAMa 4 % 5.4 % 2.7 % 1 % 3.0 % 6 % 8 % JJAa 16 % 5.9 % 2.95 % 1 % 1.75 % 3.5 % 4 % SONa 16 % 6.2 % 3.1 % 1 % 2.1 % 4.2 % 4 %
a
ACPD
13, 21427–21453, 2013Ozone recovery on tropospheric chemistry and air
quality
H. Zhang et al.
Title Page
Abstract Introduction
Conclusions References
Tables Figures
◭ ◮
◭ ◮
Back Close
Full Screen / Esc
Printer-friendly Version Interactive Discussion
Discussion
P
a
per
|
D
iscussion
P
a
per
|
Discussion
P
a
per
|
Discuss
ion
P
a
per
|
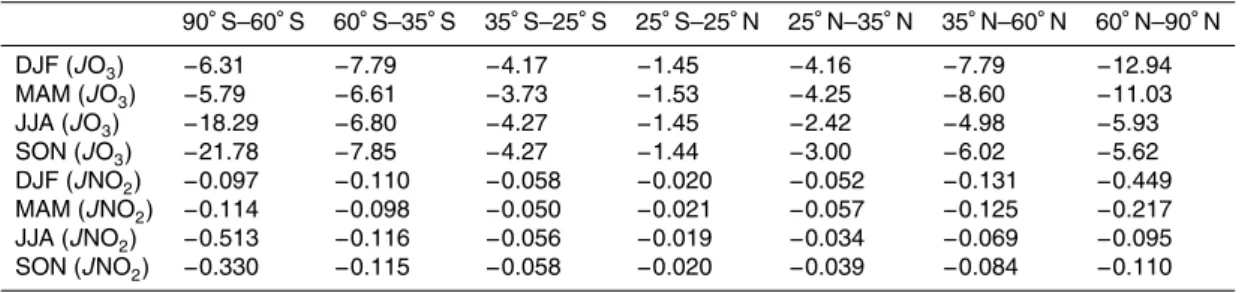
Table 2.Chang in surface O3 and NO2photolysis rates due to stratospheric ozone recovery (%).
90◦
S–60◦
S 60◦
S–35◦
S 35◦
S–25◦
S 25◦
S–25◦
N 25◦
N–35◦
N 35◦
N–60◦
N 60◦
N–90◦
N
DJF (JO3) −6.31 −7.79 −4.17 −1.45 −4.16 −7.79 −12.94
MAM (JO3) −5.79 −6.61 −3.73 −1.53 −4.25 −8.60 −11.03
JJA (JO3) −18.29 −6.80 −4.27 −1.45 −2.42 −4.98 −5.93
SON (JO3) −21.78 −7.85 −4.27 −1.44 −3.00 −6.02 −5.62
DJF (JNO2) −0.097 −0.110 −0.058 −0.020 −0.052 −0.131 −0.449
MAM (JNO2) −0.114 −0.098 −0.050 −0.021 −0.057 −0.125 −0.217
JJA (JNO2) −0.513 −0.116 −0.056 −0.019 −0.034 −0.069 −0.095
ACPD
13, 21427–21453, 2013Ozone recovery on tropospheric chemistry and air
quality
H. Zhang et al.
Title Page
Abstract Introduction
Conclusions References
Tables Figures
◭ ◮
◭ ◮
Back Close
Full Screen / Esc
Printer-friendly Version Interactive Discussion
Discussion
P
a
per
|
D
iscussion
P
a
per
|
Discussion
P
a
per
|
Discuss
ion
P
a
per
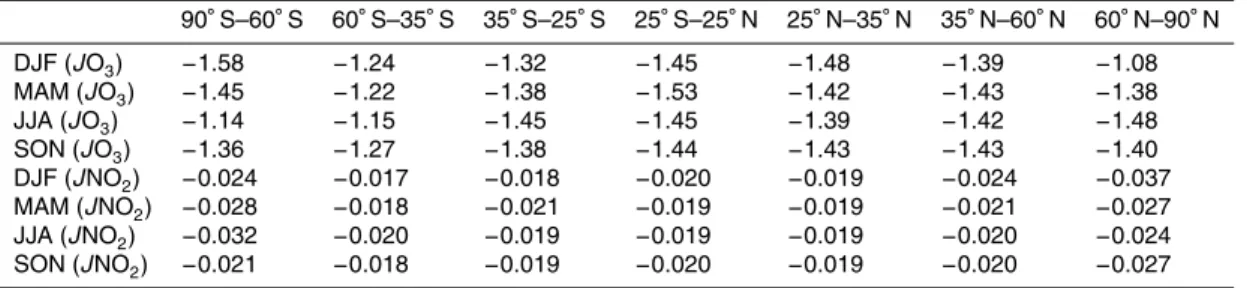
Table 3.Sensitivity factors of average surfaceJ(O3) andJ(NO2).
90◦
S–60◦
S 60◦
S–35◦
S 35◦
S–25◦
S 25◦
S–25◦
N 25◦
N–35◦
N 35◦
N–60◦
N 60◦
N–90◦
N
DJF (JO3) −1.58 −1.24 −1.32 −1.45 −1.48 −1.39 −1.08
MAM (JO3) −1.45 −1.22 −1.38 −1.53 −1.42 −1.43 −1.38
JJA (JO3) −1.14 −1.15 −1.45 −1.45 −1.39 −1.42 −1.48
SON (JO3) −1.36 −1.27 −1.38 −1.44 −1.43 −1.43 −1.40
DJF (JNO2) −0.024 −0.017 −0.018 −0.020 −0.019 −0.024 −0.037
MAM (JNO2) −0.028 −0.018 −0.021 −0.019 −0.019 −0.021 −0.027
JJA (JNO2) −0.032 −0.020 −0.019 −0.019 −0.019 −0.020 −0.024
ACPD
13, 21427–21453, 2013Ozone recovery on tropospheric chemistry and air
quality
H. Zhang et al.
Title Page
Abstract Introduction
Conclusions References
Tables Figures
◭ ◮
◭ ◮
Back Close
Full Screen / Esc
Printer-friendly Version Interactive Discussion
Discussion
P
a
per
|
D
iscussion
P
a
per
|
Discussion
P
a
per
|
Discuss
ion
P
a
per
|
ACPD
13, 21427–21453, 2013Ozone recovery on tropospheric chemistry and air
quality
H. Zhang et al.
Title Page
Abstract Introduction
Conclusions References
Tables Figures
◭ ◮
◭ ◮
Back Close
Full Screen / Esc
Printer-friendly Version Interactive Discussion
Discussion
P
a
per
|
D
iscussion
P
a
per
|
Discussion
P
a
per
|
Discuss
ion
P
a
per
|
ACPD
13, 21427–21453, 2013Ozone recovery on tropospheric chemistry and air
quality
H. Zhang et al.
Title Page
Abstract Introduction
Conclusions References
Tables Figures
◭ ◮
◭ ◮
Back Close
Full Screen / Esc
Printer-friendly Version Interactive Discussion
Discussion
P
a
per
|
D
iscussion
P
a
per
|
Discussion
P
a
per
|
Discuss
ion
P
a
per
|
ACPD
13, 21427–21453, 2013Ozone recovery on tropospheric chemistry and air
quality
H. Zhang et al.
Title Page
Abstract Introduction
Conclusions References
Tables Figures
◭ ◮
◭ ◮
Back Close
Full Screen / Esc
Printer-friendly Version Interactive Discussion
Discussion
P
a
per
|
D
iscussion
P
a
per
|
Discussion
P
a
per
|
Discuss
ion
P
a
per
|
ACPD
13, 21427–21453, 2013Ozone recovery on tropospheric chemistry and air
quality
H. Zhang et al.
Title Page
Abstract Introduction
Conclusions References
Tables Figures
◭ ◮
◭ ◮
Back Close
Full Screen / Esc
Printer-friendly Version Interactive Discussion
Discussion
P
a
per
|
D
iscussion
P
a
per
|
Discussion
P
a
per
|
Discuss
ion
P
a
per
|
ACPD
13, 21427–21453, 2013Ozone recovery on tropospheric chemistry and air
quality
H. Zhang et al.
Title Page
Abstract Introduction
Conclusions References
Tables Figures
◭ ◮
◭ ◮
Back Close
Full Screen / Esc
Printer-friendly Version Interactive Discussion
Discussion
P
a
per
|
D
iscussion
P
a
per
|
Discussion
P
a
per
|
Discuss
ion
P
a
per
|
ACPD
13, 21427–21453, 2013Ozone recovery on tropospheric chemistry and air
quality
H. Zhang et al.
Title Page
Abstract Introduction
Conclusions References
Tables Figures
◭ ◮
◭ ◮
Back Close
Full Screen / Esc
Printer-friendly Version Interactive Discussion
Discussion
P
a
per
|
D
iscussion
P
a
per
|
Discussion
P
a
per
|
Discuss
ion
P
a
per
|
ACPD
13, 21427–21453, 2013Ozone recovery on tropospheric chemistry and air
quality
H. Zhang et al.
Title Page
Abstract Introduction
Conclusions References
Tables Figures
◭ ◮
◭ ◮
Back Close
Full Screen / Esc
Printer-friendly Version Interactive Discussion
Discussion
P
a
per
|
D
iscussion
P
a
per
|
Discussion
P
a
per
|
Discuss
ion
P
a
per