ISSN 0104-6632 Printed in Brazil
www.abeq.org.br/bjche
Vol. 26, No. 03, pp. 583 - 594, July - September, 2009
Brazilian Journal
of Chemical
Engineering
NUMERICAL SIMULATION OF SECONDARY
FLOW IN PNEUMATIC CONVEYING OF SOLID
PARTICLES IN A HORIZONTAL CIRCULAR PIPE
S. Laín
1*, M. Sommerfeld
2and B. Quintero
11Universidad Autónoma de Occidente, Energetics and Mechanics Department, Fluid Mechanics Research Group,
Calle 25 No 115-85, Santiago de Cali, Colombia.
E-mail: [email protected], [email protected], E-mail: [email protected]
2Martin-Luther Universität Halle-Wittenberg, Zentrum für Verfahrenstechnik,
FB IW, 06099 Halle (Saale), Germany. E-mail: [email protected]
(Submitted: March 18, 2008 ; Revised: March 3, 2009 ; Accepted: March 28, 2009)
Abstract - Under certain conditions, a fully developed turbulent flow in a straight pipe may show a secondary flow; for instance, when non-circular cross-section or non-uniform wall roughness around the perimeter of the duct are considered. In horizontal pipe particle-laden gas flow, the non-uniform forcing of the flow by the solids entrained in the gas core may also drive a secondary flow, even with uniform wall roughness along the circumferential direction. In this paper, the effects of wall roughness, particle size and particle mass loading ratio on the secondary flow developing in a horizontal pipe of circular cross-section under turbulent conditions are analysed. The computations are based on the Euler-Lagrange approach accounting for wall roughness and particle collisions (i.e., four-way coupling). In the case of inertial particles, if inter-particle collisions are disregarded, the secondary flow consists of two recirculation cells with an upward flow near the vertical (symmetry) axis and a downward flow close to the walls. On the other hand, when inter-particle collisions are accounted for, the pattern depends on the inter-particle concentration profile: with relatively smooth walls (low roughness), two recirculation cells are found, but with rough walls four recirculation cells are generated. For smaller particles, a transition between two and four recirculation cells in the secondary flow is observed by increasing the mass loading ratio.
Keywords: Secondary flow; Pneumatic conveying; Four-way coupling; Horizontal pipe; Turbulence.
INTRODUCTION
It is known that, under certain conditions, a fully developed turbulent flow in a straight pipe may show a secondary flow. For instance, two conditions under which secondary flow will occur are a non-circular cross-section (Speziale, 1982) and non-uniformwall roughness around the perimeter of the duct (Darling and McManus, 1968). In horizontal pipe particleladen gas flow, however, the non-uniform forcing of the flow by the solids entrained in the gas core may also drive a secondary flow, even if uniform wall roughness along the circumferential direction is
Belt et al. (2004) studied the secondary flow in a horizontal pipe flow of circular cross-section in a simplified test case with LES. In that configuration, the effect of particles is introduced with a non-uniform distribution of fixed particles in one-phase turbulent horizontal pipe flow. They found a secondary flow with direction opposed to the one induced by a non-uniform wall roughness and showed that it can be explained by the changes in the Reynolds stresses due to the presence of particles. Following these authors, these changes are caused by ‘direct’ and ‘indirect’ effects. The direct effects are due to the particle-fluid interaction (acting locally around the particles) and the indirect effects due to the global modification of the mean axial velocity profile, promoted by the changes in the shear stress required to compensate the drag of the particles, which in turn promotes a change in the production of turbulent kinetic energy and Reynolds stresses. In a later paper, the same authors (Belt et al., 2005), using DNS in conjunction with a non-uniform distribution of fixed point-particles with linear (Stokes) drag, investigated the relation between the indirect turbulence modification promoted by the particles and the occurrence of secondary flow. They concluded that it is determined by the pattern of radial and circumferential Reynolds stresses, whose gradients are the dominant terms in the divergence of the Reynolds stress tensor. They also compared different configurations of particle forcing and showed that there are two main mechanisms determining the pattern of the Reynolds stresses in the pipe cross-section: a ‘blockage’ effect, associated with the global modification of the mean axial velocity profile, and a ‘roughness-like’ effect, associated with the changes in the Reynolds stress promoted by the presence of a cloud of particles, similar to the Reynolds stress modification induced by a rough wall. The ‘blockage’ tends to reduce whereas the ‘roughness’ tends to increase the production of turbulent kinetic energy and Reynolds stresses, so the pattern of the secondary flow depends on the distribution and intensity of the particle forcing. Recently, Daalmans (2005) performed LDA measurements with a non-uniform distribution of fixed particles in a horizontal pipe flow, allowing them to validate the conclusions from the DNS simulations. Nevertheless, these previous studies, although important from a basic point of view, can be regarded as a modified single-phase flow and do not provide much insight about the effect of the particle dynamics on the pattern of the secondary flow. Moreover, the simplifications in such DNS computations are rarely met in two-phase
industrial flows. For instance, keeping the particles fixed implies disregard of the effect of inter-particle interactions on the secondary flow pattern. Also, the assumed particle Reynolds numbers lower than one are only rarely encountered in relevant two-phase flows. Therefore, it is needed to investigate the influence of the dynamics of the particle phase on the secondary flow pattern developing in a circular pipe, a task that is performed in the present paper.
The present paper numerically quantifies the effect of wall roughness, particle size and particle mass loading ratio on the secondary flow developing in a horizontal pipe of circular cross-section under turbulent conditions. The computations are based on the Euler-Lagrange approach accounting for wall roughness and inter-particle collisions (i.e., four-way coupling), discussing the effect of them on the pattern of secondary flow. As a matter of fact, the strength of the secondary flow increases with wall roughness and mass loading ratio as was observed by Huber and Sommerfeld (1998). Also, the pattern of the secondary flow depends on the wall roughness: for low roughness we find two recirculation cells, whereas for higher roughness four cells are obtained. Unfortunately, up to now the authors are not aware of any experiment devoted to measure and quantify the secondary flow induced by moving particles, so this paper presents only the numerical results.
SUMMARY OF NUMERICAL APPROACH
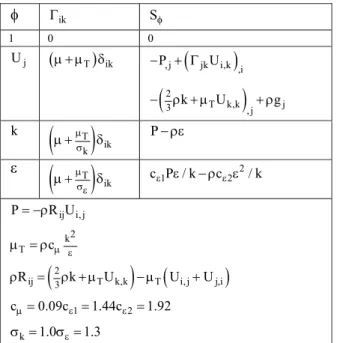
The numerical scheme adopted to simulate the two-phase flow developing in a horizontal channel has been the fully coupled stationary and three-dimensional Euler/Lagrange approach (Laín et al., 2002). The fluid flow was calculated based on the Euler approach by solving the Reynolds-averaged conservation equations in connection with the k − ε turbulence model equations, which were extended in order to account for the effects of the dispersed phase, i.e., two-way coupling (Kohnen and Sommerfeld, 1997). The time-dependent three-dimensional conservation equations for the fluid may be written in the general form (using tensorial notation) as:
additional source term due to phase interaction. Table 1 summarizes the meaning of these quantities for the different variables φ, where P is the mean pressure, μ the dynamic gas viscosity and
' ' jl j l
R = u u the components of the Reynolds stress tensor. The simulation of the particle phase by the Lagrangian approach requires the solution of the equation of motion for each computational particle. This equation includes the particle inertia, drag, gravity-buoyancy, shear lift force and slip-rotational lift force.
Table 1: Summary of terms in the general equation for the different variables that describe the gas phase k −ε model.
φ Γik Sφ
1 0 0
j
U
(
μ + μ δT)
ik(
)
(
)
, j jk i,k ,i
2
T k,k j
3 , j
P U
k U g
− + Γ
− ρ + μ + ρ
k
( )
Tik k μ σ
μ + δ P−ρε
ε
( )
Tik μ σε
μ + δ c P / kε1 ε −ρ εcε2 2/ k
ij i, j
P= −ρR U
2 k T cμ ε
μ = ρ
(
2)
(
)
ij 3 T k,k T i, j j,i
R k U U U
ρ = ρ +μ −μ +
1 2
cμ=0.09cε =1.44cε =1.92 k 1.0 ε 1.3
σ = σ =
The Basset history term, the added mass and the fluid inertia are negligible for high ratios of particle to gas densities (Crowe et al., 1998). The change of the angular velocity along the particle trajectory results from wall collisions and the viscous interaction with the fluid (i.e., the torque T). Hence, the equations of motion for the particles are given by:
p i p i dx
u
dt = (2)
(
)
p i 3
p 4 p D i p i p
p p
p i ls i lr i
p du
m m c u u u u
dt D
m g 1 F F
ρ
= − − +
ρ
⎛ ρ ⎞
− + +
⎜ ⎟
⎜ ρ ⎟
⎝ ⎠ G G (3) p i p i d I T dt ω
= (4)
Here, xp i are the coordinates of the particle position, up I are its velocity components, ui = Ui+ui’ are the components of the instantaneous velocity of the gas, Dp is the particle diameter and ρp is the density of the solids. mp = (π/6)ρpD3p is the particle mass and Ip = 0.1mpD2p is the moment of inertia for a sphere. The drag coefficient is obtained using the standard correlation:
(
)
1 0.687
p p p
D
p 24 Re 1 0.15 Re Re 1000 c
0.44 Re 1000
− ⎧ + ≤ ⎪ = ⎨ > ⎪ ⎩ (5)
where Rep = ρDp|u − up|/μ is the particle Reynolds number.
The slip-shear force is based on the analytical result of Saffman (1965) and extended for higher particle Reynolds numbers according to Mei (1992):
(
p)
1/2
ls p s ls
u u F =1.615D μRe c ⎡⎣ − ×ω⎤⎦
ω
G G G G
G (6)
where ω = ×u is the fluid rotation, Res = ρD2 p|ω|/μ is the particle Reynolds number of the shear flow and cls = Fls/Fls,Saff represents the ratio of the extended lift force to the Saffman force:
(
)
( )
p Re /10 0.5 0.5 p ls 0.5 p p1 0.3314 e +0.3314 Re 40 c
0.0524 Re Re 40
−
⎧ − β β ≤
⎪ = ⎨
⎪ β >
⎩
(7)
And is a parameter given by = 0.5Res/Rep (0.005 < < 0.4).
The applied slip-rotational lift force is based on the relation given by Rubinow and Keller (1961), which was extended to account for the relative motion between particle and fluid.
(
)
p 3
lr p lr p
r Re
F D c u u
8 Re
π ⎡ ⎤
= ρ ⎣Ω × −G ⎦
G G G
(8)
r p p ls r p p p Re Re 1 Re c Re 0.522
0.178 0.822Re 1< Re 1000 Re ⎛⎜⎝ ⎞⎟⎠
⎧ ≤
⎪⎪ = ⎨
−
⎪ + <
⎪⎩
(9)
For the torque acting on a rotating particle the expression of Rubinow and Keller (1961) was extended to account for the relative motion between fluid and particle and higher Reynolds numbers:
5 p R D T c 2 2 ⎛ ⎞ ρ
= ⎜ ⎟ Ω Ω
⎝ ⎠
G G G
(10)
where the coefficient of rotation is obtained from Rubinow and Keller (1961) and direct numerical simulations of Dennis et al. (1980) in the following way: r r R r 0.5 r r 64 Re 32 Re c 12.9 128.4
+ 32< Re 1000
Re Re π ⎧ ≤ ⎪⎪ = ⎨ ⎪ < ⎪⎩ (11)
The equations to calculate the particle motion are solved by integration of the differential equations (Eqs. 2-4). For sufficiently small time steps and assuming that the forces remain constant during this time step, the new particle location and the linear and angular velocities are calculated. The time step for the particle tracking was chosen to be 50 % of the smallest of all relevant time scales, such as the particle relaxation time, the integral time scale of turbulence and the mean inter-particle collision time, which is enough to avoid numerical instabilities (Göz et al., 2004).
Following the approach of Sommerfeld et al. (1993), the instantaneous fluctuating fluid velocities seen by the solids are built according to the following Langevin equation:
(
)
(
)
n 1 n 2
i P,i i f P,i i
u' + =R Δ Δt, r u' + σ 1 R− Δ Δt, r dW (12) where the superscripts denote the time step and the subscripts the spatial component. Δt is the aforementioned Lagrangian time step and Δr is the distance between the fluid particle and the actual solid particle after the time Δt. σf =(2k/3)1/2 is the rms value of the fluid velocity and dWi denote independent Wiener processes with zero mean and unit variance.
The correlation functions RP, i have Lagrangian and Eulerian components:
(
)
( )
( )
P,i L E,ii
R Δ Δ =t, r R Δt R Δr (13)
where no sum is understood in the repeated index i. The Lagrangian correlation is an exponential depending on the Lagrangian integral time scale TL:
( )
2fL L T
L t
R t exp ; T C T
⎛ Δ ⎞ σ
Δ = ⎜− ⎟ =
ε
⎝ ⎠ (14)
with CT = 0.24. The Eulerian correlation functions are expressed as:
( )
{
( ) ( )
}
( )
( )
( )
i j
EE,ij 2 ij
E
E E
r r
R r f r g r g r
r r
f r exp ;
L
r r
g r 1 exp
2L L
Δ Δ
Δ = Δ − Δ + Δ δ
Δ ⎛ Δ ⎞
Δ = ⎜− ⎟
⎝ ⎠
⎛ Δ ⎞ ⎛ Δ ⎞
Δ = −⎜ ⎟ ⎜− ⎟
⎝ ⎠ ⎝ ⎠
(15)
with the Eulerian length scale LE = CLTLσf and CL = 3.0.
When a particle collides with a wall, the wall collision model provides the new particle linear and angular velocities and the new location in the computational domain after rebound. The applied wall collision model, accounting for wall roughness, is described in Sommerfeld and Huber (1999). The wall roughness seen by the particle is simulated assuming that the impact angle is composed of the particle trajectory angle plus a stochastic contribution due to wall roughness, sampled from a normal distribution with a standard deviation Δ , which depends on the structure of wall roughness and particle size. In the present calculations, using monodispersed particles of two different diameters, the value of Δ is varied in order to study its effect on the secondary flow induced by the solid particles.
Suggested by former experiments (Sommerfeld and Huber, 1999), the particle-wall restitution, ew, and friction, μw, coefficients depend on the impact angle α. In this study, and suggested by the mentioned experiments, they are expressed as:
(
)
(
)
w
w
e max 0.8,1 0.01 ;
max 0.1,0.4 0.015
= − α
Inter-particle collisions are modelled by the stochastic approach described in detail by Sommerfeld (2001). This model relies on the generation of a fictitious collision partner and accounts for a possible correlation of the velocities of colliding particles in turbulent flows. For the particle-particle collisions, the restitution coefficient has been taken as a constant equal to 0.9 and the static and dynamic friction coefficients were chosen to be 0.4.
INFLUENCE OF PARTICLES ON THE CARRIER FLOW
The standard expression for the momentum equation source term due to the particles has been used. It is obtained by time and ensemble averaging of the particle trajectories for each control volume in the following form:
(
)
ip
U k k
cv k
n 1 n
p i k p i k i L
p n
1
S m N
V
u + u g 1 t
= − ×
⎧ ⎛ ρ ⎞ ⎫
⎪ ⎡ ⎤ −⎡ ⎤ − ⎜ − ⎟Δ ⎪
⎨ ⎣ ⎦ ⎣ ⎦ ⎜ ρ ⎟ ⎬
⎪ ⎝ ⎠ ⎪
⎩ ⎭
∑
∑
(16)
where the sum over n indicates averaging along the particle trajectory (time averaging) and the sum over k is related to the number of computational particles passing the considered control volume with the volume Vcv. The mass of an individual particle is mk and Nk is the number of real particles in one computational particle. ΔtL is the Lagrangian time step, which is used in the solution of Eq. (3).
The source term in the conservation equation of k variable is expressed in the Reynolds average procedure as:
jp jp
k j U j U
S =u S −U S (17)
While the source term in the ε-equation is modeled in the standard way:
p 3 kp
S C S
k
ε = ε ε (18)
with Cε3 = 1.8 and the sum is implicit in the repeated sub-index j.
FLOW CONFIGURATION AND SIMULATION CONDITIONS
The chosen flow configuration has been the horizontal pipe two-phase flow of Tsuji and Morikawa (1982). The cylindrical glass pipe had a total length of 4000 mm and an inner diameter of 30.5 mm. The test section was situated at 3560 mm from the entrance. Tsuji and Morikawa used plastic pellets with density ρp = 1020 kg/m3 and diameters of 0.2 and, 3.5 mm in their experiment. Full details about the experimental facility and measurement technique can be found in the original paper (Tsuji and Morikawa, 1982). From that set of experiments, the case with gas bulk velocity U0 =10 m/s, particles of diameter 0.2 mm and mass loading ratio η0 =2.2 has been selected as a base case.
The x-axis coincides with the pipe symmetry axis, the y-axis is aligned with the gravity direction and the z-axis is orthogonal to both. The curved surfaces of the cylinder are defined to be walls in the simulation whereas the left side was specified as an inlet and the right part as an outlet boundary condition. The inlet profile for the mean horizontal gas velocity was uniform corresponding to the experimental bulk velocity, i.e., 10 m/s. The inlet values for the turbulent quantities were also uniform and made equal to 1 m2/s2 for the turbulent kinetic energy. However, its exact value is not very relevant as long as the single-phase flow reaches a fully developed state (i.e., L/D > 131) before the measuring location.
Solid particles are injected at the inlet with the same mean velocity as the fluid bulk velocity and with a prescribed mass loading. The injection velocities are sampled from a Gaussian distribution with fixed mean and rms velocities. The exact values employed were the following: for the horizontal velocity, mean = 10 m/s and rms = 0.5 m/s; for the vertical and azimuthal velocities, mean = 0 m/s and rms = 0.5 m/s. The particles experience particle-wall and inter-particle collisions along their trajectories and they leave the computational domain at the outlet.
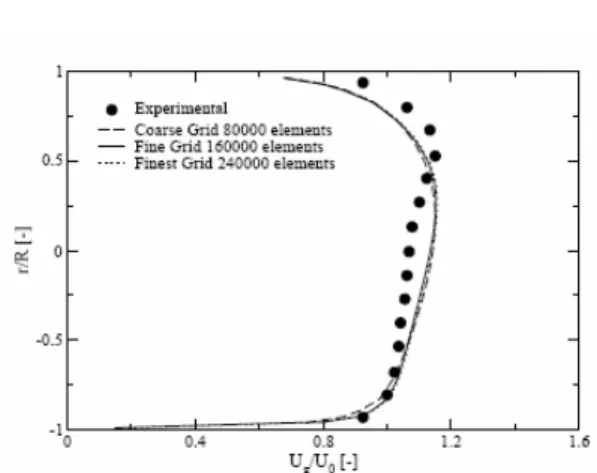
Figure 1: Dependency of the two-phase flow mean gas velocity with grid density (results for the base case of Tsuji and Morikawa (1982)).
A converged solution of the strongly coupled two-phase flow system is obtained by successive solution of the Eulerian and Lagrangian part, respectively. Initially, the flow field is calculated without particle phase source terms until a converged solution is achieved. Thereafter, a large number of parcels are tracked through the flow field (typically 240,000) and the source terms are sampled. In this first Lagrangian calculation, inter-particle collisions are not calculated, since the required particle phase properties are not yet available. Hence, for each control volume the particle concentration, the local particle size distribution and the size-velocity correlations for the mean velocities and the rms values are sampled when a computational particle crosses this location. These properties are updated each Lagrangian iteration in order to allow correct calculation of inter-particle collisions. From the second Eulerian calculation, the source terms of the dispersed phase are introduced using an under-relaxation procedure (Kohnen et al., 1994). For the present calculations typically about 25 to 35 coupling iterations with an under-relaxation factor between 0.5 and 0.1 were necessary in order to get full convergence. It should be pointed out that the cases with the highest loading ratios needed stronger under-relaxation resulting in an increase of the number of Euler-Lagrange iterations. A typical run took around three days on a 3.8 GHz Intel Pentium IV processor.
RESULTS AND DISCUSSION
In first place the performance of the presented numerical approach is briefly illustrated for the base case from the Tsuji and Morikawa experiments, i.e.,
gas bulk velocity U0 =10 m/s, particles of diameter 0.2mm and mass loading ratio η0 =2.2. Figure 2 presents the results for the mean velocities of both phases (gas and particles) at the location x = 3.56 m from the entrance, obtained with four-way coupling (i.e., considering inter-particle collisions) and a wall roughness parameter Δ = 1.5o. In the particle mean velocities the results obtained using two-way coupling (i.e, disregarding inter-particle collisions) are also presented, showing the expected behaviour that the particle conveying velocity is slightly lower when inter-particle collisions are considered. The calculations show reasonably good agreement with the measurements. In this respect, the values of the present computations are similar to others found in the literature, e.g. Zhu et al. (2004).
Figure 2: Mean velocities for the fluid (upper graph) and particles (bottom graph) in the base case considered of the Tsuji and Morikawa (1982) experiment. Δ = 1.5o.
Figure 3: Mean gas velocities for the single-phase flow at the location 3.56 m
from the pipe inlet. U0 = 10 m/s.
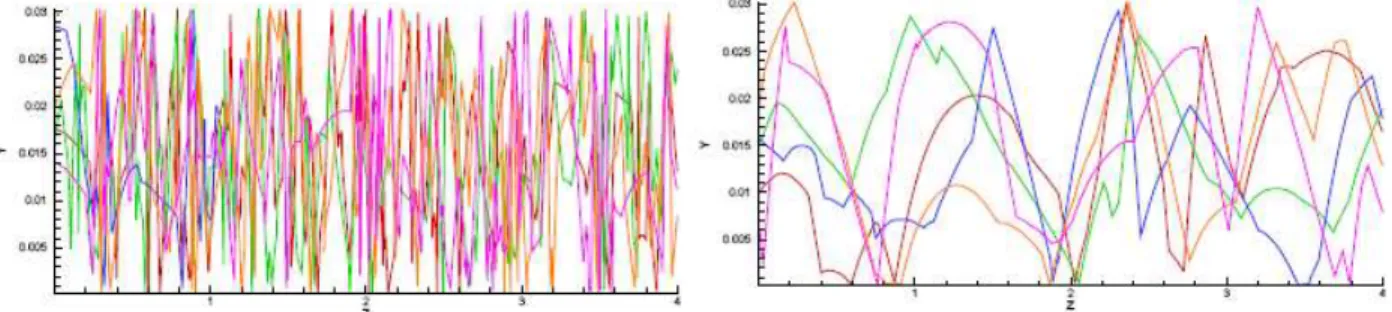
Figure 4: Cross-sectional projection of particle trajectories for the 200 μm particles.Δ = 10 o (up)
and Δ = 1.5 o (bottom).
Figure 5: Vertical projection of particle trajectories for the 200 μm particles. Δ = 10 o (up) and Δ = 1.5 o (bottom). In the following, the pattern of the induced
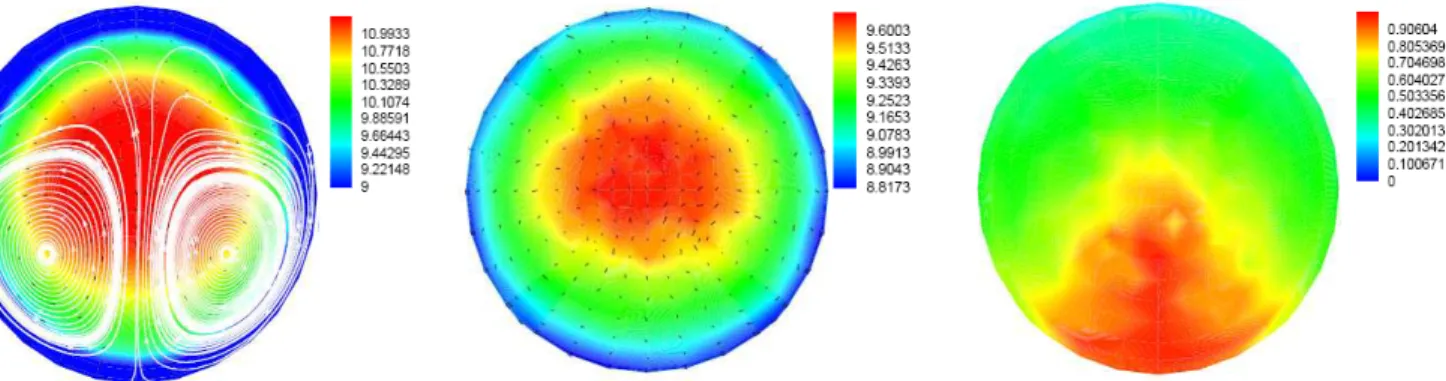
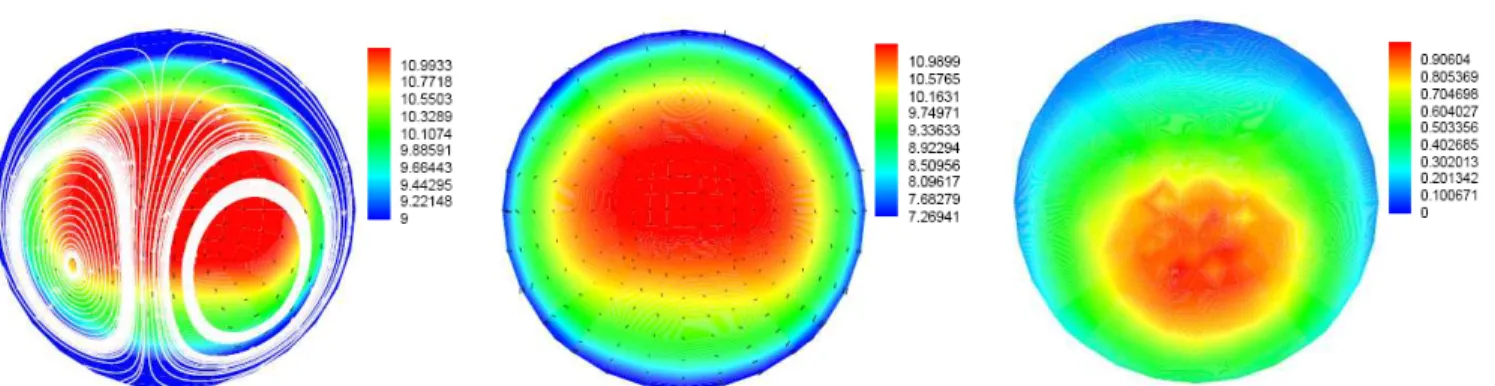
secondary flow in the gas phase by the particles is examined under different situations. In short, the influence of the following physical parameters is evaluated: particle diameter, Dp; wall roughness parameter, Δ ; degree of coupling between the phases, two-way versus four-way coupling; and particle mass loading ratio η. All the results are presented for the cross-section located at 3.56 m from the pipe inlet and bulk conveying velocity U0 = 10 m/s. The Figures 6 to 13 present the results in the same format: the upper contour plot comprises the gas mean axial velocity and the streamlines of the secondary flow, the middle graph shows the mean axial particle velocity and the lower plot presents the normalized particle mass concentration along the cross-section.
In the first case, a particle diameter of Dp = 200 μm and particle mass loading ratio η0 = 2.2 are considered (i.e., the same as in the Tsuji and Morikawa experiments). Figures 6 and 7 show the results obtained considering inter-particle collisions (i.e., four-way coupling) with roughness parameters Δ = 1.5 o and 10 o, respectively. These particles are quite inertial; therefore, it is expected that their dynamics are governed by particle-wall and inter-particle collisions, the turbulent fluid-particle interaction playing a minor role. The secondary flow in Figure 6 (top) clearly
presents two fairly symmetric recirculation zones with the maximum mean fluid velocity displaced towards the upper half of the pipe cross-section.
This effect is due to the fact that wall roughness is low and hence unable to resuspend the particles efficiently (Laín et al., 2002). Consequently, the particle concentration (Figure 6, bottom) has its maximum in the lower half of the pipe cross-section due to the gravitational settling. Moreover, the pipe wall curvature results in a ‘focusing’ of the rebound particle trajectories towards the pipe centreline, which explains the high values of particle mass concentration near and below the pipe symmetry axis. Additionally, the higher concentration in this area supports the occurrence of inter-particle collisions. These effects are related to a locally higher momentum transfer to the gas phase in the lower half and the secondary flow develops in the pipe cross-section. However, the intensity of this secondary flow is, in this case, quite low, around 0.2 % of the gas bulk velocity. The mean particle axial velocity contour plot (Figure 6, middle) resembles that of the gas phase, having its maximum in the upper half of the pipe cross-section.
those in Figure 6. The top graph in Figure 7 shows that the induced secondary flow has four recirculation zones instead of the two seen before. This fact is due to the more even distribution of the particles across the pipe section (Figure 7, bottom). In this case the particles bounce from wall to wall (see Figs. 4 and 5), also experiencing inter-particle collisions, resulting in an enhancement of momentum loss of the particles and, hence, a lower value of the mean particle velocity (Figure 7, middle) with respect to the lower roughness case. Therefore, the number of particle wall collisions with the upper wall is increased (being comparable to that with the lower wall) inducing the two extra recirculation cells in the gas secondary flow. A clear saddle node can be seen, which is slightly displaced towards the left side. Moreover, due to the quasi-uniform concentration of particles, the maximum of the mean axial gas and particle velocities is located in the pipe center. However, the contours of mean velocity are elongated along the horizontal direction.
Another feature is that the particle mean velocity is nearly uniform across the pipe cross-section.
An intermediate wall roughness is considered in Figures 8-9, i.e. Δ = 5 o. In this case, the comparison of the flow patterns obtained with two-way (Figure 8) and four-way (Figure 9) coupling is addressed. When inter-particle collisions are accounted for, the flow picture is similar to that presented in Figure 7. However, because of the lower roughness, the particle concentration is less uniform and, hence, the number of particle-wall collisions with the lower wall is higher that with the upper wall. This results in two upper recirculation cells whose size is smaller than that of the lower cells. The picture when only two-way coupling is taken into account is very different (figure 8). In such case, and due to the curved walls and gravitational settling, the particles are concentrated in the lower part near the pipe center, the concentration being quite low in the vicinity of the upper wall. Eventually, only two recirculation cells appear in the cross section and the maximum mean axial fluid velocity is displaced towards the upper half of the pipe cross-section. The particle phase mean axial velocity tends to be relatively uniform, with its lower value also near the upper wall due to the low concentration in this area.
Next, we consider a smaller particle diameter, namely Dp = 50 μm, keeping fixed a roughness parameter of Δ = 10 o. This implies, of course, that the particle number density increases regarding the previous situations. Moreover, these smaller particles will interact with the gas turbulence more effectively, i.e., the particle motion will be governed by
particle-wall as well as inter-particle collisions, and turbulent fluid-particle interaction effects. Therefore, it is expected that they will follow better the fluid phase dynamics than the larger particles, whose motion was mainly governed by particle-wall interactions and inter-particle collisions. With the smaller particles, the effect of varying the mass loading ratio of particles, η, on the secondary flow is examined below.
Figure 10 shows the results obtained for a mass loading ratio η0 = 2.2 with four-way coupling. Consequently, the influence of the particle diameter on the secondary flow can be illustrated. In this case, due to the relatively strong fluid-particle interaction and gravitational settling, the particles tend to be focused in a more or less circular area located in the lower half of the pipe cross-section (Figure 10, bottom), instead of being uniformly distributed (as was the case with the large particles). The wall collision frequency with the upper side is remarkably smaller than with the lower side. Consequently, the maximum mean axial velocity of both phases, gas and particles, is displaced towards the upper half of the pipe cross section. Similarly to the situation presented in Figure 6, the secondary flow consists of two large recirculation cells with strength of 1 % of the bulk gas velocity.
Figure 6: Streamlines of the secondary flow and gas mean axial velocity (top). Particle mean axial velocity (middle). Normalised particle mass concentration (bottom). Δ = 1.5 o. Dp = 200 μm. Four-way coupling.
Figure 7: Streamlines of the secondary flow and gas mean axial velocity (top). Particle mean axial velocity (middle). Normalized particle mass concentration (bottom). Δ = 10 o. Dp = 200 μm. Four-way coupling.
Figure 8: Streamlines of the secondary flow and gas mean axial velocity (top). Particle mean axial velocity (middle). Normalized particle mass concentration (bottom). Δ = 5 o. Dp = 200 μm. Two-way coupling.
Figure 10: Streamlines of the secondary flow and gas mean axial velocity (top). Particle mean axial velocity (middle). Normalized particle mass concentration (bottom). Δ = 10 o. Dp = 50 μm. Four-way coupling. η = η0.
Figure 11: Streamlines of the secondary flow and gas mean axial velocity (top). Particle mean axial velocity (middle). Normalized particle mass concentration (bottom). Δ =10 o. Dp = 50 μm. Four-way coupling. η = 2η0.
Figure 12: Streamlines of the secondary flow and gas mean axial velocity (top). Particle mean axial velocity (middle). Normalized particle mass concentration (bottom). Δ = 10 o. Dp = 50 μm. Two-way coupling. η = 4η0.
CONCLUSIONS
The Euler-Lagrange approach has been used to numerically study the pattern of the secondary flow induced in horizontal pipe cross-sections by the presence of particles. Inter-particle collisions as well as particle-rough wall interactions have been taken into account in the computations. In particular, two different particle diameters have been used: 200 μm and 50 μm, with a density of 1020 kg/m3. The dynamics of the large particles, being quite inertial, are mainly governed by particle-wall and inter-particle collisions, whereas in the case of smaller particles the turbulent fluid-particle interaction plays a significant role. When inter-particle collisions are disregarded, the secondary flow consists of two recirculation cells with an upward flow near the vertical (symmetry) axis and a downward flow close to the side walls, for all the cases considered here. The strength of this secondary flow increases with roughness and with particle number density. When inter-particle collisions are accounted for, the pattern depends on the particle concentration profile: with relatively smooth walls (low roughness), two recirculation cells are found, but with rough walls four recirculation cells are generated due to the more uniform particle distribution within the pipe cross-section. In the case of low roughness (or disregarding inter-particle collisions), the particle motion is governed by collisions with the bottom of the pipe, hence focusing is only found in the lower cross-section. When the particles are better dispersed due to higher wall roughness, the collision frequency with the upper wall also increases, so particles are also focused in the upper part of the pipe cross-section. In this case, four recirculation cells are developed. For the smaller particles, increasing the mass loading ratio, and therefore the number of inter-particle collisions, a transition between two and four recirculation cells in the secondary flow is observed. The maximum strength found in this study for the secondary flow is around 2.5 % of the gas bulk velocity.
ACKNOWLEDGEMENTS
The first and third authors acknowledge the Universidad Autónoma de Occidente for the support and funding (projects Estudio Numérico y Experimental del Transporte Neumático en Conductos Horizontales and Determinación de las correlaciones de velocidad entre pares de partículas inerciales inmersas en flujos turbulentos).
NOMENCLATURE
c model constant (-)
cD drag coefficient (-)
D diameter m
F force N
g gravity m/s2
I moment of inertia kg m2 k turbulent kinetic energy m2/s2
m mass kg
P mean pressure Pa
R Reynolds stress tensor m2/s2
Re Reynolds number (-)
S source term equation
t time s
T torque kg m2/s2
u instantaneous velocity m/s
U mean velocity m/s
x position m
Greek Letters
parameter slip-shear force (-) Δ wall roughness parameter (-) Γ Diffusion tensor
δ Kronecker delta (-)
ε dissipation rate m2/s3 η mass loading ratio (-) μ dynamic viscosity kg m−1s−1 φ generic variable
production term kg m2/s3
ρ density kg/m3
ω angular velocity s−1 Ω relative angular velocity s−1
Subscripts
p particle
i tensor subscript cv control volume L Lagrangian quantity
REFERENCES
Belt, R. J., van’t Westende, J. M. C., Portela, L. M., Mudde, R. F. and Oliemans, R. V. A., Particle-driven secondary flow in turbulent horizontal pipe flows. Proceedings of the 3rd Int. Symp, on Two-Phase Flow Modelling and Experimentation, Pisa, September 22 - 25 (2004).
of the 11th Workshop on Two-Phase Flow Predictions, Merseburg (Germany), April 5 - 8 (2005).
Crowe, C. T., Sommerfeld, M. and Tsuji, Y., Multiphase flows with droplets and particles, CRC Press (1998).
Daalmans, A. C. L. M., LDA measurements of particledriven secondary flow in horizontal annular flow. Master Thesis, Delft University of Technology (2005).
Darling, R. S. and McManus, H. N., Flow patterns in circular ducts with circumferential variation in roughness: a two-phase flow analog. Dev. in Mech. Proc. 11th Mid- Western Mech. Conf., vol. 5 pp. 153 - 163 (1968).
Dennis, S. C. R., Singh, S. N. and Ingham, D. B., The steady flow due to a rotating sphere at low and moderate Reynolds numbers, J. Fluid Mech., vol. 101, pp. 257-279 (1980).
Göz, M. F., Laín, S. and Sommerfeld, M., Study of the numerical instabilities in Lagrangian tracking of bubbles and particles in Two-Phase flow, Computers and Chemical Engineering, vol. 28, pp. 2727-2733 (2004).
Huber, N. and Sommerfed, M., Modelling and numerical calculation of dilute-phase pneumatic conveying in pipe systems, Powder Technology, vol. 99, pp. 90-101 (1998).
Laín, S., Sommerfeld, M. and Kussin, J., Experimental studies and modelling of four-way coupling in particle-laden horizontal channel flow, Int. J. Heat and Fluid Flow, vol. 23, pp. 647-656 (2002).
Lun, C. K. K. and Liu, H. S., Numerical simulation of dilute turbulent gas-solid flows in horizontal channels. Int. J. Multiphase Flow, vol. 23, No. 3, 575-605 (1997).
Kohnen, G., Rüger, M. and Sommerfeld, M., Convergence behaviour for numerical calculations by the Euler/Lagrange method for strongly
coupled phases, Num. Meth. for Multiphase Flows, FED vol. 185. Eds: Crowe et al., pp. 191-202 (1994).
Kohnen, G. and Sommerfeld, M., The effect of turbulence modelling on turbulence modification in two-phase flows using the Euler-Lagrange approach, Proc. 11th Symp. on Turbulent Shear Flows, Grenoble (France), vol. 2, P3, pp. 23-28 (1997).
Mei, R., An approximate expression for the shear lift force on a spherical particle at finite Reynolds number, Int. J. Multiphase Flow, vol. 18, pp. 145-147 (1992).
Rubinow, S. I. and Keller, J. B., The transverse force on a spinning sphere moving in a viscous liquid, J. Fluid Mech., vol. 11, pp. 447-459 (1961). Saffman, P. G., The lift on a small sphere in a shear
flow, J. Fluid Mech., vol. 22, pp. 385-400 (1965). Sommerfeld, M., Kohnen, G., and Rüger, M., Some
open questions and inconsistencies of Lagrangian particle dispersion models. Proc. 9th Symposium on Turbulent Shear Flows, Kyoto (Japan), paper 15-1 (1993).
Sommerfeld, M. and Huber, N., Experimental analysis and modelling of particle-wall collision, Int. J. Multiphase Flow, vol. 25, pp. 1457-1489 (1999). Sommerfeld, M., Analysis of inter-particle collisions
in homogeneous isotropic turbulence using a stochastic Lagrangian modelling approach, Int. J. Multiphase Flow, vol. 27, pp. 1829-1858 (2001). Speziale, C. G., On turbulent secondary flows in
pipes of non-circular cross-sections, Int. J. Eng. Sci., vol. 20, pp. 863-872 (1982).
Tsuji, Y. and Morikawa, Y., LDV measurements of an air-solid two-phase flow in a horizontal pipe, J. Fluid Mech., vol. 120, pp. 385-409 (1982). Zhu, K., Wong, C. K., Rao, S. M. and Wang, C. H.,