DE VECCHI, R.; LAMBERTS, R.; CANDIDO, C. M. The role of clothing in thermal comfort: how people dress in a 69
people dress in a temperate and humid climate
in Brazil
O papel da vestimenta no conforto térmico: como as
pessoas se vestem em um clima temperado e úmido
brasileiro
Renata De Vecchi
Roberto Lamberts
Christhina Maria Candido
Abstract
hermal insulation from clothing is one of the most important input variables used to predict the thermal comfort of a building’s occupants. This paper investigates the clothing pattern in buildings with different configurations located in a temperate and humid climate in Brazil. Occupants of two kinds of buildings (three offices and two university classrooms) assessed their thermal environment through ‘right-here-right-now’ questionnaires, while at the same time indoor climatic measurements were carried out in situ (air temperature and radiant temperature, air speed and humidity). A total of 5,036 votes from 1,161 occupants were collected. Results suggest that the clothing values adopted by occupants inside buildings were influenced by: 1) climate and seasons of the year; 2) different configurations and indoor thermal conditions; and 3) occupants’ age and gender. Significant intergenerational and gender differences were found, which might be explained by differences in metabolic rates and fashion. The results also indicate that there is a great opportunity to exceed the clothing interval of the thermal comfort zones proposed by international standards such as ASHRAE 55 (2013) - 0.5 to 1.0 clo - and thereby save energy from cooling and heating systems, without compromising the occupants’ indoor thermal comfort.
Keywords: Thermal comfort. Clo insulation. Temperate and humid climate.
Resumo
O isolamento térmico da vestimenta é uma das variáveis de entrada mais importantes utilizadas para prever o conforto térmico dos ocupantes dentro das edificações. Este artigo investiga padrões de vestimenta em edifícios com diferentes configurações localizados em um clima temperado e úmido brasileiro. Ocupantes de dois tipos de edifícios (três escritórios e duas salas de aula universitárias) avaliaram seu ambiente térmico através de questionários
simultaneamente às medições microclimáticas internas in situ (temperatura do ar e radiante média, velocidade e umidade do ar). Um total de 5.036 votos
provenientes de 1.161 ocupantes foram coletados. Os resultados encontrados sugerem que a vestimenta adotada pelos ocupantes nas edificações analisadas é influenciada por: 1) clima e pelas estações do ano; 2) configurações e condições térmicas internas; e 3) idade e gênero dos ocupantes. Diferenças significativas entre gerações e gêneros foram encontradas, o que provavelmente se explica pelas diferenças na taxa metabólica e moda local. Os resultados também indicaram que há uma grande oportunidade de exceder o intervalo de vestimenta determinado por normas internacionais como a ASHRAE 55 (2013) de 0,5 a 1,0 clo para as zonas de conforto térmico, impactando positivamente no dispêndio de energia voltada ao resfriamento e aquecimento artificial, sem, no entanto, comprometer o conforto térmico dos seus ocupantes em espaços internos.
Palavras-chaves: Conforto térmico. Isolamento da vestimenta (clo). Clima temperado e úmido.
T
Renata De Vecchi
Universidade Federal de Santa Catarina Florianópolis - SC - Brasil
Roberto Lamberts
Universidade Federal de Santa Catarina Florianópolis - SC - Brasil
Christhina Maria Candido
The University of Sydney Sydney - Austrália
Introduction
Thermal insulation from clothing is one of the most important input variables used to predict occupants’ indoor thermal comfort (AMERICAN…, 2013a). In both of the most common and current thermal comfort standards, clothing is an imperative protagonist. It represents one of the six variables used to calculated PMV/PPD in the static approach (FANGER, 1970), and for the adaptive method, clothing insulation worn inside buildings is considered as a key feature of the occupants adaptation, strongly dependent on both mean indoor and outdoor temperatures (DE DEAR; BRAGER; COOPER, 1997).
As a personal factor, the amount of clothing that people wear inside buildings is highly bound to human subjectivity, also involving important factors such as climate, culture and local fashion (HAVENITH; HOLMÉR; PARSONS, 2002; MORGAN; DE DEAR, 2003; CHUN et al., 2008; KWON; CHOI, 2012; SCHIAVON; LEE, 2013). Within the range of opportunities that occupants make use of strategies to adapt and optimize their thermal sensation, the first and most immediate one - perhaps even an unconscious one - is the clothing adjustment by removing a garment when they feel warm, or adding another layer when feeling cool.
Even though the importance of clothing on thermal comfort evaluation is recognized, not many papers presented results focusing on the subjectivity of clothing insulation. Nevertheless, some studies discussed the neglected factors on clothing calculation (HAVENITH; HOLMÉR; PARSONS, 2002), the variance of clothing insulation across the seasons in Korean (KWON; CHOI, 2012) and the impact of cooling strategies on thermal comfort factors from air-conditioning and naturally ventilated office populations in Thailand. Based in ASHRAE RP-884 database, two studies were performed connecting dynamic models to predict clothing insulation - which was subsequently
adopted by ASHRAE 55 Standard
(AMERICAN…, 2013a) - and also people’s clothing behavior as a function of external and internal temperature (outside, mean weekly outside and internal temperatures); further including Singapore and Indonesia data (DE CARLI et al., 2007; SCHIAVON; LEE, 2013). Type of industry, gender and indoor settings have also been investigated by Morgan and de Dear (2003), and the energy conservation potential due to flexible dress-code such as the Super Cool Biz initiative in Japan was discussed by Indraganti, Ooka and Rijal
(2013) and Tanabe, Iwahashi and Tsushima (2012).
In Brazil, most of thermal comfort field studies was performed in urban outdoor environments (KRÜGER; ROSSI, 2011; LABAKI et al., 2012; MONTEIRO; ALUCCI, 2012; ROSSI; KRÜGER; BRÖDE, 2012), whereas very few indoor thermal comfort studies have been carried out. The few existing databases comprise data from field experiments conducted in school and university
buildings (XAVIER; LAMBERTS, 2000;
LAZAROTTO; SANTOS, 2007; CÂNDIDO et
al., 2010, 2011; DE VECCHI; CÂNDIDO; LAMBERTS, 2016), and one in military and commercial buildings (ANDREASI; LAMBERTS; CÂNDIDO, 2010). However, none of them focused on key factors influencing garments worn by people indoors which is an oversight considering the vast climatic variability observed in Brazil. This paper aims to shed some light on this field by investigating the impact of subjects’ age and gender on clo values worn by people in mixed-mode and air-conditioning buildings located in a temperate and humid climate.
Method
A total of 5,036 right-here-right-now questionnaires were collected from 1,161 subjects during field experiments from three buildings located in Florianópolis - Brazil:
(a) a fully air-conditioned commercial building (type 1);
(b) two mixed-mode government buildings (type 2), both from De Vecchi (2015); and
(c) university classroom with a mixed-mode system (type 3) from De Vecchi (2011).
The field studies were conducted during all four different seasons. Details about the external air temperatures during the measurements, the related seasons and building type are summarized on Table 1 and 2 below. The external data was
acquired from a meteorological station located at the campus (Laboratory of Energy Conversion Engineering Technology – LEPTEN/UFSC), which provides data to the World Meteorological Organization (WMO).
Table 1 - Outdoor air temperature (°C) over the days of field measurements according with the seasons
Season External Air Temperature Max. Min. Mean n
Spring 26.3 17.8 21.5 833
Summer 28.7 23.2 26.7 466
Autumn 25.2 19.0 22.3 2355
Winter 22.1 12.2 17.8 1382
Total 5036
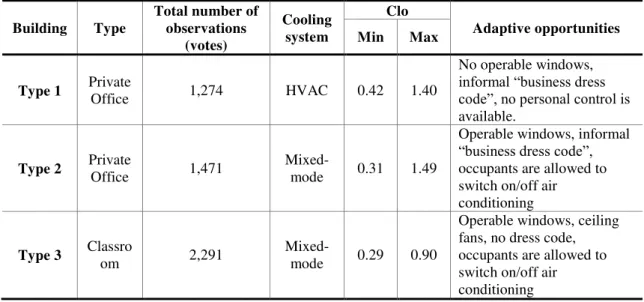
Table 2 - Buildings investigated during field experiments
Building Type Total number of observations (votes)
Cooling system
Clo
Adaptive opportunities Min Max
Type 1 Private Office 1,274 HVAC 0.42 1.40
No operable windows, informal “business dress code”, no personal control is available.
Type 2 Private Office 1,471 Mixed-mode 0.31 1.49
Operable windows, informal “business dress code”, occupants are allowed to switch on/off air conditioning
Type 3 Classroom 2,291 Mixed-mode 0.29 0.90
Operable windows, ceiling fans, no dress code, occupants are allowed to switch on/off air conditioning
Simultaneous air temperature, humidity, globe temperature and air speed measurements were carried-out with laboratory precision using a microclimatic station named SENSU1 located in
the center of the room (0.60m from the floor). Measurements were taken continuously while subjects answered a thermal comfort questionnaire (paper questionnaires in classrooms and via electronic software in office environment). Individualized air speed readings were also taken from the occupied zone for each subject, using a handheld hot-wire anemometer sensor 2 .
Questionnaire items asked subjects to assess their
1SENSU is a microclimatic station developed by a laboratory
specialized in measurement sensors and thermal phenomena (Laboratory of Porous Media and Thermo Physical Properties) at UFSC.
2Omnidirectional air speed sensor was also developed by the
same laboratory, and works under the same principle of the air speed sensor from SENSU.
complete version of the questionnaire can be found in De Vecchi (2011, 2015).
Subjects were also asked to select the garment items they were wearing from a standardized checklist (Table 3) based in ASHRAE 55 (AMERICAN…, 2013a) just before the beginning on experiments. It is important to highlight that
according with the ASHRAE Handbook
Fundamentals (AMERICAN…, 2013b)), the clo-checklist method can represent a ±25% error in the clothing insulation value, which is a common consequence of most real field studies in all over the world. Thereat, it was assumed that if any error exists in the sample, they are uniformly distributed and represents a low impact in the final comparisons. The changes in the occupants’ clothing layers were monitored through questionnaires and site observations registered by the researchers.
The clothing ranges found in each type of buildings were depicted on Table 2 above. It was automatically assumed that all participants were using underwear (briefs for men and panties and bra for women, corresponding to 0.04 clo for both of them). Also, clothing estimates included the incremental effect of the upholstered chair upon which the subject was sitting at the time of the questionnaire - 0.10 clo for a standard office chair in classrooms settings and 0.15 clo representing an executive chair in the office settings.
Operative temperature was calculated in accordance with normative appendix A from
ASHRAE 55 (AMERICAN…, 2013a), and
statistical analysis was performed using IBM SPSS software (Statistical Package for the Social Sciences - SPSS Inc., Chicago, IL, USA; 22.0 version).
Results and discussion
For the purpose of this paper, analysis focused on subjects’ clothing insulation and its variations observed during seasons, operative temperature values recorded indoors, type of buildings and also subjects’ age and gender. Figure 1 shows a distribution of the calculated operative temperature during the site observations and Figure 2 shows the frequency of collected data according to the seasons. In Figure 1, the calculated range of operative temperature varies between 21°C and 28°C. The main sample is slightly concentrated in autumn (47%) followed by winter (27%), spring (17%) and summer (9%).
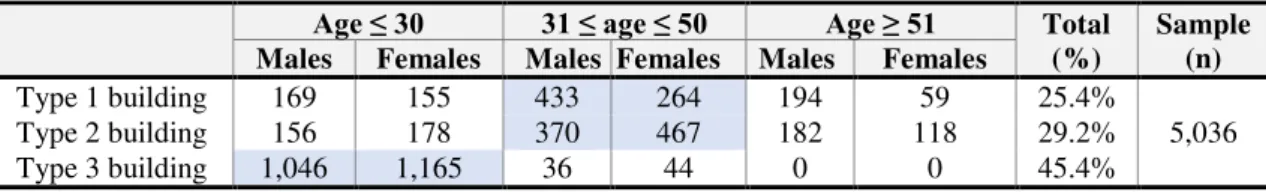
Table 4 summarizes the subjects’ age profile broken down per building type investigated. Type 1 and 2 buildings show a slightly higher concentration of occupants in the middle age group range (31 ≤ age ≤ 50). Type 3 building hosts a majority of young occupants (age ≤ 30) and a reasonable balance between females and males is observed.
Table 3 - Garment insulation used in the questionnaire
Garment l Peça de roupa Icl Garment l Peça de roupa Icl
Shirt/Polo Shirt l Camiseta/Camisa Polo 0.17 Short skirt (thin) l Saia curta (joelho) 0.14 Short-sleeved shirt l Camisa manga curta 0.19 Long skirt (thin) l Saia longa (canela) 0.23 Long-sleeve shirt l Camisa manga longa 0.25 Shorts/walking Shorts l Shorts/Bermuda 0.08 Long-sleeve sweater l Suéter manga longa 0.25 Short-sleeve shirtdress l Vestido Social 0.29 Short-sleeve sweater l
Suéter manga curta 0.36 Coveralls l Macacão 0.49 Thin jacket/Single-breasted
Jaquela/Paletó Fino
0.42 Panty hose l Meia-calça 0.04
Thick jacket/Single-breasted
Jaquela/Paletó grosso 0.44 Knee socks l Meia soquete 0.06 Long-sleeve sweatpants l
Blusa de moletom
0.34 Ancke-length Socks l Meias esportivas 0.02
Figure 1 - Distribution of the operative temperature during the field experiments
Figure 2 - Data frequency according with the seasons of the year
Table 4 - Collected votes separated by age and gender profile per building type
Age ≤ 30 31 ≤ age ≤ 50 Age ≥ 51 Total
(%) Sample (n) Males Females Males Females Males Females
Type 1 building 169 155 433 264 194 59 25.4%
5,036
Type 2 building 156 178 370 467 182 118 29.2%
Type 3 building 1,046 1,165 36 44 0 0 45.4%
Results in Figure 3 show that thermal comfort votes indicated a 80% satisfaction reported by building occupants when exposed to operative temperatures spanning from 21°C to 26°C in all building types investigated here, suggesting a worthy ratio between occupants clothing and experienced thermal conditions. In type 1 building, operative temperature has not exceeded the range between 22°C and 24°C due to the tight temperature control observed in the HVAC system. Based on these results, comfort interval was assumed between 21°C and 26°C, and data beyond this range were rejected on further analysis.
Seasonal and ventilation strategy
impact on clo values
Figure 4 shows the frequency of clo values observed during different seasons of the year. Not surprisingly, occupants’ clo values were strongly influenced by season - values higher than 0.9 clo occurred most frequently in winter, while 0.3 - 0.5 clo were registered during summer. Apart from the two well-defined seasons (summer and winter), results from autumn and spring show a strong fluctuation in clo values (0.3 – 1.0 clo), which matches the characteristically variability in the outdoor weather observed during these seasons. Similar results were reported by Morgan and de Dear (2003), and Kwon and Choi (2012).
0% 5% 10% 15% 20% 25%
21 22 23 24 25 26 27 28
Fr
e
q
u
e
n
cy
Operative Temperature (°C)
0% 5% 10% 15% 20% 25% 30% 35% 40% 45% 50%
Spring Summer Autumn Winter
Fr
e
q
u
e
n
cy
The seasonal variability observed on the average clo values worn by subjects became clearer by analyzing this data in combination with operative temperature values measured indoors for all building types. Figure 5 shows that clo values observed in winter were statistically significant and occupants adopted approximately 0.2 clo higher than those observed during autumn. A greater difference was observed in clo values worn by people during summer and winter (0.75 clo vs. 0.48 clo respectively) while during spring and autumn presented a more constant value of 0.60. These observed differences on occupants’ clothing, during the four seasons, could be directly related to the thermal conditions delivered indoor by each building type investigated here. The same way that outdoor weather influences our choice of clothing, the thermal conditions people expect to be exposed indoors may also play a role here which in turn may or may not be linked to the outdoor weather – for instance subjects may be wearing a cardigan inside of an office building in the middle of summer. Figure 6 shows the outcomes for all buildings type:
(a) a fully air-conditioned commercial building (type 1);
(b) two mixed-mode government buildings (type 2); and
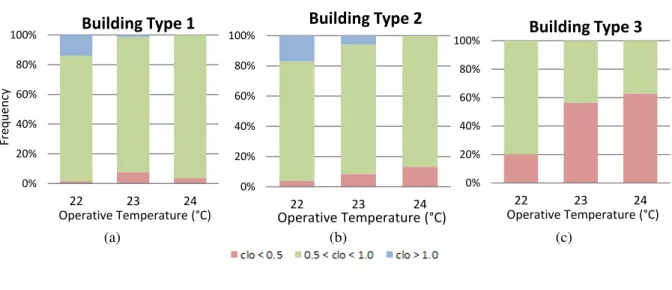
(c) university classroom with a mixed-mode system (type 3) binned by operative temperature values.
The air-conditioning was used in 28% of the measured period in mixed-mode buildings (type 2 buildings) while in classrooms (type 3 buildings) the same usage achieved 52%. Type 1 and 2 buildings – both office environments, the clo values varied very little while in Type 3 buildings a bigger variation was observed. This can be explained by the dress code observed in Type 1 and 2 buildings and also the age profile of the sample. The mild variation in clo values in type 2 and the higher variability in type 3 suggest that occupants may be taking advantage of the adaptive opportunities available to them in these mixed-mode environments (changing the clothing, opening/closing windows or even turning on/off AC units).
Figure 3 - Frequency of thermal comfort votes according with the three types of building and binned operative temperature (°C)
(a) (b)
0% 20% 40% 60% 80% 100%
22 23 24
Fre
q
u
e
n
cy
Operative Temperature (°C)
Type 1 Building
0% 20% 40% 60% 80% 100%
21 22 23 24 25 26 27
Fre
q
u
e
n
cy
Operative Temperature (°C)
Type 2 Building
0% 20% 40% 60% 80% 100%
21 22 23 24 25 26 27 28
Fre
q
u
e
n
cy
Operative Temperature (°C)
Figure 4 - Frequency of observed clothing insulation according with the four annual seasons
Figure 5 - Clothing average associated with the annual seasons and operative temperature (°C)
Figure 6 - Distribution of clothing values according with the operative temperature in the building type 1 (a), type 2 (b) and type 3 (c)
(a) (b) (c)
0% 10% 20% 30% 40% 50% 60% 70% 80% 90% 100%
0.3 0.4 0.5 0.6 0.7 0.8 0.9 1.0 1.1 1.2 1.3 1.4 1.5
Fre
q
u
e
n
cy
Clothing Insulation (clo) Spring Summer Autumn Winter
0% 20% 40% 60% 80% 100%
22 23 24
F
re
q
u
e
n
cy
Operative Temperature (°C)
Building Type 1
0% 20% 40% 60% 80% 100%
22 23 24
Operative Temperature (°C)
Building Type 2
0% 20% 40% 60% 80% 100%
22 23 24
Operative Temperature (°C)
Building Type 3
Winter
Autumn
summer
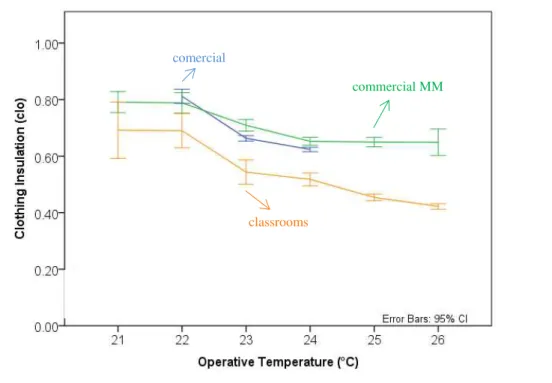
Figure 7 shows the average values of clothing insulation for each type of building binned by operative temperature values. In type 3 building, where occupants wore more casual garments and no dress code is required, clothing insulation is substantially smaller than others buildings. Comparing the results from the office buildings (1 and 2) it is possible to observe that clothing average values were statistically different and slightly smaller (≅ 0.1 clo) in the fully air-conditioning building. Even though small, this difference shouldn’t be completely ignored - results reported by De Carli et al. (2007) indicate that even small difference in clo value of 0.1 in air-conditioning buildings may be sufficient to impact on occupants’ comfort (and the PMV/PPD calculations).
Gender and age groups differences
in clo values
The frequency of each clo value bin ranging from 0.3 to 1.5 for male and female occupants were illustrated in Figure 8. It is worth mentioning the difference of clo value distribution between male and females. For males, there is a much higher frequency of clo value in the 0.6 bin, which represents a typical ensemble of long trousers and a long (short)-sleeve shirt in the work environment. As for females, the frequencies are more spread out between different bins, meaning that there are more variations in terms of what they are wearing for work. These differences were also observed when each type of building was analysed
separately. Females presented a higher value of clo in all occasions (0.04 higher in HVAC buildings and 0.06 higher in mixed-mode buildings and classrooms).
Although the dressing code in the work environment is similar between different genders, Figure 9 does show a much higher variation of women’s clo values than men’s. Figure 10 also reports a higher SD value for females than males, which corroborate with the findings in Morgan and de Dear (2003).
Figure 10 presents the average clo value along with its 95% confidence intervals across a range of operative temperatures for males and females. Except for the operative temperatures of 21°C and 24°C where the two confidence intervals overlap, other operative temperatures have observed significantly different clo values (p < 0.05) between males and females, with females generally 0.1 to 0.2 higher than males. Theses results may be driven by the higher cold sensitivity that women usually demonstrate, as reported in several comfort studies (NAKANO; TANABE; KIMURA, 2002; MORGAN; DE DEAR, 2003;
KINGMA; FRIJNS; VAN MARKEN
LICHTENBELT, 2012; SCHELLEN et al., 2012). The higher variability in women’s dresses that are discussed previously could also contribute to this difference. According to Morgan and de Dear (2003), men tend to follow a more fixed dressing code than women do, regardless of outdoor temperatures.
Figure 7 - Clothing average associated with the type of buildings and the operative temperature (°C)
commercial MM comercial
HVAC
Figure 8 - Clothing distribution according with the occupants’ gender
Figure 9 - Clothing distribution according with the business occupants and their gender
(a) Female’s clothing (b) Male’s clothing
Figure 10 - Clothing average associated with the occupants’ gender and the operative temperature (°C) 0%
5% 10% 15% 20%
0.3 0.4 0.5 0.6 0.7 0.8 0.9 1.0 1.1 1.2 1.3 1.4 1.5
Fr
e
q
u
e
n
cy
Clothing Insulation (clo)
Female Male
Average value: 0.70 Stand. Dev.: 0.20 N: 1241
Average value: 0.65 Stand. Dev.: 0.16 N: 1242
female occupants
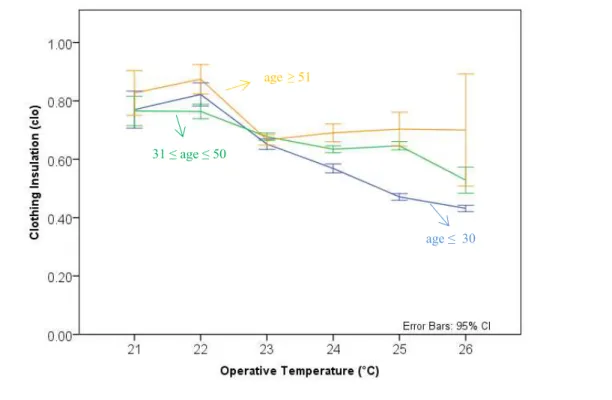
Another aspect regarding clo values is the intergenerational differences. Figure 11 shows the distribution of clo value frequencies according to different age groups: group 1, younger than 30 years old; group 2, between 31 and 50 years; and group 3 older than 51 years. It is clear that younger occupants have a higher frequency of clo values below 0.7, while occupants from group 2 and 3 generally have higher frequencies in clo value around 0.6 and 0.7. This difference in clothing insulation can also be observed in Figure 12, which associates the average clo values with operative temperatures.
The youngest occupants presented the lowest levels of clothing insulation in the operative temperature range between 24 and 26°C, while the
eldest group tend to have the heaviest clothing. However, it should be noted that there is no difference in clo values between different age groups. Differences over the age groups can also be linked to physiological differences such as metabolism. Also, no difference was observed between age groups among the different types of buildings. However, what needs to be pointed out is that all of the maximum observed clothing values occurred in the age groups 2 and 3 (clothing values were 0.15 higher among the maximum values in the age groups 2 and 3 compared to 1). De Vecchi (2015) has reported significant differences between the preferred temperature of the same age groups across the SET* interval of 22°C to 26°C.
Figure 11 - Clothing distribution according with the occupants’ age
Figure 12 - Clothing average associated with the annual seasons and the operative temperature (°C) 0%
5% 10% 15% 20%
0.3 0.4 0.5 0.6 0.7 0.8 0.9 1.0 1.1 1.2 1.3 1.4 1.5
Fr
e
q
u
e
n
cy
Clothing Insulation (clo)
Group Group x 5 Group 5
31 ≤ age ≤ 50
age≥ 51
Conclusions
Based on observations from field studies conducted in a Brazilian temperate and humid climate, this paper presented a preliminary investigation in the subjective issues that could have impact on clothing insulation. The results suggest that clothing values chosen by occupants were related to Brazil’s climate and culture, their anthropometric characteristics and the indoor climatic regimes in different types of buildings. Based on the results found in this study, there is no doubt that season has a huge impact on building occupants’ clothing insulation during the study. All through the spring days (n=833) the average clo value of building occupants was 0.54; in the summer it was 0.42 (n=466), during the autumn it was 0.53 (n=833) and in winter it was 0.78 (n=1382). Even with the same operative temperature inside buildings, clothing values were different. The average values found in this study are marginally different from the suggested values in international standards (0.5 for summer and 1.0 for winter).
For classrooms and office work environments, there are different clo values observed even at the same temperature. As much as both of analyzed kinds of buildings can be classified as prolonged exposure environments, a large difference between student’s expectations about their daily activities could have an impact on the choices of clothing, as well as the nonexistence of a corporate dress code. These assumptions possibly led them to use lower levels of clothing than office workers. The clothing behavior was also compared across the commercial buildings with different cooling systems, and it was observed a slightly higher variability on clothing insulation in the mixed-mode building (a 0.04 difference on standard deviation), which also represented the model with higher Pearson’s coefficient (35% compared to 26%). These results highlight the impact of indoor climate on clothing insulation levels and possible implications for the energy consumption. Wearing heavier clothes during winter and lighter clothes during summer can reduce the heating and cooling loads; mixed-mode buildings can serve as an example of more energy efficient buildings and more comfortable environments - especially when controlled by occupants.
Back to the dress code issue, differences between “casual clothing” and “business clothing” environments represented in this study by students and office workers raise another discussion about initiatives such as Cool Biz in Japan and the “not-flexibilities” of the corporate dress code applied in large and hot urban centers of Brazil such as
Florianópolis. On these assumptions, female occupants may be privileged, given the flexibility they can have on day-to-day corporate clothing verified in this study. However, due to their higher sensitivity to cold environments and differences on metabolic rate discussed in previous papers, women might be dealing with the over cooling inside buildings (or, just with the unnecessary use of air conditioning in mixed-mode environments) through warmer clothes, while men have relatively fixed dress code.
Whether the intergenerational difference represents an important factor to be considered in dress patterns is still under question; Yet, the results from this paper call for a further examination on the thermal comfort impact of fixed and liberal dress codes during the hottest days.
References
AMERICAN SOCIETY OF HEATING
REFRIGERATING AND AIR-CONDITIONING
ENGINEERS. ASHRAE Handbook
Fundamentals. Atlanta, 2013b. chap. 8. AMERICAN SOCIETY OF HEATING
REFRIGERATING AND AIR-CONDITIONING ENGINEERS. Standard 55: thermal
environmental conditions for human occupancy. Atlanta, 2013a.
ANDREASI, W. A.; LAMBERTS, R.;
CANDIDO, C. Thermal Acceptability Assessment in Buildings Located in Hot and Humid Regions in Brazil. Building and Environment, v. 45, n. 5, p. 1225–1232, 2010.
CANDIDO, C. et al. Air Movement Acceptability Limits and Thermal Comfort in Brazil’s Hot Humid Climate Zone. Building and
Environment, v. 45, n. 1, p. 222–229, 2010. CANDIDO, C. et al. Aplicabilidade dos Limites da Velocidade do Ar Para Efeito de Conforto Térmico em Climas Quentes e Úmidos. Ambiente Construído, Porto Alegre, v. 10, n. 4, p. 59–68, out./dez. 2011.
CHUN, C. et al. Thermal Diary: connecting temperature history to indoor comfort. Building and Environment, v. 43, n. 5, p. 877–885, 2008. DE CARLI, M. et al. People’s Clothing Behaviour According to External Weather and Indoor Environment. Building and Environment, v. 42, n. 12, p. 3965–3973, 2007.
DE VECCHI, R. Condições de Conforto Térmico e Aceitabilidade da Velocidade do Ar em Salas de Aula Com Ventiladores de Teto Para o Clima de Florianópolis/SC. Florianópolis, 2011. Dissertação (Mestrado em Engenharia Civil) - Departamento de Engenharia Civil, Universidade Federal de Santa Catarina, Florianópolis, 2011. DE VECCHI, R. Avaliação de Conforto térmIco em Edificações Comerciais que Operam Sob Sistemas Mistos de Condicionamento Ambiental em Clima temPerado e Úmido. Florianópolis, 2015. Tese (Doutorado em Engenharia Civil) - Departamento de Engenharia Civil, Universidade Federal de Santa Catarina, Florianópolis, 2015.
DE VECCHI, R.; CANDIDO, C.; LAMBERTS, R. Thermal History and Comfort in a Brazilian Subtropical Climate: a “cool” addiction
hypothesis. Ambiente Construído, Porto Alegre, v. 16, n. 1, p. 7–20, jan./mar. 2016.
FANGER, P. O. Thermal Comfort: analysis and applications in environmental engineering. Copenhagen: Darlish Techinical Press, 1970. GOULART, S.; LAMBERTS, R.; FIRMINO, S. Dados Climáticos Para Projeto e Avaliação Energética de Edificações Para 14 Cidades Brasileiras. Florianópolis: PROCEL/Núcleo de Pesquisa em Construção Civil, UFSC, 1998. HAVENITH, G.; HOLMÉR, I.; PARSONS, K. Personal Factors in Thermal Comfort Assessment: Clothing Properties and Metabolic Heat
Production. Energy and Buildings, v. 34, n. 6, p. 581–591, 2002.
INDRAGANTI, M.; OOKA, R.; RIJAL, H. B. Thermal Comfort in Offices in Summer: findings from a field study under the “setsuden” conditions in Tokyo, Japan. Building and Environment, v. 61, n. 114-132, 2013.
KINGMA, B. R.; FRIJNS, A.; VAN MARKEN LICHTENBELT, W. The Thermoneutral Zone: implications for metabolic studies. Frontiers in Bioscience, v. 4, p. 1975–1985, 2012.
KRÜGER, E. L.; ROSSI, F. A. Effect of Personal and Microclimatic Variables on Observed Thermal Sensation From a Field Study in Southern Brazil. Building and Environment, v. 46, n. 3, p. 690– 697, 2011.
KWON, J.; CHOI, J. The Relationship Between Environmental Temperature and Clothing Insulation Across a Year. International journal of biometeorology, v. 56, n. 5, p. 887–93, sep. 2012.
LABAKI, L. C. et al. Conforto Térmico em Espaços Públicos de Passagem: estudos em ruas de pedestres no estado de São Paulo. Ambiente Construído, Porto Alegre, v. 12, n. 1, p. 167–183, jan./mar. 2012.
LAZAROTTO, N.; SANTOS, J. C. P. Avaliação do Conforto Térmico de Estudantes do Ensino Fundamental na Região Noroeste do RS. In: ENCONTRO NACIONAL NO AMBIENTE CONSTRUÍDo, 9., Ouro Preto, 2007. Anais...Ouro Preto, 2007.
MONTEIRO, L. M.; ALUCCI, M. P. Modelo Adaptativo de Conforto Para Avaliação in loco de Espaços Urbanos Abertos. Ambiente Construído, Porto Alegre, v. 12, n. 1, p. 61–79, jan./mar. 2012. MORGAN, C.; DE DEAR, R. Weather, Clothing and Thermal Adaptation to Indoor Climate. Climate Research, v. 24, p. 267–284, 2003. NAKANO, J.; TANABE, S.; KIMURA, K. Differences in Perception of Indoor Environment Between Japanese and Non-Japanese Workers. Energy and Buildings, v. 34, n. 6, p. 615–621, 2002.
ROSSI, F. A.; KRÜGER, E. L.; BRÖDE, P. Definição de Faixas de Conforto e Desconforto Térmico Para Espaços Abertos em Curitiba, PR, Com o Índice UTCI. Ambiente Construído, Porto Alegre, v. 12, n. 1, p. 41–59, jan./mar. 2012. SCHELLEN, L. et al. The Influence of Local Effects on Thermal Sensation Under Non-Uniform Environmental Conditions-Gender Differences in Thermophysiology, Thermal Comfort and Productivity During Convective and Radiant Cooling. Physiology & behavior, v. 107, n. 2, p. 252–61, 2012.
SCHIAVON, S.; LEE, K. H. Dynamic Predictive Clothing Insulation Models Based on Outdoor Air and Indoor Operative Temperatures. Building and Environment, v. 59, p. 250–260, 2013.
TANABE, S.; IWAHASHI, Y.; TSUSHIMA, S. Thermal Comfort and Productivity in Offices Under Mandatory Electricity Savings After Great East Japan Earthquake. In: WINDSOR
CONFERENCE: THE CHANGING CONTEXT OF COMFORT IN AN UNPREDICTABLE WORLD, 7., Cumberland Lodge, 2012.
Proceedings… Cumberland Lodge, 2012.
Acknowledgements
This project was supported by the Brazilian Federal Governments’ CNPq and CAPES. The authors would like to thank everyone involved in the field experiment, and Ms. Fan (Jessica) Zhang from The University of Sydney’s IEQ Lab.
Renata De Vecchi
Departamento de Engenharia Civil | Universidade Federal de Santa Catarina | Rua João Pio Duarte Silva, 241, Córrego Grande, Campus Universitário, Trindade | Caixa Postal 476 | Florianópolis - SC – Brasil | CEP 88040-900 | Tel.: (48) 3721-5185 |
E-mail: [email protected]
Roberto Lamberts
Departamento de Engenharia Civil | Universidade Federal de Santa Catarina | Tel.: (48) 3721-5191 | E-mail: [email protected]
Christhina Maria Candido
Faculty of Architecture, Design and Planning | The University of Sydney | Wilkinson bd (G04), Room 587, Darlington | Sydney – Austrália | 2006 | Tel: (2) 9351-3206 | E-mail: [email protected]
Revista Ambiente Construído
Associação Nacional de Tecnologia do Ambiente Construído Av. Osvaldo Aranha, 99 - 3º andar, Centro
Porto Alegre – RS - Brasil CEP 90035-190 Telefone: +55 (51) 3308-4084
Fax: +55 (51) 3308-4054 www.seer.ufrgs.br/ambienteconstruido