The application of the ultrasonic pulse velocity method for internal law identiication in concrete members has been gaining importance in the last years. This non destructive method has beneits, but also presents some limitations, especially in the ield of representation of the results. The goal of this paper is to improve the representation of the results with the application of the computational tomography technique. This technique allows to better locate internal laws by a tomographic image called tomogram. A tomogram exhibits law position within the sectional planes of the analyzed concrete members. International researchers agree that the ultrasonic tomography technique has great potential to be used in the investigation of internal sections of concrete members as well as to identify internal laws. The experiments performed in this work endorse this statement.
Keywords: nondestructive test, ultrasonic, tomography.
O método ultrassônico convencional para a detecção de não homogeneidades no concreto já é conhecido no meio acadêmico e está em expansão na área técnica. Tal método tem suas vantagens e limitações com relação à representação dos resultados obtidos. Esta pesquisa, nacionalmente pioneira, visa melhorar consideravelmente tais resultados com a aplicação da técnica tomográica computacional, cujas locali -zações das não homogeneidades são proporcionadas por tomogramas, onde é possível conhecer suas posições dentro de planos seccionais do elemento de concreto sem armadura analisado. Pesquisadores internacionais airmam que a técnica da tomograia ultrassônica em concre -to tem grandes potencialidades para ser utilizada na investigação de seções internas de concre-to para identiicação de não homogeneidades. Através de ensaios experimentais, os resultados dessa pesquisa reairmam tal constatação.
Palavras-chave: ensaios não destrutivos, ultrassom, tomograia.
Ultrasonic tomography in concrete
Tomograia ultrassônica em concreto
L. P. PERLIN a
R. C. A. PINTO b
a Universidade Federal de Santa Catarina, Departamento de Engenharia Civil, [email protected], Campus Universitário Reitor João David
Ferreira Lima - Trindade - Florianópolis - Santa Catarina – Brasil - CEP 88040-970. Doutorando em Engenharia Civil, área Estruturas.
b Universidade Federal de Santa Catarina, Departamento de Engenharia Civil, [email protected], Campus Universitário Reitor João David Ferreira
Lima - Trindade - Florianópolis - Santa Catarina – Brasil – CEP 88040-970. Professor Associado do curso de Engenharia Civil.
Abstract
1. Introduction
Some time ago concrete structures were believed to last eternally, i.e., not being subjected to deterioration. Nowadays, however, it is known that such structures may suffer degradation effects with time. There are several examples of highway structures all over the world that need to be repaired. The nondestructive tests help to gather information about structure integrity, evaluating the need to corrective actions, as well as contributing to determine the level of intervention needed in the structural element.
Among the various nondestructive test methods available, the ultra -sonic pulse velocity method has been widely used in concrete struc -tures. It has been applied to evaluate the resistance of concrete using pre-determined correlation curves between ultrasound pulse velocity and compressive strength (EVANGELISTA [1]; LORENZI [2]; MACH -ADO [3]; STEIL et al. [4 ]; CÂMERA, E. et al. [5]). Ultrasound has also
been used to inspect structural elements for the presence of regions with non homogeneities (DORNELLES et al. [6]; BUTTCHEVITZ et al. [7]; JUNIOR SOARES et al. [8]; EMANUELLI JUNIOR et al. [9-10];
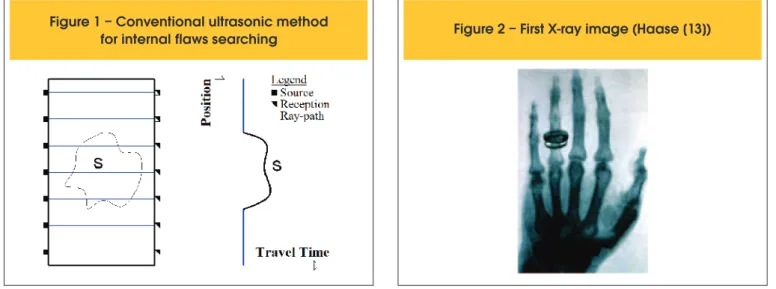
PERLIN [11]). Usually, the inspection technique used to ind internal laws with ultrasound consists of several readings along the structure surface, resulting in a map of travel times of the ultrasonic pulse within the element as shown in Figure 1.
The ultrasonic pulse velocity is then calculated using the distance travelled by the ultrasound pulse as the thickness of the element. Internal laws are detected by the existence of regions with lower velocities. The graphical representation obtained by this proce -dure, however, is not eficient since it is an attempt to express a two dimensional section in an only one dimensional igure. This graphical representation can be improved considerably with the computerized tomography technique withg ultrasound read -ings as a physical measure, instead of X-rays. This technique is called Ultrasonic Tomography in Concrete. Although already known internationally, there is a lack of basic information about this technique.
2. Tomography
Tomography is a word derived from two Greek words, tomus and
grafos which respectively mean “slice” and “image or design”. The
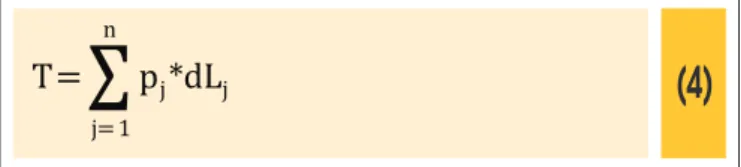
history of tomography begins in 1895, when the German physi -cist Wilhelm Conrad Röntgen produced electromagnetic radiation at wavelengths corresponding to the currently called X-rays. As a consequence, he is considered the “father of radiology.” He earned the Nobel Prize in Physics in 1901 (MARTINS [12]). The images produced by this technique (Figure 2) are projections on a screen, and therefore, represent a three dimensional object on a two dimensional plane. This limitation is similar to the one in conventional ultrasonic tests, since there is also an attempt to represent a two dimensional section by one dimensional igure (Figure 1).
In 1917 the Austrian mathematician Johann Radon presented a solution of this problem. He showed that it is possible to exactly reconstruct a three dimensional object from a complete set of its two dimensional projections, each obtained at a speciic angle. This technique is considered the mathematical basis for computer -ized tomography, being called the Radon Transform (DEANS [14]; IUSEM et al. [15-16]).
Despite being mathematically possible, it was very laborous to perform a tomography without the aid of a computer or automatic equipments. Therefore, in 1972, the irst computerized tomogra -phy equipment was developed by the English eletrical engineer, Godfrey Newbold Hounsield, and by the South African physicist Allan MacLeod Cormack. For their accomplishiments, they came to receive the Nobel Prize in Physiology and Medicine in 1979 (FILLER [17]).
3. Ultrasonic tomography in concrete
The computational tools available nowadays, together with the mathematical techniques developed by Radon, help to develop the computerized tomography in concrete. The ultrasonic pulse veloc -ity is used as the physical measure.
3.1 Basic mathematical background
The ultrasonic pulse velocity between two transducers can be ob -tained from Equation 1. Since the positions of the transducers are known, the total travel distance L can be determined. The results
Figure 1 – Conventional ultrasonic method
where:
Pj: wave slowness in element j.
Equation 3 could also be regarded as a summation, as shown in Equation 4, where n is the total elements.
(4)
T=
Σ
p
j*dL
j nj=1
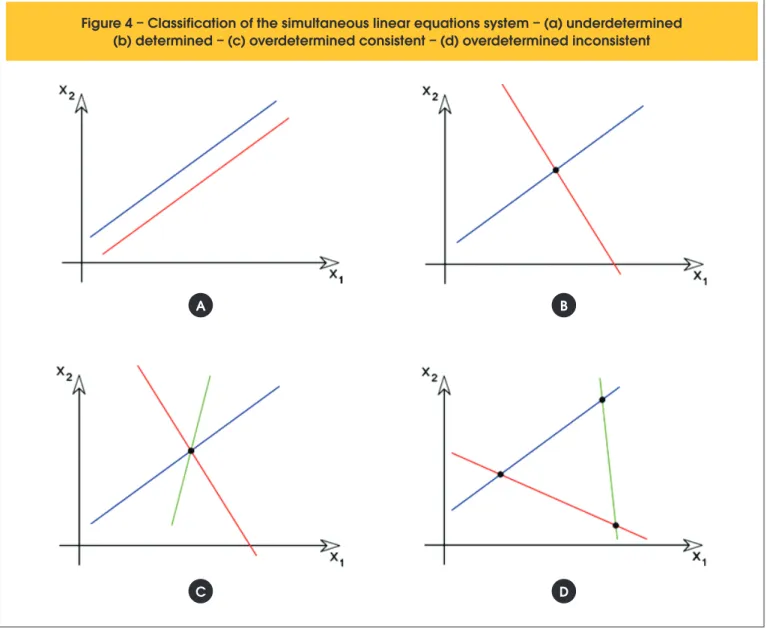
Each ultrasound reading can be expressed by Equation 4. The total number of ultrasound readings (m) is represented in Equation 5, which is graphically represented in Figure 3-c.
(5)
Σ
T
i=
p
j*dL
i,j nj=1
(i=1,…,m)
Equation 5 could be expressed in matricial form according to Equation 6.
(6)
T
m=D
m,n*P
nwhere:
m: total number of ultrasound readings; n: total number of elements;
D: a rectangular matrix with m lines and n columns that records the travel distances of the ultrasound waves in element j, when read -ing i is performed;
P: a column vector with n lines that records the wave slowness in each different element j;
of the ultrasound reading is the total travel-time T of the ultrasound wave, thus the ultrasound velocity is automatically known (MAL -HOTRA et al. [18]).
(1)
V=
L
T ∴ T=
V
L
One could divide the section to be analyzed in a grid of n elements (Figure 3-b) in that case the ultrasonic pulse travels through several elements at known distances. The total travel path L is the sum of all distances travelled in each element. Similarly, the sum of the individu-al time to travel each element is the totindividu-al travel-time T. Therefore, the total travel-time T could be determined as presented in Equation 2.
(2)
T=
⎰
V
1
j R
E
*dL
jwhere:
T: total travel-time of the ultrasound wave from the transmitter to the receiver;
Vj: ultrasound velocity in element j; dLj: travel distance in element j.
Equation 2 could be rewritten considering the term wave slowness (p) as the inverse of wave velocity, as expressed in Equation 3 (JACKSON et al. [19]).
(3)
⎰
T=
p
j RE
*dL
jFigura 3 – Representação das leituras ultrassônicas – (a) leitura – (b) leitura com
elementos discretizados – (c) várias leituras com elementos discretizados
is less than the number of unknowns, and thus there is not a unique solution (Figure 4-a);
ndetermined: the number of independent linearly equations is
equal to the number of unknowns, and thus there is a unique solution (Figure 4-b);
noverdetermined: the number of independent linearly equations
is greater than the number of unknowns. If the readings are ac -curate, the system will be considered consistent with a unique
solution (Figure 4-c). If, on the other hand, the readings are not accurate, the system will be inconsistent without a proper solu -tion to all readings (Figure 4-d).
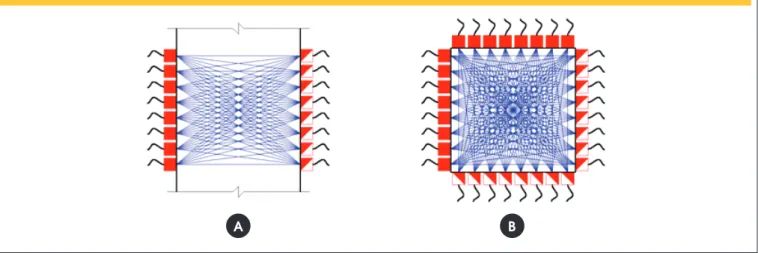
The tomographic system can be classiied as underdetermined, determined or overdetermined depending on the concrete element to be study and its number of available sides to perform ultrasound readings. For beams and slabs, there are usually only two sides available, according to Figure 5-a. For columns, there are usu -ally four sides that can be used, which allow the readings to be as shown in Figure 5-b. It may be necessary to use different modes of readings depending on how the objects are on the ield Perlin [11]. T: a column vector with m lines that records the total travel-time of
each reading i.
It can be observed that the elements of matrix D are determined since the grid and the position of the transducers are known for each different reading. The elements of vector T are also known since they are the results of each reading. Therefore, only the ele -ments of vector P are to be determined.
3.2 Resolution
Equation 6 represents a system of simultaneous linear equations, which could apparently be solved by simpliied methods. However, the matrix D is usually rectangular, with a number of equations that differs from the number of the unknowns wave slowness. More -over, there are some equations that are linearly dependent, which may lead to a singular problem, without a unique solution.
Therefore, depending on the number of readings and on which readings are performed, the problem may be:
nundertermined: the number of linearly independent equations
Figure 4 – Classification of the simultaneous linear equations system – (a) underdetermined
(b) determined – (c) overdetermined consistent – (d) overdetermined inconsistent
A
C
B
If the readings are performed only on opposite sides of the con -crete element, the simultaneous system of equations is undeter -mined, regardless the number of readings performed (JACKSON
et al. [19]). If the readings are performed on all four opposite sides,
the simultaneous system of equations is overdetermined; for ac -tual readings with intrinsic errors associated with, this system may be inconsistent (Figure 4-d). The underdetermined simultaneous system of equations is beyond the scope of this paper. Hereafter, only the determined and the overtermined systems are discussed. Among the methods used to solve the simultaneous system of lin -ear equations, there are direct and iterative methods. The direct methods used are: solution by the invertion of matrix D, Cramer’s Rule, Gaussian Elimination, and the Minimum Least Squares Method. On the other hand, the iterative methods are Gauss-Ja -cobi, Gauss-Seidel, Kaczmarz and Cimmino methods.
According to Perlin [11], the best method to be used in the rectan -gular simultaneous linear equation system caractheristic of a to -mographic process is the Cimmino iterative method. Jackson et al.
[19] presented an improvement of this method allowing to a faster convergence. This optimized modiication of Cimmino method is called optimized Cimmino, and is presented in Equation 7.
(7)
P
n(k)=P
n(k-1)+W
m,nT*
[
T
m-D
m,n*P
n(k-1)]
where:
k: current iteration number;
m: number of simultaneous equations; n: number of unknowns;
Pn(k): column vector that stores the values of current iterative step ; Pn(k–1): column vector that stores the values of previous iterative step;
Wm,n: matrix given by:
(8)
w
ij=
N
d
ijj
*
Σ
mk=1(d
ik)
2;
Nj: number of equations where j is not zero; dij: value of row i and column j of the matrix Dm,n.
In order to better understand the solution process of the tomo-graphic problem, one should identify that the term inside brack -ets represents the variation DTm(k) of the iteration pass k. While
performing the irst iteration is necessary to deine an initial value for Pn(0). The transposed matrix W
m,n calculates the variation of the
ultrasound pulse velocities of each element due to the variation of time readings DTm(k), yielding DP
n(k) for iteration k. DPn(k) is then
added to Pn(k–1), resulting in the best possible velocity ield. In order to solve the proposed problem it is mandatory to use a tomographic software. In this research, it was decided to develop and continuously optimize a computional program, called TUCon, which comes from Ultrasonic Tomography in Concrete.
Since object dimensions are known, the grid used and the ul -trasound readings performed follow a reference nomenclature according to Figure 6. TUCon calculates the path of each pulse through each element, and thus is able to build the matrix Dm,n. Besides, since the ultrasound readings are known, TUCon builds the vector Tm, which represents the travel times.
Figure 5 – Modes of measurement – (a) simple opposite faces – (b) complete opposite faces
A
B
For each reading performed, there is a speciic spatial position of the emitting and of the receiving transducers. Initially, it was considered that the pulse travels in a linear path between both transducers, and thus, the mathematical line equation between transducers is deined, according to Figure 7. The real path of the pulse, however, may contour objects or regions with low velocities, as shown in Jackson et al. [19]. In this case, a more complex ap -proach needs to be used when programming. This complexity is not yet included in TUCon in its actual phase.
Some aspects should be taken into account when deining the grid to be used in ultrasonic tomography. From a pure mathematical point of view, the Radon Transform does not deine limits to the lowest element size to be used, and thus the lowest grid spac -ing. A great number of elements would allow a more precise result since the domain would be discretized in yet smaller elements. The number of reading points and the total number of readings would also be greater which would contribute to a better result. The possibility of ininitesimal grid spacing would yield theoretically a perfect result.
However, according to results presented by Schechter et al [20], the wave front is not perfectly circular, depending mainly on the size of the transducer used to generate it. Therefore, small varia -tions in the transducer position would not inluence signiicantly on the ultrasound readings. Other limiting factors are the wave length
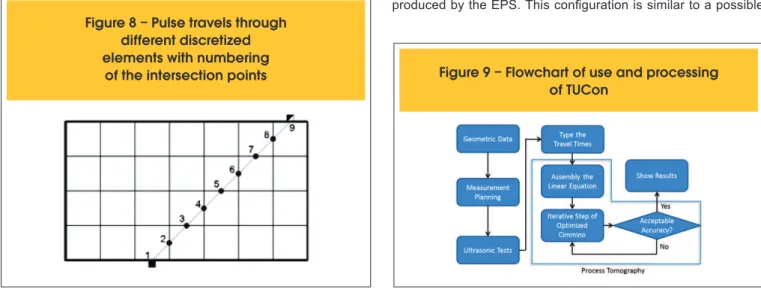
and the total time required to perform all readings. If an internal law is smaller than the wave length it will not be detectable, and thus there is no need to deine grid spacing smaller than the gener -ated wave length. Moreover, the smaller the grid spacing the great -er the numb-er of readings leading to a much great-er execution time for all readings. As a consequence, the decision of the grid spacing should take into account all of this aforementioned factors. The elemnts of matrix Dm,n are calculated following a simple pro -cedure. With the grid spacing and ray-path equation deined, it is possible to determine the interception points, numbering them in an ascending order according to Figure 8. With the points numbered, the distance between successive points can be easily calculated.
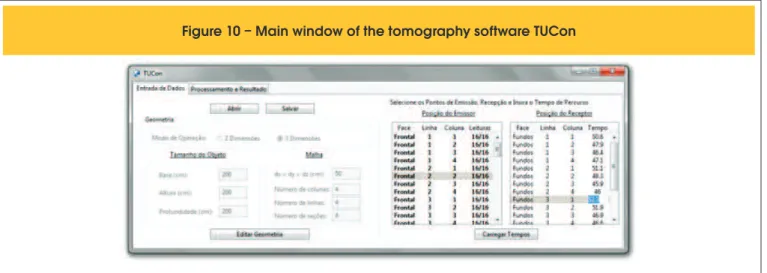
With the matrix Dm,n and the vector Tm determined, the iterative process of Optimized Cimmino solves the system. The result is then exported for further graphical treatment. The lowchart of the program can be found in Figure 9. The TUCon main window is displayed in Figure 10.
4. Experimental program
4.1 Description of experimental program
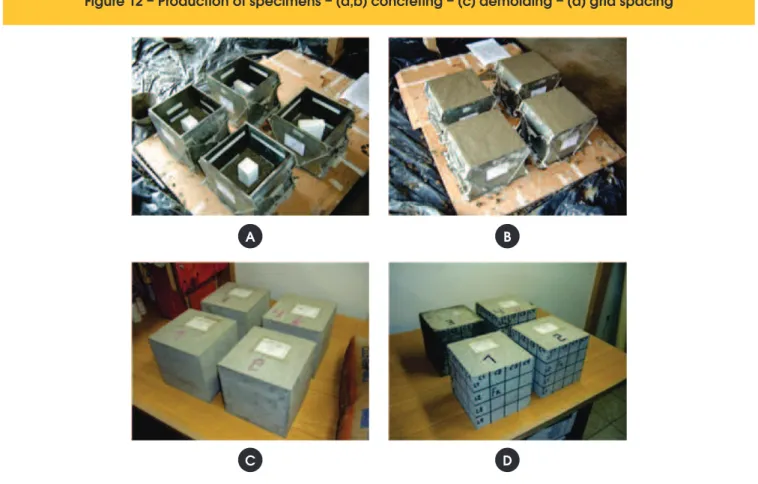
Four 20 cm cubic specimens were produced in the laboratory. In -side each specimen, a small EPS block was inserted prior to con -creting. Figure 11 shows the geometry of the produced cubes with the position and dimension of the EPS blocks. Metallic molds were used in order to obtain surfaces without irregularities, improving the ultrasound readings. The process of concreting and prepara -tion of specimens is shown in Figure 12.
Once demolded, the specimens were wrapped with plastic ilm for 10 days. A 5 cm grid spacing mesh (Figure 12-d) was chosen as reference for transducer position. Each specimen was tested using 200 kHz ultrasound transducers.
4.2 Ultrasound readings
The experiments were performed in a two-dimensional palne, us -ing a 2.5 cm spac-ing grid at the horizontal median plane of the specimens. This allowed performing an ultrasonic tomography at mid-height of the cube exactly at the middle of the internal law produced by the EPS. This coniguration is similar to a possible
Figure
7 – Pulse travels through
different discretized elements
Figure 8 – Pulse travels through
different discretized
elements with numbering
use in a linear element, for example, a column. Figure 13 shows the transducers positions. The 2.5 spacing grid yielded eigth reading points per cube side. As a consequence, a total of 128
readings were performed in each cube, with a total of 512 read -ings for all specimens.
The recommendation of a minimum distance of the transducers to
Figure 10 – Main window of the tomography software TUCon
Figure 11 – Concrete specimens with diferentes EPS blocks inside
(CP 1)
(CP 3)
(CP 2)
the edges of the object (MALHOTRA et al. [18]) was approximately
2.25 cm for the specimens tested here. Such a recommendation was not followed, because if the readings at the edges were not executed, the system of equations would be underdetermined (Figure 4-a), making it impossible to obtain a single solution. Thus, it was already expected that the readings taken at the edges of
specimens might suffer some interference that could relect in the resulting tomograms.
4.3 Results
After the experimental program has been concluded, the geometry,
Figure 12 – Production of specimens – (a,b) concreting – (c) demolding – (d) grid spacing
A
C
B
D
A
B
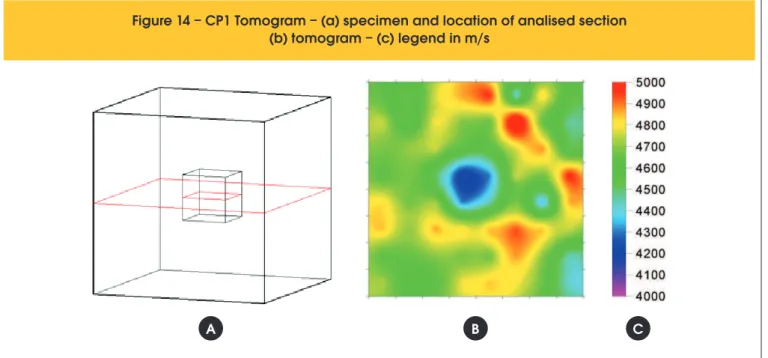
the grid spacing, and the travels time for each specimen were in -troduced in TUCon. TUCon, then, processed and exhibited the numerical results. These results were exported and inserted into another third-party program to generate, by linear interpolation, the tomograms shown, in Figure 14 to 17, representing sections at mid-height of specimens CP1, CP2, CP3 and CP4, respectively.
4.4 Analysis of results
The tomogram of CP1 specimen (Figure 14) showed good recon -struction of the analyzed section. It is clear that the 5 cm EPS block is at the center of the section with its correct size. In tomo
-Figure 14 – CP1 Tomogram – (a) specimen and location of analised section
(b) tomogram – (c) legend in m/s
A
B
C
Figure 15 – CP2 Tomogram– (a) specimen and location of analised section
(b) tomogram – (c) legend in m/s
A
B
C
gram of Figure 14, as well as in the others produced, there is some variation on the ultrasonic velocity in regions without internal laws, represented by the colors yellow to red. This variation does not in -validate the results, since it should be considered that in an actual experiment, the material is not homogeneous and thus the read -ings can bring small inaccuracies. These variations would tend to decrease if smaller grid spacings were used.
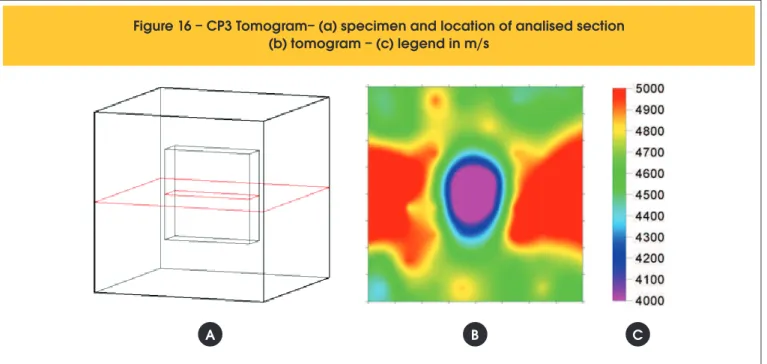
Figure 16 – CP3 Tomogram– (a) specimen and location of analised section
(b) tomogram – (c) legend in m/s
A
B
C
Figure 1
7 – CP4 Tomogram – (a) specimen and location of analised section
(b) tomogram – (c) legend in m/s
A
B
C
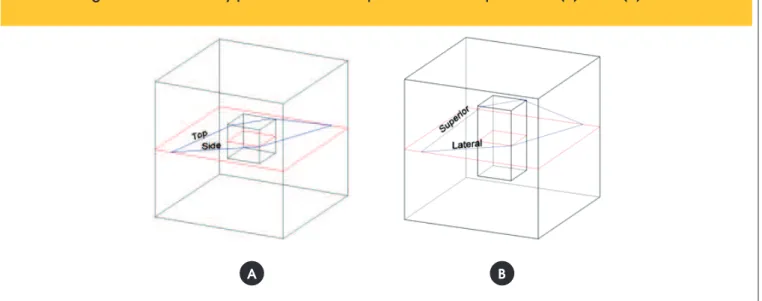
that the EPS size is the cause of such changes in the tomograms. The ray-paths in CP1 probably travel not only surrounding the sides of the EPS block, but also above and below it, depending on the reading. This does not occur in the readings performed on CP2. As an example, in CP1, the estimated travel length of the wave propagation surrounding the EPS block at its top face is 25.6 cm while the same length through the lateral side is 25.9 cm, as shown in Figure 18-a. Thus, the faster ray-path passes through the top face of the EPS block.
On the other hand, the height of EPS block in specimen CP2 pre -vents the faster ray-paths to travel through the top side of the EPS block since the total distance for this route is 27.5 cm while the
distance through the EPS side is 25.9 cm (Figure 18-b). This dif -ference between the EPS blocks of CP1 and CP2 generates larger ray-path to readings in CP2, explaining the observed stronger vio -let region in tomogram of Figure 15, when compared with the to -mogram of Figure 14.
wall effect. It only occurs because it is considered that ultrasonic pulses travel in linear path between the transducers.
The tomogram of CP4 specimen (Figure 17) shows a similar be -havior to the one for CP3 specimen (Figure 16), with wall effect also present in CP4, but overlapped in the vertical and horizontal directions. As noted, this provides more circular shape for the vio-let area in the tomogram.
5. Conclusions
As a result of this research, it can be concluded that the tomo-graphic software TUCon is able to assemble and to solve the to -mographic problem, having been validated from experimental data. The two-dimensional tomograms produced by ultrasound readings with 200 kHz transducers were able to well represent the analyzed sections of the specimens. The tomograms for CP3 and CP4 spec -imens exhibited some irregularities, suggesting an oval or circular shape for a rectangular internal law. This effect was called wall effect. It happened due to the consideration of linear ray-paths be-tween transducers.
The wall effect can be minimized by introducing an algorithm inside the tomographic processing that would calculate the real ray-path, avoiding objects or regions of low velocity. Jackson et al. [19] pro -posed a method to make this consideration. The implementation of this routine is already being developed and should be included in future versions of the software TUCon.
This work also demonstrated the great potential for the utilization of ultrasonic tomography in the nondestructive evaluation of con -crete structures. It is expected that this line of research will help to diffuse this knowledge in the academic and technical ields.
6. Acknowledgment
The authors would like to express their gratitute to CNPq, to the Research Group on Nondestructive Testing – GPEND of the Fed -eral University of Santa Catarina, and to Professor Ivo Padaratz by providing resources, equipment and physical space for this work.
Figure 18 – Possible ray-paths of ultrasound pulses within the specimen – (a) CP1 – (b) CP2
A
B
7. References
[01] EVANGELISTA, A. C. J. Avaliação da resistência do concreto usando diferentes ensaios não destrutivos. Tese (Doutorado em Engenharia Civil) – Universidade Federal do Rio de Janeiro, Rio de Janeiro, 2002. [02] LORENZI, A. Aplicação de redes neurais artiiciais
para estimativa da resistência à compressão do concreto a partir da velocidade de propagação do pulso ultra-sônico. Tese (Doutorado em Engenharia Civil) – Universidade Federal do Rio Grande do Sul, Porto Alegre, 2009.
[03] MACHADO, M. D. Curvas de correlação para caracterizar concretos usados no Rio de Janeiro por meio de ensaios não destrutivos. Dissertação (Mestrado em Engenharia Civil) – Universidade Federal do Rio de Janeiro, Rio de Janeiro, 2005. [04] STEIL, R. O. et al. Aplicabilidade de ensaios não
destrutivos em estruturas de concreto: um estudo de caso. In: 43° CONGRESSO BRASILEIRO DE CONCRETO, 2001, Foz do Iguaçu. Anais. Foz do Iguaçu: IBRACON, 2001. 1 CD-ROM.
[05] CÂMARA, E.; PINTO, R. C. de A. Avaliação da resistência à compressão do concreto in loco através de ensaios não destrutivos.
In: 48°CONGRESSO BRASILEIRO DE CONCRETO, 2006, Rio de Janeiro. Anais. Rio de Janeiro:
IBRACON, 2006. 1 CD-ROM.
[06] DORNELLES, F. L.; PINTO, R. C. de A.; PADARATZ, I. J. Detecção de falhas internas de concretagem através do uso do ultra-som. In: 47º CONGRESSO BRASILEIRO DE CONCRETO, 2004, Olinda. Anais. Olinda: IBRACON, 2004. 1 CD-ROM.
[07] BUTTCHEVITZ, A. W. et al. Análise da inluência da qualidade do adensamento na homogeneidade do concreto utilizando ensaio não destrutivo.
2010, Fortaleza. Anais. Fortaleza: IBRACON, 2010. 1 CD-ROM.
[08] SOARES JUNIOR, P. C.; PADARATZ, I. J.; PINTO, R. C. de A. Inluência da presença de armadura na detecção de falhas internas de concretagem através do uso do ultra-som. In: 48° CONGRESSO BRASILEIRO DE CONCRETO, 2006, Rio de Janeiro. Anais. Rio de Janeiro: IBRACON, 2006. 1 CD-ROM. [09] EMANUELLI JUNIOR, A. C. et al. Emprego do
ultrassom para detectar a presença de cabos de protensão em estruturas de concreto.
In: 52° CONGRESSO BRASILEIRO DE CONCRETO, 2010, Fortaleza. Anais. Fortaleza: IBRACON, 2010. 1 CD-ROM.
[10] EMANUELLI JUNIOR, A. C.; PADARATZ, I. J.; PINTO, R. C. de A. Emprego do ultrassom,
eco-impacto e termograia infravermelha para detectar falhas de injeção em cabos de protensão
(pós-tensionados).
In: 53° CONGRESSO BRASILEIRO DE CONCRETO, 2011, Florianópolis. Anais. Florianópolis: IBRACON, 2011. 1 CD-ROM.
[11] PERLIN, L. P. Tomograia ultrassônica em concreto: desenvolvimento de ferramenta computacional. Dissertação (Mestrado em Engenharia Civil) – Universidade Federal de Santa Catarina, Florianópolis, 2011.
[12] MARTIN, J. et al. Ultrasonic tomography of grouted duct post-tensioned reinforced concrete bridge beams. NDT&E International, Oxford, v. 31, p. 107-113, 2001. [13] HAASE, A. (Ed.); LANDWEHR G. (Ed.); UMBACH.
E. (Ed.). Röntgen centennial: x-rays in natural and life sciences. Singapore: World Scientiic Publishing, 1997.
[14] DEANS, S. R. The Radon transform and some of its applications. New York: John Wiley & Sons, 1983. [15] IUSEM, A. N.; PIERRO A. R. de. Fundamentos
matemáticos da tomograia computadorizada: método de transformações. Revista Matemática Universitária, São Paulo, n. 11, p. 53-65, 1990a.
[16] ______. Fundamentos matemáticos da tomograia computadorizada: método de expansão em séries. Revista Matemática Universitária, São Paulo, n. 12, p. 57-85, 1990b.
[17] FILLER, A. G. The history, development and impact of computed imaging in neurological diagnosis and neurosurgery. Disponível em: <http://dx.doi.org/10.1038/npre.2009.3267.5>. Acesso em: 5/12/2010.
[18] MALHOTRA, V. M.; CARINO, N. J. Handbook on nondestructive testing of concrete. 2. ed. West Conshohocken: Chemical Rubber Company Press, 2004. [19] JACKSON, M. J.; TWEETON, D. R. MIGRATON -
Geophysical tomography using wavefront migration and fuzzy constraints. Minneapolis: U.S. Bureau of Mines, 1994. Report Investigation 9497.