*e-mail: [email protected]
Recebido: 29/12/2012 / Aceito: 05/07/2013
The implementation of the Neuroid in the Gate Control System
leads to new ideas about pain processing
Erick Javier Argüello Prada*, Ricardo José Silva Bustillos
Abstract Introduction: Several theories have been proposed to elucidate the mechanisms related with pain perception, among which, the Gate Control Theory (GCT) provides one of the most explicit explanations. This theory, as elegantly conceived, is unable to explain how the Frequency-Intensity (F-I) curves exhibited by Aβ- and C-ibres inluence pain processing. In this paper, a novel neuron-model known as the Neuroid, which emphasizes the functional rather the physiological character of nerve cells, was used as the main building block to replicate the Gate Control System (GCS). Methods: Two Aβ-ibre models were built: one model that preserved the paradoxical relation between the activation threshold and the F-I curve slope, and one model based on the hypothetical average response across the receptive ield. Results: The results suggest that the average response of the Aβ-ibres does not increase monotonically but reaches a plateau for high intensity stimuli. In addition, it was seen that activation of C-ibres does not necessarily imply the activation of projection neurons and, therefore, the onset of pain sensation. Also, we observed that the activation of Aβ-ibres may both, decrease and increase the activity of the projections neurons, an aspect which has not been directly described in previous works. Conclusion: Hypothetical implications arise as a consequence of the implementation of the Neuroid, speciically, about the correlation between the intensity of stimulation and the physiological pain threshold.
Introduction
Pain is currently conceived as a complex phenomenon that involves both physiological and psychological processes (Merskey and Bogduk, 1994). This duality demands an interdisciplinary approach. Different theories have been proposed to elucidate the mechanisms associated with pain perception, among which, Melzack and Wall’s Gate Control Theory (1965) provides one of the most explicit explanations. This theory states that the impulses from nociceptive afferents are modulated by the activity of somatosensory afferents, such that the perceived pain sensation, may increase or decrease in intensity. This explains why when we get injured we immediately rub the area around the injury, and pain sensation decreases.
Due to its explicit nature, the Gate Control Theory (GCT) was successfully described in mathematical terms (Britton and Skevington, 1989). This led to the development and implementation of several computational models, speciically for the study of acute pain (Prince et al., 2004). Many of such models have been developed at the cellular and molecular levels (Britton and Skevington, 1989; Britton et al. 1995, 1996; Xu et al., 2008), as well as at the neural network level (Minamitani and Hagita, 1981; Haeri et al., 2003). Nevertheless, although some implementations have included morphological and functional differences between primary sensory afferents (Agi et al., 2010), the GCT, as elegantly conceived, does not explain how this differences inluence the modulation of nociceptive impulses. It is widely accepted that large-diameter thickly-myelinated mechanoreceptors (Aβ-ibres) respond to tactile stimuli and show high conduction velocities, whereas small-diameter thinly-myelinated/unmyelinated nociceptors (Aδ- and C-ibres) are activated by high intensity stimuli and show lower conduction velocities. Several groups (Cain et al., 2001; Slugg et al., 2000; Van Hees and Gybels, 1981) have totalized the number of action potentials evoked as a function of mechanical stimulus intensity, but this characterization was restricted to thinly-myelinated/unmyelinated afferent neurons and no recent studies seem to be available to compare the frequency-intensity (F-I) characteristics (also referred as stimulus-response function) of mechanoreceptors and nociceptors. On the other hand, some studies (Levy and Strassman, 2002; Slugg et al., 2000) demonstrate that F-I characteristics of Aδ-iber nociceptors exhibit relatively low thresholds and steep slopes, whereas C-iber nociceptors exhibit high thresholds and lat slopes. In fact, the latness observed in C-iber responses suggested that they could not encode high intensity mechanical stimuli. Subsequent studies
show that the average response of C-iber nociceptors across the receptive ield does not reach a plateau, but increases monotonically with stimulus intensity (Slugg et al., 2004). This leads to the assumption that individual and collective responses of Aβ-ibres may also differ. Even though there is an inverse correlation between the activation threshold and the slope of the F-I curve (the higher the threshold, the lower the slope of the curve), the average response of Aβ-ibres should reach a plateau rather than increase monotonically to a high intensity mechanical stimulation. Otherwise, although nociceptors were activated, we could not perceive pain since their response would always be obscured by the activity of tactile ibres.
In this paper, we replicate the Gate Control System (GCS) using the Neuroid (Argüello et al., 2012) to offer some explanations about how the noxious information is processed at the dorsal horn, considering the differences between primary sensory afferents regarding to their F-I curves.
Methods
A “customizable” Neuron-model
In a recent work, a neuron-model based on the mathematical description of the signal transmitted along the neuron’s axon (i.e. the train of action potentials), the Neuroid, was developed (Argüello et al., 2012). Let δ(t) be a single spike, if the resulting depolarization
s(t) exceeds the activation threshold umbr, then the signal propagating along the axon, y(t), is given by
( )
( )
0 – , – β δ ∞ = = ∑ n n T
y t t
s t umbr (1)
where T is the time between two consecutive spikes, and β is the reciprocal of the Neuroid’s F-I curve slope. This frequency-modulated impulse train is “demodulated” into a graded signal, nt_out(t), which resembles the input signal, s(t), but prolongs over a inite period of time after the last spike, to model somehow the temporal and concentration proiles of neurotransmitter in the synaptic cleft (nt_out(t) ≈ s(t)). As described by Argüello et al. (2012), two other parameters were required to adjust the amplitude of the output signal (Kr), and prevent indeinite
growth (maxcount). The simulation was performed in LabVIEW (version 10.0 running on Acer Aspire One) by three algorithms, to emphasize the computational (functional) rather than physiological neuron-model, known as the Neuroid.
Modeling the gate control system
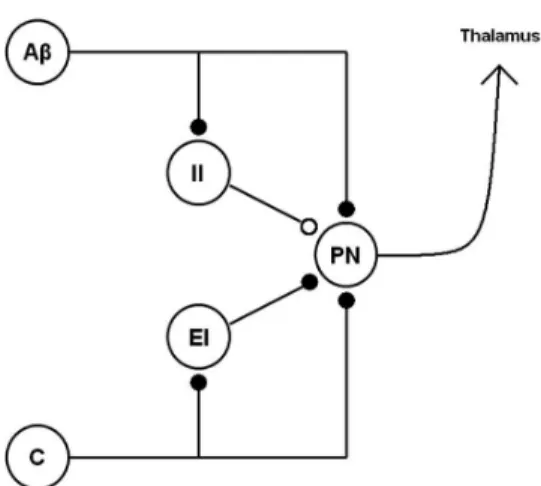
Figure 1, the projection neuron (PN) received signals from one large-diameter neuron (Aβ), one small-diameter neuron (C), one excitatory interneuron (EI), and one inhibitory interneuron (II). For both, Aβ- and C-ibres, we used the median mechanical thresholds reported by Cain et al., (2001). To get the F-I curve
slope, we found the equation of the line (f(i) = mi + b) that best its the experimental results obtained by Slugg et al. (2000) and by Prescott and De Koninck (2002), for C-iber and lamina I tonic interneurons, respectively, such that it was possible to correlate each experimental equation with the F-I curve of the Neuroid, which is shown as follows
( )
– .N i umbr f i
T T
=β β (2)
Thus, with T = 2 ms (the minimum value of time between two consecutive spikes in LabVIEW environment), we correlated the slope of the experimental line equation (denoted as m) with 1/βT, such that we could get the value of β. For interneurons, the activation threshold was set as the minimum current value for which was obtained a measurable response. The mechanical stimulation range used by Slugg et al. (2000) was extended to 200 mN, since values for mechanical cutaneous pain threshold varies between 70 and 130 mN, as has been reported in clinical studies of healthy patients (Rolke et al., 2006; Wienemann and Chantelau, 2012). The range of electrical stimulation used in the characterization of the lamina I tonic interneurons (0-300 pA), as well as the one used by Slugg et al. (2000), was normalized. The parameters obtained for lamina I interneurons were also used to conigure the projection neuron.
For the Aβ-ibre, two models were built: one irst model that preserved the paradoxical relation between the activation threshold and the slope of the F-I curve, and another one based on the hypothetical average response of mechanoreceptors across the receptive ield. The value of β was arbitrarily assumed to guarantee that the F-I curve of the Aβ-ibre model had a steeper slope. For the second model, a change in the slope value would occur at 35 mN; then this line would intersect the F-I curve of the C-ibre at 70 mN (see Figure 2). Thus, the F-I curve could reach a “plateau” at mechanical intensities below the mechanical pain threshold. We adjusted the values of Kr and maxcount, such that nt_out(t) ≈ s(t) for each single Neuroid, in agreement with the results obtained by Argüello et al. (2012). The values of the parameters are summarized in Table 1.
To allow the interconnection of two or more Neuroids and, at the same time, emulate the excitatory and inhibitory inluences depicted in the GCS, we built an additional block that allowed us to obtain a linear combination of multiple inputs, each of which would be multiplied by a synaptic weight(W > 0 for excitatory inluence, and W < 0 for inhibitory inluence). Since the projection neuron receives three terminals with positive sign and only one with negative sign, we thought we could balance excitatory and inhibitory inluences as a function of the number of inputs as follows:
neWe + niWi = 0, (3)
where ne and ni represent the total number of excitatory and inhibitory inputs, respectively, and We and Wi their corresponding synaptic weights. As far we know, the inhibitory neurons represent almost 1/3 of the total population of neurons in laminae I-III (Todd and Sullivan, 1990), but direct measurements
Figure 1. The architecture of the Gate Control System used for
modeling purposes. The descending control pathway was omitted. Filled circle: excitatory inluence. Empty circle: inhibitory inluence. Aβ: Aβ-ibre. C: C-ibre. EI: excitatory interneuron. II: inhibitory interneuron. PN: projection neuron.
Figure 2. Frequency-Intensity curves for modeling different primary
of the excitatory inhibitory ratio at the dorsal horn are unavailable, so that we had to carry out several simulations in order to empirically ind the value of
Wi, assuming We = 1.
Once built the GCS, we simulated the tactile somatosensory process by simultaneously stimulating both primary afferent neurons. The response of the projection neuron to progressive increases of the input signal (5, 10, 20, 40, 60, 80, 110, 140, 170 and 200 mN) was plotted over a 10 seconds window, as well as the Aβ- and C-ibre responses. Using We = 1, we varied Wi to observe any change in the response of the projection neuron. Two additional simulations were performed to compare the activity developed by the projection neuron under two different conditions of stimulation: an increasing nociceptor input (same values showed above) with no stimulation on the Aβ-ibre, and a constant C-ibre input (80 mN) with variable Aβ-ibre input (5, 10, 20, 30, 40, 60, 80, 100, 120 and 140 mN). The irst simulation was repeated for each Aβ-ibre model, whereas the others were performed using only the average response model.
Results
The F-I Relation of the Aβ-ibres could
modulate pain perception
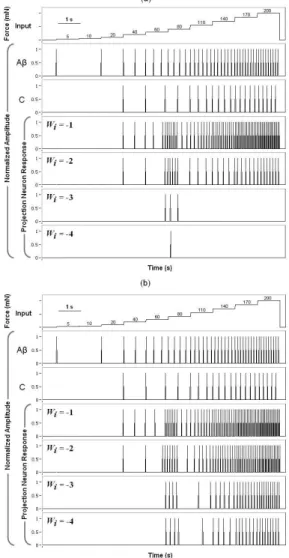
As illustrated in Figure 3a, for Wi ≤ –3, the projection
neuron showed no signiicative response to progressive increases of the input signal from 0 to 200 mN, when the Aβ-ibre model that preserved the inverse correlation between threshold and slope was used in the GCS. In constrast, when we used the average response model, the projection neuron kept on iring for mechanical intensities ≥ 80 mN (see Figure 3b).
Nociceptors activation and the modulation of nociceptive information
Using the average response Aβ-ibre model and
Wi = –3, with no stimulation on the Aβ-ibre, the C-ibre
Table 1. Settings for the 5-Neuroid array that replicates the Gate Control System.
Neuron type Parameters
umbr T (ms) β = 1/mT Kr maxcount (ms)
Aβ-Fibre 0.011(1) 2(3) 8.3 2.4 32(3)
C-Fibre 0.122(1) 2(3) 79.34(4) 9.1 32(3)
Excitatory Interneuron 0.067(2) 2(3) 11.25(5) 3.1 32(3)
Inhibitory Interneuron 0.067(2) 2(3) 11.25(5) 3.1 32(3)
Projection Neuron 0.067(2) 2(3) 11.25(5) 3.1 32(3)
(1): Normalized value from Cain et al. (2001) (0-200 mN). (2): Normalized value from Prescott and De Koninck (2002) (0-300 pA). (3): Based on
the results obtained by Argüello et al. (2012). (4): Based on the results obtained by Slugg et al. (2000). (5): Based on the results obtained by Prescott
and De Koninck (2002).
Figure 3. Response of the projection neuron to progressive increases of the input signal using the paradoxical model of Aβ-ibre (a), and the average response model (b).
progressively increased the stimulation intensity on the Aβ-ibre, such that we could modulate the response of the projection neuron. Figure 5 shows a slight increase in the iring frequency of the projection neuron, for mechanical intensities between 5 and 10 mN on the Aβ-ibre. When the stimulus amplitude was increased above 40 mN, the iring frequency of the projection neuron decreased substantially. Finally, for stimuli greater than 100 mN, there was no response in the projection neuron.
Discussion
As established by Melzack and Wall’s Gate Control Theory, pain perception is modulated by a gate mechanism found in the spinal cord, whose activation is conditioned by the activity of tactile afferents, at a peripheral level, as well as by cognitive and emotional processes that occur in the structures of the central
nervous system (Melzack and Wall, 1965). The descending control pathway was omitted because we wanted to emphasize the peripheral control mechanism. The results from the irst two simulations suggest that the average response of the Aβ-ibres across the receptive ield does not increase monotonically at high amplitudes of stimulation, but it reaches a plateau, as assumed for the construction of the second model of Aβ-ibre. Otherwise, it would be impossible to perceive pain at all, even in response to stimuli capable of inlicting real damage. But, how could we justify this hypothesis to the paradoxical relationship between the activation threshold and the slope of the F-I curve? First, by deinition, the mechanoreceptors respond to low-intensity mechanical stimuli, but also respond to high intensity stimuli as do the nociceptors; the difference is that only the latter encode noxious stimuli (Devor, 2009). Physiologically, there would be no reason why mechanoreceptors had to encode high intensity stimuli, since that is the purpose of nociceptors; therefore, the F-I slope curve of the Aβ-ibre should be latter for high intensity stimuli. Second, the refractory period (or the amount of time it takes for a neuron to ire a second potential action under stimulation) may limit the iring frequency to a maximum value, no matter how above the threshold is the stimulus amplitude. This maximum iring frequency may be different between mechanoreceptors and nociceptors since they express different families of sodium channels, which inluences the temporal proiles of the action potentials evoked by each type of iber (Fang et al., 2005). Third, the recruitment of rapidly adapting mechanoreceptors as a consequence of the increase in the stimulation intensity, could approximate the average response across the receptive ield to the one proposed in this paper, since the responses of these mechanoreceptors may statistically cancel the responses exhibited by slowly adapting mechanoreceptors.
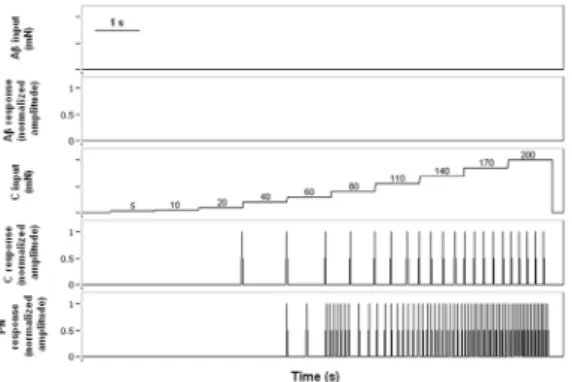
From the third simulation, we observed that the activation of nociceptors does not necessarily imply an activation of projection neuron, and therefore, the onset of pain sensation. This is consistent with experimental evidence that demonstrates the fundamental difference between the threshold of pain perception and the activation threshold of nociceptive afferents (Van Hees and Gybels, 1981). It is worth noting that the projection neuron start iring at 60 mN or greater, when no stimulus was applied on the Aβ-ibre (average response model), unlike what was observed in the previous simulation, when both primary afferents were stimulated simultaneously (the neuron projection intensities responded to 80 mN or greater), suggesting the existence of a range of intensities within which the mechanoreceptors could modulate the information
Figure 4. With no stimulation on the Aβ-ibre, the C-ibre responded
to intensities greater or equal than 40 mN, but the projection neuron started iring at 60 mN or greater, suggesting that nociceptors activation does not necessarily lead to pain experience.
conveyed by the nociceptors. As originally stated in the GCT, the large-diameter thickly-myelinated ibres exert excitatory as well as inhibitory inluence on spinal neurons transmitting nociceptive information, whereas the inluence exerted by the small-diameter thinly-myelinated/unmyelinated ibres is exclusively excitatory, as observed after carrying out the fourth simulation. As shown in Figure 5, the activation of the ibres that encode stimuli in a range of non-noxious intensities could not only reduce the activity of the projection neuron, but also increase it for a small range of intensities (5-10 mN). This is an aspect that has not been directly described in previous implementations of biophysically accurate neuron models for the study of pain (Agi et al., 2010; Britton et al., 1996; Xu et al., 2008), which only emphasize the inhibitory action exerted by Aβ-ibres. Another aspect worth mentioning is the fact that, even though the F-I curve of the Neuroid is described as a linear relationship (see (2) in Methods), the response of the projection neuron stimulation to progressive increases was not linear. These nonlinearities are a hallmark of neural networks and become more evident through the implementation of much simpler neural models, like the Neuroid.. In fact, it has been showed that the collective properties of neural networks often prevail over the individual properties of single units, regardless of the level of description that was used to build the main building block (Hopield, 1882, 1984). This would allow us to focus not only on the most relevant computational aspects of nerve cells, but also on the collective capabilities of “pain networks” as processing units, composed of multiple subunits.
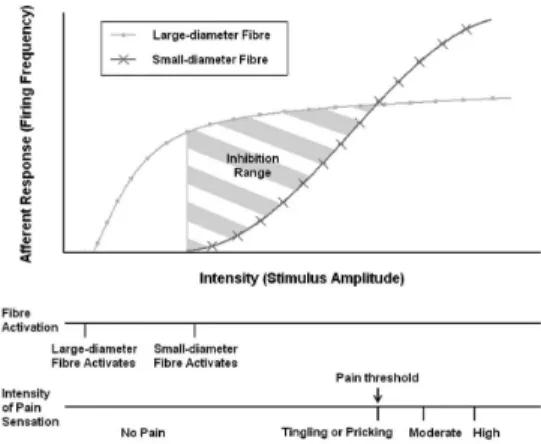
Through the implementation of the Neuroid, we formulated several hypotheses about how the F-I exhibited by Aβ- and C-ibres inluences the processing of the noxious information at the dorsal horn. These assumptions were made based on the absence of studies that make possible to compare the F-I curves of mechanoreceptors and nociceptors, under the same mechanical stimulation protocol. Results from simulation conirmed the original postulates of the GCT, but taking into account the functional differences between the two types of primary afferent ibres. All of this led us to propose a possible explanation for pain processing at the dorsal horn. As shown in Figure 6, for low intensity stimuli, the small-diameter ibres remain inactive and no pain sensation will be perceived. When the intensity increases enough to activate the nociceptors, the large-diameter ibres start reaching their maximum iring frequency, but the balance in activity between small- and large-diameter afferents is still in favor of a non-painful response. Only when the activity of nociceptors exceeds the inhibitory action exerted by the non-noxious ibres,
the pain is consciously experienced. Since we cannot actually stimulate large- and small-diameter afferents separately, if the sensory energy increases enough to cause tissue damage, then the nociceptor’s activity should rise quickly above the one that still exert the non-noxious ibres, which in turn loses signiicance once the stimulus becomes harmful. Thus, we could associate the alterations in physiological pain threshold to the variations in the F-I curves belonging to the neurons involved in pain pathways. It has been reported that the F-I curves of mechanical C-ibres experience signiicant changes in both, inlammatory and neuropathic states (Ahlgren et al., 1997). Therefore, by using a standardized protocol of stimulation, it would be possible to detect some pathologies by exploring the variability of these thresholds, such that this could lead to novel approaches for treatment of these painful conditions.
We used the Neuroid for replicating the Gate Control System of Pain. From its implementation, which emphasized the different F-I curves exhibited by Aβ- and C-ibres, we believe that is possible to achieve a greater understanding of how sensory information is encoded, including those associated with pain perception. This not only supports the utilization of modeling for the study of pain, but also shows that future implementations can generate new indings leading to a hypothesis that can be tested experimentally.
Acknowledgments
The lead author thanks Prof. Ernesto Granado for his valuable ideas during the development of the Neuroid, and Prof. José Bubis, for his useful observations during the realization of this paper.
References
Agi E, Ozgen C, Purali N. Modeling of gate control neuronal circuitry including morphologies and physiologies of component neurons and ibres. In: Kothare MV, Tade MO, Vande Wouwer A, Smets I, editors. DYCOPS 2010: Proceedings of the 9th International Symposium on Dynamics and Control of Process Systems; 2010 Jul 5-7; Leuven, Belgium. Leuven: International Federation of Automatic Control; 2010. p. 857-62.
Ahlgren SC, Wang JF, Levine, JD. C-iber mechanical stimulus-response functions are different in inlammatory versus neuropathic hyperalgesia in the rat. Neuroscience. 1997; 76(1):285-90. http://dx.doi.org/10.1016/ S0306-4522(96)00290-4
Argüello E, Silva R, Castillo C, Huerta M. The neuroid: a novel and simpliied neuron-model. Proceedings of the 2012 Annual International Conference of the IEEE, Engineering in Medicine and Biology Society (EMBC). 2012;2012:1234-7. Pmid:23366121. http://dx.doi. org/10.1109/EMBC.2012.6346160
Britton NF, Skevington SM. A mathematical model of the gate control theory of pain. Journal of Theoretical Biology. 1989; 137(1):91-105. http://dx.doi.org/10.1016/ S0022-5193(89)80151-1
Britton NF, Skevington SM, Chaplain MAJ. Mathematical modeling of acute pain. Journal of Biological Systems. 1995; 3(4):1119-24. http://dx.doi.org/10.1142/ S0218339095001003
Britton NF, Chaplain MAJ, Skevington S. The role of N-methyl-D-aspartate (NMDA) receptors in wind-up: a mathematical model. IMA Journal of Mathematics Applied in Medicine and Biology. 1996; 13(3):193-205. http://dx.doi. org/10.1093/imammb/13.3.193
Cain DM, Khasabov SG, Simone DA. Response properties of mechanoreceptors and nociceptors in mouse glabrous skin: an in vivo study. Journal of Neurophysiology. 2001; 85(4):1561-74. PMid:11287480.
Devor M. Ectopic discharge in Abeta afferents as a source of neuropathic pain. Experimental Brain Research. 2009; 196(1):115-28. PMid:19242687. http:// dx.doi.org/10.1007/s00221-009-1724-6
Fang X, McMullan S, Lawson SN, Djouhri L. Electrophysiological differences between nociceptive and non-nociceptive dorsal root ganglion neurones in the rat in vivo. Journal of Physiology. 2005; 565(3):927-43. PMid:15831536 PMCid:PMC1464557. http://dx.doi. org/10.1113/jphysiol.2005.086199
Haeri M, Asemani D, Gharibzadeh S. Modelling of Pain Using Artiicial Neural Networks. Journal of Theoretical Biology. 2003; 220(3):277-84. http://dx.doi.org/10.1006/ jtbi.2003.3130
Hopield JJ. Neural networks and physical systems with emergent collective computational abilities. Proceedings of the National Academy of Sciences. 1972; 79(8):2554-8. http://dx.doi.org/10.1073/pnas.79.8.2554
Hopfield JJ. Neurons with graded response have collective computational properties like those of two-state neurons. Proceedings of the National Academy of Sciences. 1984; 81(10):3088-92. PMid:6587342 PMCid:PMC345226. http://dx.doi.org/10.1073/ pnas.81.10.3088
Levy D, Strassman AM. Mechanical response properties of A and C primary afferent neurons innervating the rat intracranial dura. Journal of Neurophysiology. 2002; 88(6):3021-31 PMid:12466427. http://dx.doi.org/10.1152/jn.00029.2002
Melzack R, Wall PD. Pain mechanisms, a new theory. Science. 1965; 150(3699):971-9. http://dx.doi.org/10.1126/ science.150.3699.971
Melzack R, Wall PD. The challenge of pain. 2nd ed. Harmonsworth: Penguin Books; 1982.
Merskey H, Bogduk N. Classiication of chronic pain: deinitions of chronic pain syndromes and deinitions of pain terms. 2nd ed. International Association for the Study of Pain, IASP Press; 1994.
Minamitani H, Hagita N. A neural network model of pain mechanisms: computer simulation of the central neural activities essential for the pain and touch sensations. IEEE Transactions on System, Man, and Cybernetics. 1981, 11(7):481-93. http://dx.doi.org/10.1109/ TSMC.1981.4308725
Prescott SA, De Koninck Y. Four cell types with distinctive membrane properties and morphologies in lamina I of the spinal dorsal horn of the adult rat. Journal of Neurophysiology. 2002; 539(3):817-36. http://dx.doi. org/10.1013/jphysiol.2001.013437
Prince KM, Campbell J, Picton P, Turner S. A computational model of acute pain. In: Horton G. Proceedings of the 18th European Simulation Multiconference; 2004 Jun 13-16; Magdeburg, Germany. Magdeburg: SCS Europe; 2004.
Rolke R, Baron R, Maier C, Tölle TR, Treede RD, Beyer A, Binder A, Birbaumer N, Birklein F, Bötefür IC, Braune S, Flor H, Huge V, Klug R, Landwehrmeyer GB, Magerl W, Maihöfner C, Rolko C, Schaub C, Scherens A, Sprenger T, Valet M, Wasserka B. Quantitative sensory testing in the German Research Network on Neuropathic Pain (DFNS):standardized protocol and reference values. Pain. 2006; 123(3):231-43. PMid:16697110. http://dx.doi. org/10.1016/j.pain.2006.01.041
Slugg RM, Meyer RA, Campbell JN. Response of Cutaneous A- and C-Fiber Nociceptors in the Monkey to Controlled-Force Stimuli. Journal of Neurophysiology. 2000; 83(4):2179-91. PMid:10758127.
Van Hees J, Gybels J. C nociceptors activity in human nerve during painful and non painful skin stimulation. Journal of Neurology, Neurosurgery & Psychiatry. 1981; 44(7):600-7. http://dx.doi.org/10.1136/jnnp.44.7.600
Wienemann T, Chantelau EA. The diagnostic value of measuring pressure pain perception in patients with diabetes
Authors
Erick Javier Argüello Prada*
Laboratorio “C”, Departamento de Electrónica y Circuitos, Universidad Simón Bolívar – USB, Valle de Sartenejas, Baruta, Caracas, Venezuela.
Ricardo José Silva Bustillos
Laboratorio de Biociencias Integradas “Prof. Luis Lara Estrella”, Programa Prometeo, Secretaría de Educación Superior, Ciencia y Tecnología del Ecuador, Universidad Simón Bolívar – USB, Valle de Sartenejas, Caracas, Venezuela.
mellitus. Swiss Med Wkly. 2012; 142:w13682. http://dx.doi. org/10.4414/smw.2012.13682