Hospital Universitário Clementino Fraga Fº - UFRJ
Mailing address: Fátima Palha de Oliveira – Rua das Laranjeiras, 136/203 – 22240-000 – Rio de Janeiro, RJ, Brazil – e-mail: [email protected]
English version by Stela Maris C. Gandour
Objective – To compare gas exchange at rest and du-ring exercise in patients with chronic Chagas’ heart disea-se grouped according to the Los Andes clinical/hemody-namic classification.
Methods – We studied 15 healthy volunteers and 52 patients grouped according to the Los Andes clinical/he-modynamic classification as follows: 17 patients in group IA (normal electrocardiogram/echocardiogram), 9 pa-tients in group IB (normal electrocardiogram and abnor-mal echocardiogram), 14 patients in group II (abnorabnor-mal electrocardiogram/echocardiogram, without congestive heart failure), and 12 patients in group III (abnormal elec-trocardiogram/echocardiogram with congestive heart failure). The following variables were analyzed: oxygen consumption (VO2), carbon dioxide production (VCO2), gas exchange rate (R), inspiratory current volume (VIC), expi-ratory current volume (VEC), respiratory frequency, minute volume (VE), heart rate (HR), maximum load, O2 pulse, and ventilatory anaerobic threshold (AT).
Results – When compared with the healthy group, pa-tients in groups II and III showed significant changes in the following variables: VO2peak, VCO2peak, VICpeak, VECpeak, E, HR, and maximum load. Group IA showed significantly better results for these same variables as compared with group III.
Conclusion – The functional capacity of patients in the initial phase of chronic Chagas’ heart disease is higher than that of patients in an advanced phase and shows a decrease that follows the loss in cardiac-hemodynamic performance.
Key words: chronic Chagas’ heart disease, cardiopulmo-nary exercise test, oxygen consumption.
Arq Bras Cardiol, volume 75 (nº 6), 490-498, 2000
Fátima Palha de Oliveira, Roberto Coury Pedrosa, Antonio Giannella-Neto
Rio de Janeiro, RJ - Brazil
Gas Exchange During Exercise in Different Evolutional Stages
of Chronic Chagas’ Heart Disease
Even though quantifying the response to exercise in patients with heart diseases of different etiologies has been the aim of many studies, those studing alterations in the functional capacity of patients with the cardiac form of Cha-gas’ disease are scarce. However, quantification and analy-sis of the functional capacity in different phases of chronic chagasic heart disease are of practical interest because they generate precise information about the oxygen capa-city of transportation and use, i.e., the functional capacapa-city of the lungs and the cardiovascular, muscular, and metabolic systems combined. This assessment provides the clinician with data for establishing a prognosis 1, and it is important in
the follow-up of the therapeutical response and evaluation of the adaptation of these patients during a rehabilitation program. Based on oxygen consumption (VO2) and the ana-erobic threshold reached during the cardiopulmonary exer-cise test, the clinician can decide whether the patient is qua-lified or not for a study 2 and can orient the appropriate level
of the patient’s daily activities. This along with the analysis of other parameters may provide the clinician with informa-tion for deciding whether a cardiac transplantainforma-tion is necessary 3,4.
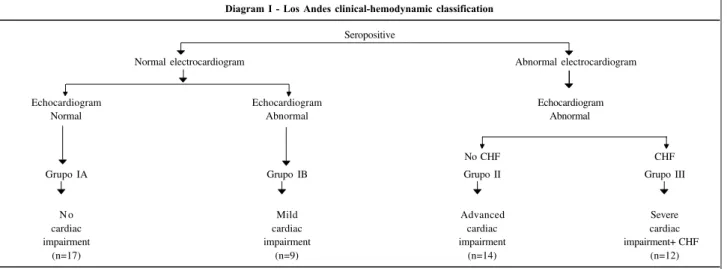
The present study aims to quantify and analyze the gas exchange at rest and during exercise in patients with chronic Chagas’ heart disease relating the results to the stage of the disease according to the modified Los Andes clinical/hemodynamic classification 5,6 (diagram I).
Methods
cardio-pulmonary exercise tests one week apart. The results of these 2 tests were used for analyzing the reproducibility of the measurements of gas exchange performed at the labora-tory, which generated satisfactory results allowing the pa-tients to start their tests. The result of the first test in the healthy group was used for comparison with the results of the patients in the other groups.
Patients for the study were selected among the 200 patients followed up in the cardiology outpatient clinics for Chagas’ heart disease of the HUCFF and was based on the following exclusion criteria: patients with hypertension, chronic obstructive pulmonary disease, cardiomyopathy of any other type or cause, thyroid dysfunction, known immu-nological dysfunction, rheumatic valvar disease, congeni-tal heart disease, coronary artery disease, patients with car-diac pacemakers, patients with neuromuscular disorders, athletes, and patients who did not reach the anaerobic thre-shold when undergoing the test.
All patients selected were males with ages ranging from 20 to 72 years (mean of 50±11 years). They had positive indirect hemagglutination reaction and indirect immuno-fluorescence for T. cruzi. They had no other associated diseases and had a stable clinical condition for the last 3 months. They were grouped according to the Los Andes clinical/hemodynamic classification (diagram I), which is based on electrocardiographic, echocardiographic (M-mode and two-dimensional echocardiogram with intracavi-tary Doppler), and physical examination findings. Electro-cardiographic changes were classified according to the New York Heart Association criteria. The Minnesota code modified for Chagas’ heart disease 7 was used to
standar-dize the electrocardiogram interpretation. The echocardio-graphic assessment consisted of the analysis of the seg-mentary cardiac function of the patients, and it was expres-sed as systolic thinning or deficit of thickening. The diasto-lic dysfunction was expressed according to the standard “deficit of relaxation” and “restrictive pattern” 8. Left
ventri-cular ejection fraction was calculated by the method of
Teicholz et al 9. Three observers analyzed the tests
(echocar-diogram and electrocar(echocar-diogram) and, in case of discordance between them, another reading was performed by one of the researchers to get a definitive result. The diagnosis of con-gestive heart failure met the criteria of the Framingham Heart Study 10.
The patients were classified into groups according to the Los Andes classification as follows: 17 patients in group IA (normal electrocardiogram and echocardiogram – no heart involvement), 9 patients in group IB (normal elec-trocardiogram and abnormal echocardiogram – mild heart involvement), 14 patients in group II (abnormal electrocar-diogram and echocarelectrocar-diogram, without congestive heart fai-lure – advanced heart involvement), and 12 patients in group III (abnormal electrocardiogram and echocardiogram with congestive heart failure – severe heart involvement). These patients were living in Rio de Janeiro at the time of the study but had been born in endemic areas for Chagas’ disease (47% had been born in Bahia State, 25% in Paraiba State, 16% in Ceará State, 5% in Minas Gerais State, and 1 patient had been born in Rio de Janeiro State) and had been away from endemic areas for more than 20 years. In the medi-cal visit prior to the cardiopulmonary exercise test, the pa-tients using medications were instructed to suspend them 48 hours prior to the test. No clinical problems occurred during the study.
This study was approved by the local Ethics Com-mittee (HUCFF) abiding by the national and international guidelines for research on human beings (1995), which re-gulate experiments with humans. The patients underwent the tests only after written consent.
Protocol of exercise – A Monark mechanical cycloer-gometer was used in a continuous test with loads increa-sing (15 watts) every minute. This protocol was chosen be-cause it is better tolerated by the patients and bebe-cause it al-lows reaching high O2 values with a total test duration of 8 to 10 minutes 11. The pedal frequency was fixed as 60 rotations
per minute. The exercise period was preceded by a 4-minute
Diagram I - Los Andes clinical-hemodynamic classification
Seropositive
Normal electrocardiogram Abnormal electrocardiogram
Echocardiogram Echocardiogram Echocardiogram Normal Abnormal Abnormal
No CHF CHF
Grupo IA Grupo IB Grupo II Grupo III
N o Mild Advanced Severe
cardiac cardiac cardiac cardiac
impairment impairment impairment impairment+ CHF
(n=17) (n=9) (n=14) (n=12)
rest and a 2-minute warm-up with zero load, and followed by a 12-minute recovery, 3 minutes of which were in the active form (25 watts) and 9 minutes in the passive form. Electrocar-diographic signals (SDM 2000, Dixtal) and heart rate were re-corded during the entire test, which was interrupted in the presence of symptoms hindering its continuity or that repre-sented risk for the patient, or both. We analyzed only the tests in which the patients reached the anaerobic threshold to assure all patients reached a submaximal exercise level during the test.
Temporal concentrations of inspired and expired ga-ses at each respiratory cycle were measured with a rapid gas analyzer (Airspec MGA 2000 respiratory mass spectro-meter) from the sample suctioned continuously next to the mouthpiece used by the patient. The respiratory mass spec-trometer was calibrated by linear adjustment with 2 known gas mixtures.
Flow measurement was performed with a Fleisch number 3 pneumotachograph warmed to 36°C coupled with a transducer of differential pressure (Micro-Switch – 163PC01D36). Equipment calibration (respiratory mass spectrometer, pneumotachograph, and cycloergometer) was performed on a daily basis before each test. An IBM-PC 486 microcomputer was used for experiment acquisition, analysis, and recording.
Signals of gas flow and concentration were sampled at a rate of 60 Hz by the analogical-digital converter of the res-piratory mass spectrometer. The VIT 2000 software emplo-yed for processing the signals and calculating the cardio-pulmonary exercise test parameters was developed and tested in the laboratory of pulmonary engineering of the Biomedical Engineering Program of COPPE-UFRJ 12. The
flow signal was calculated with a third-order polynomial ad-justment 13, and the gas sample suctioned during the
analy-sis of gas concentrations was compensated by the respira-tory mass spectrometer (1 mL.s-1). V
IC and VEC were
calcu-lated through trapezoidal numerical integration and expres-sed in BTPS (37°C, 760mmHg, and saturated with water va-por) for each respiratory cycle. Instantaneous gas viscosity was calculated and employed to correct its effect in gas flows and volumes 13, and to estimate the time delay
be-tween gas flow and concentrations 14 necessary for
calcula-ting the partial respiratory gas volumes. These were expres-sed in STPD (0°C, 760mmHg, dry) and obtained by nume-rical integration of the product of the gas flow and fractions, and these signals were previously synchronized. As these measurements were taken at the mouth, the estimation of al-veolar gas exchanges was performed compensating the va-riations in the functional residual capacity through measu-rements of the nitrogen gas 15. The V
O2 and VCO2 were
calcu-lated through the product of the volumes at each cycle and the instant respiratory frequency, and expressed in STPD.
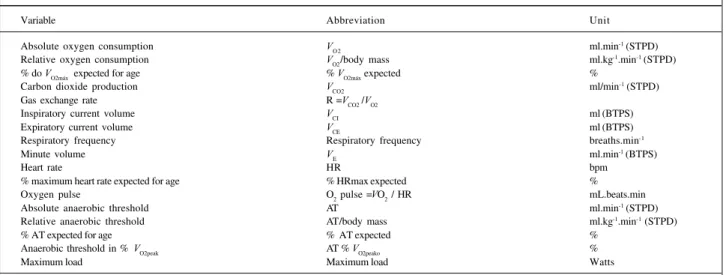
Diagram II shows the variables analyzed (9 at rest and 17 during exercise). The values computed for the variables at rest correspond to the mean of the last 30 seconds of the period, which has a total length of 4 minutes, when the respi-ratory signals are already stabilized.
The response to exercise of patients with heart di-sease is usually deficient because of limitations in the O2 transport system inherent to these patients, leading to an early commencement of fatigue and interruption of the test. Therefore, to reach VO2max, which is defined as the saturati-on of the capacity of O2 uptake and transport for the mus-cles during exercise, is difficult and involves some risks in some cases. Therefore, in our study we adopted VO2peak (mean of the last 30 seconds of the last load of the exercise) as an index of response to exercise of patients with Chagas’ heart disease.
The anaerobic threshold (AT) was expressed in regard to VO2 in mL.min-1 (STPD) and was identified by 2
ventilato-ry methods and denominated anaerobic threshold in all stages of the study: AT1 – value of VO2 in which the
respira-Diagram II - Description of the controlled variables
Variable Abbreviation Unit
Absolute oxygen consumption V
O 2 ml.min
-1 (STPD)
Relative oxygen consumption VO2/body mass ml.kg-1.min-1 (STPD)
% do V
O2máx expected for age % VO2máx expected %
Carbon dioxide production VCO2 ml/min-1 (STPD)
Gas exchange rate R =V
CO2 /VO2
Inspiratory current volume VCI ml (BTPS)
Expiratory current volume V
CE ml (BTPS)
Respiratory frequency Respiratory frequency breaths.min-1
Minute volume V
E ml.min
-1 (BTPS)
Heart rate HR bpm
% maximum heart rate expected for age % HRmax expected %
Oxygen pulse O2 pulse =VO2 / HR mL.beats.min
Absolute anaerobic threshold AT ml.min-1 (STPD)
Relative anaerobic threshold AT/body mass ml.kg-1.min-1 (STPD)
% AT expected for age % AT expected %
Anaerobic threshold in % VO2peak AT % VO2peako %
Maximum load Maximum load Watts
The word “peak” refers to the greatest value reached at the end of exercise and “rest” refers to rest values. V
O2max expected for age = (-0.38
tory exchange rate (R=VCO2/VO2) is equal to or higher than 1.0 and continues to increase in subsequent respiratory cycles 16,17,18; and AT2 – the point in which the ventilatory
equivalent of O2 (VE/VO2) increases without a concomitant increase in the ventilatory equivalent of CO2 (VE/VCO2) 11. In
the first method (AT1), we were able to identify the anaero-bic threshold for all patients, but in the second method, be-cause of very noisy signals, we could only identify the anae-robic threshold for 30 patients. We compared the two results (AT1 and AT2) by the paired Student t test, which did not show a significant difference between the two measures for the 5% significance level (p=0.29). Therefore, for statistical purpose, we adopted AT1.
The statistical treatment was performed with the Sta-tistical Analysis System (SAS). We used the one-way ANOVA analysis of variance and the Dunnet (N x patients) and Tukey (patient x patient) tests of multiple comparisons to specify which groups differed from each other. The sta-tistical significance level adopted in these analyses was 5% (p≤0.05).
Results
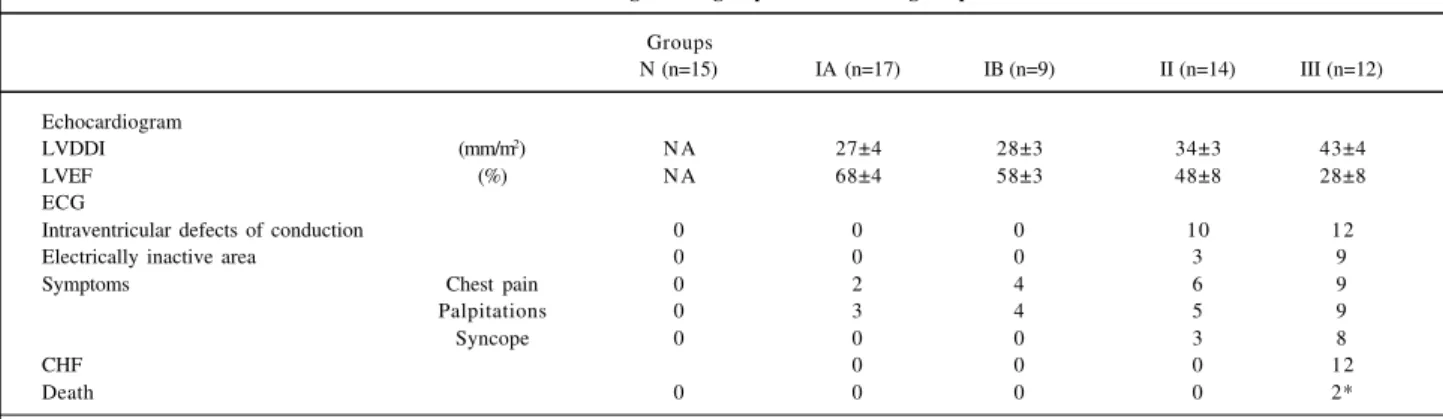
Tables I and II show the clinical and laboratory fin-dings of the groups studied.
In regard to the physical characteristics of the sample, individuals in group N had ages significantly (p=0.0001) lower than those in groups IA, II, and III, and their heights were significantly (p=0.04) higher than those of the indivi-duals in group IB.
During the resting period, significant differences between group N and those of patients in regard to the va-riables VICrest and VECrest and the respiratory frequency were observed. We also observed that VECrest and VICrest were higher in the individuals in group N than in the patients in other groups. The mean respiratory frequency was higher in group III (Table III).
The ages and heights of the patients with Chagas’
heart disease studied did not differ. The body mass (body weight) of patients in groups IA and II, however, showed significant differences (p=0.02) (Table III).
During exercise, when group N was compared with the groups of patients, those groups with more advanced di-sease (groups II and III) showed significant differences. For the maximum load variable only, a significant difference (p=0.004) was observed between the groups N and IA. Group N was different from IB only in regard to the variables VICpeak (p=0.001) and AT% VO2peak (p=0.05) (Table IV).
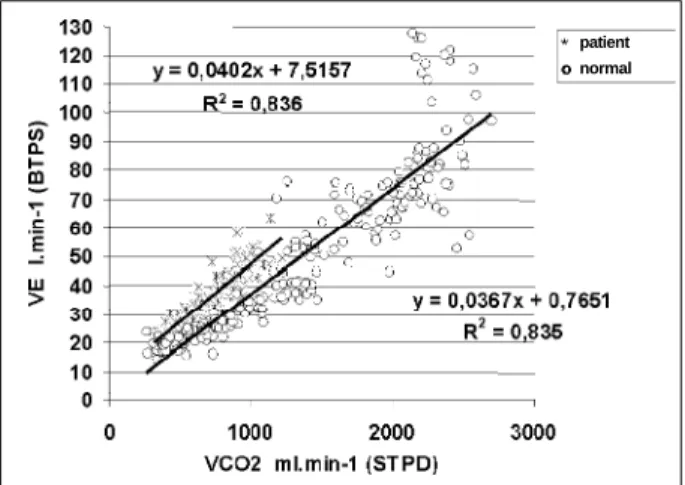
Figure 2 depicts the relationship VE V3 Vco2 in a volun-teer from group N and a patient from group III showing the greater ventilatory work for given level of Co2 production in comparison to the assymptomatic volunteer.
Heart rate at the end of exercise showed mean values in the groups that had decreases in those variables referenced above according to the increase in the degree of cardiac in-volvement (Table IV). The ANOVA analysis of variance, however, showed no significant difference between the me-an heart rate when comparing the four groups of patients. No significant difference was found between the groups of patients for the variables Rpeak, respiratory frequency, and
VEpeak (Table IV).
Discussion
In regard to Chagas’ heart disease in its chronic form, it is known that the intracellular lesions seen on endomyo-cardial biopsies are more marked in group IB than in group IA, where the lesions detected are minimum. Carrasco et al 19
reported a high incidence (60%) of microscopic changes in group IA, and the alterations in the contractile system in group IB were more prominent than those in group IA. Group II showed fibrosis and an inflammatory process, whi-ch were even more marked in group III. Despite the morpho-logical findings reported in the study by Carrasco et al 19,
our study did not detect corresponding significant differen-ces between the functional results of groups IA and IB
Table I - Clinical findings in the groups of chronic chagasic patients
Groups
N (n=15) IA (n=17) IB (n=9) II (n=14) III (n=12)
Echocardiogram
LVDDI (mm/m2) N A 27±4 28±3 34±3 43±4
LVEF (%) N A 68±4 58±3 48±8 28±8
ECG
Intraventricular defects of conduction 0 0 0 10 12
Electrically inactive area 0 0 0 3 9
Symptoms Chest pain 0 2 4 6 9
Palpitations 0 3 4 5 9
Syncope 0 0 0 3 8
CHF 0 0 0 12
Death 0 0 0 0 2*
(patients in the initial phase of the disease). Likewise, diffe-rences between groups IA and IB and group II were not evident, because only in 2 of the 17 variables studied was a significant difference observed between these groups. Considering these results, one may assume that if the tissu-lar changes reported in the studies analyzing biopsy materi-al are present in a sample studied, they are not enough to de-termine significant changes in the functional capacity of patients with the initial phase of chronic Chagas’ heart di-sease. In other words, clinical and laboratory findings of Chagas’ disease depend on a critical mass of heart involve-ment. Another explanation for the results obtained could be that the dysautonomia observed in Chagas’ heart disease is limited to the efferent control of the heart and, therefore, does not affect regulation of the vascular component, i. e., the regulatory disorder caused by dysautonomia impairs mechanisms of fine adjustment of the cardiovascular per-formance 20.
Our study did not detect any significant difference in regard to the results at the end of exercise (Table IV) bet-ween groups N and IA and groups N and IB. Therefore, we assume that these patients in the initial phase of the disease still do not have a significant decrease in the maximum
functional capacity as compared with healthy individuals. This result is in accordance with preceding studies 21,22 that
also did not show a significant difference between healthy individuals and patients in the undetermined form of Cha-gas’ disease (group IA of the Los Andes classification) for variables during exercise. However, it does not agree with another study 23. This discrepancy may reflect a greater
intolerance to exercise in patients of one sample as com-pared with those of another sample, and even may result from factors relating to different methodologies or equip-ment used that may interfere with the sampling.
The values of VO2peak (p=0.003) and VCO2peak (p=0.002) were significantly lower in groups II and III than in group N, a fact that reflects the lower functional capacity of these pa-tients as compared with the healthy individuals studied. This results from the inflammatory processes, degeneration, and continuous and progressive destruction of cardiac fibers, areas of fibrosis causing a reduction in the contrac-tion power of the heart and cardiomegaly, degeneracontrac-tion of the intramural ganglia, and lesions of the cardiac nerves causing damage to the autonomic nervous system that are present in the more advanced stages of chronic Chagas’ heart disease (groups II and III) 24,25. The cardiac
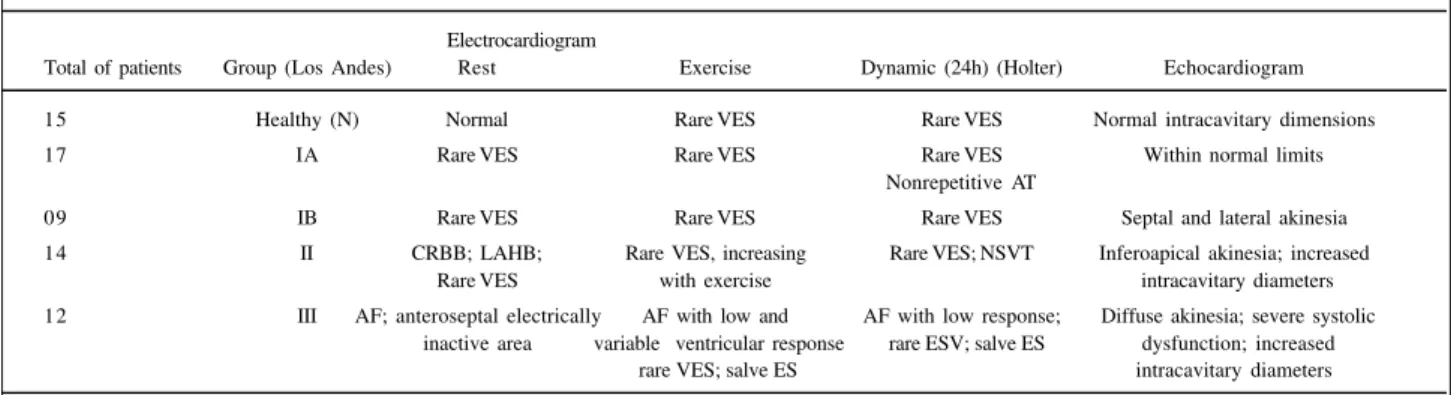
Table II – Most common laboratory findings in the groups of chronic chagasic patients
Electrocardiogram
Total of patients Group (Los Andes) Rest Exercise Dynamic (24h) (Holter) Echocardiogram
15 Healthy (N) Normal Rare VES Rare VES Normal intracavitary dimensions
17 IA Rare VES Rare VES Rare VES Within normal limits
Nonrepetitive AT
09 IB Rare VES Rare VES Rare VES Septal and lateral akinesia
14 II CRBB; LAHB; Rare VES, increasing Rare VES; NSVT Inferoapical akinesia; increased
Rare VES with exercise intracavitary diameters
12 III AF; anteroseptal electrically AF with low and AF with low response; Diffuse akinesia; severe systolic inactive area variable ventricular response rare ESV; salve ES dysfunction; increased
rare VES; salve ES intracavitary diameters
AF - atrial fibrillation; AT- atrial tachycardia; LAHB - left anterior hemiblock; CRBB – complete right branch block; NSVT – nonsustained ventricular tachycardia; VES- ventricular extrasystole; ES- extrasystole. The laboratory tests were performed at the Chagas’ Heart Disease Service of HUCFF.
Table III – Comparison of the resting measurements
Variables Units Healthy IA IB II III
(n=15) (n= 17) (n= 9) (n= 14) (n= 12)
Age Years 36 a. c. d ± 9 47 ± 11 46 ± 12 52 ± 10 55 ± 9
Body mass k g 71 ± 8 77c ± 9 67 ± 14 65 ± 12 68 ± 13
Height cm 172 b ± 7 169 ± 6 165 ± 6 165 ± 7 168 ± 6
VO2rest ml .min-1 (STPD) 296 ± 119 323 ± 78 282 ± 53 266 ± 90 361 ± 133 VO2rest/ body mass ml .kg1.min-1 (STPD) 4.27 ± 1.88 4.24 ± 1.24 4.28 ± 0.68 4.08 ± 1.06 5.30 ± 1.61 VCO2rest ml .min-1 (STPD) 263 ± 125 267 ± 65 222 ± 43 220 ± 69 297 ± 115 Rrest VCO2/VO2 0.87 ± 0.15 0.86 ± 0.13 0.79 ± 0.08 0.83 ± 0.10 0.82 ± 0.10
V
CIrest ml (BTPS) 1058
b. c. d ± 360 915 ± 293 749 ± 68 780 ± 161 798 ± 262
VICrest ml (BTPS) 1105 c ± 356 969 ± 358 804 ± 91 816 ± 143 835 ± 330 Respiratory frequency breths.min-1 16 d ± 8 17 d ± 5 18 ± 2 18 ± 5 22 ± 5 VErest l .min-1 (BTPS) 15 ± 5.0 16 ± 5 14 ± 2 14 ± 2 18 ± 5
HRrest bpm 77 ± 11 83 ± 14 73 ± 10 72 ± 9 77 ± 26
tive process observed in chronic Chagas’ heart disease limits the patient’s capacity to adjust his or her cardiac output to the necessity of O2 supply to the muscles, which are enlarged during exertion, altering tolerance to exercise. This tolerance seems to be primarily determined by the reser-ve of cardiac output 26. With a decreased capacity of O
2
supply to the muscles during exercise, the patients interrupt the exercise at lower levels of O2 consumption than healthy individuals do. This fact was evident in the results of the va-riable maximum load (p=0.004) reached during exercise, in which the values of group N were significantly higher than those of all the other groups (Table IV). It is worth noting that the load reached by the patients in more advanced stages of the disease (group III) was also significantly lower (p=0.001) than that of the patients in the initial phase of the disease (IA and IB). As the healthy group had a mean age lower than those of the patients, and considering that O2 uptake decreases as age increases, the difference between group N and the groups of patients may be partially justified by the variation in age observed in these groups. Conside-ring only the groups of patients, differences in results were not influenced by age, because no significant difference was observed among these groups in regard to age.
Our study evidenced a marked difference between the most expressive variables obtained in the cardiopulmonary exercise test of the groups of patients classified in the extremes of the Los Andes classification (IA and III) (Table IV). This fact stresses the decrease in functional capacity of patients as disease progresses (fig. 1).
Normality index of VO2peak and prognosis of chronic Chagas’ heart disease – This concept, which established that a VO2peak above 20ml.kg.min-1 would represent a
norma-lity index for functional capacity in patients with heart di-sease 27 had its application to chronic Chagas’ heart disease
challenged 28. This occurred because the authors observed
that 37% of the patients with chronic Chagas’ heart disease,
and heart failure (group III of the Los Andes classification) reached VO2peak above this value. Confirming this study, we observed that 50% of the group III patients also reached values of VO2peak higher than 20ml.kg.min-1. We also
obser-ved that VO2peak of all the four groups of patients reached values that, according to Mady et al 29, have a good survival
rate. Only the group of patients with the greatest heart im-pairment and congestive heart failure (group III) obtained a mean VO2peak below 20ml.kg.min-1 (Table IV). Only one
pa-tient (group III) out of the 52 studied obtained aVO2peak lower than 10ml.kg.min-1, 34% of the patients reached results
between 10 and 20ml.kg.min-1, and 52% reached results
above 20ml.kg.min-1. Therefore, we believe a greater number
of studies about the variation of the functional capacity in patients with chronic Chagas’ heart disease is necessary to obtain standards regarding these patients, because peculiarities of the disease seem to cause a response to exercise different from that of other heart diseases.
We also observed that group III patients had the lo-west results for the variable %VO2peak foretold for age and
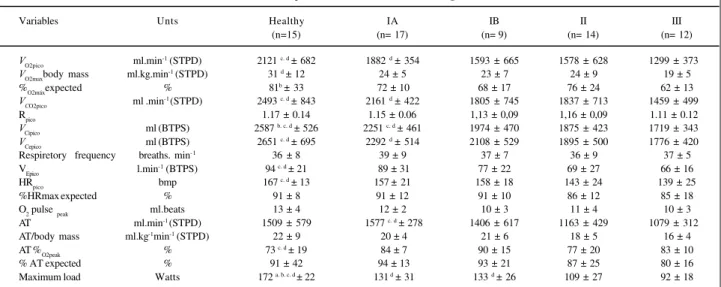
Table IV - Comparison of the measurements during exercise
Variables Unts Healthy IA IB II III
(n=15) (n= 17) (n= 9) (n= 14) (n= 12)
VO2pico ml.min-1 (STPD) 2121 c. d ± 682 1882 d ± 354 1593 ± 665 1578 ± 628 1299 ± 373
VO2maxbody mass ml.kg.min-1 (STPD) 31 d ± 12 24 ± 5 23 ± 7 24 ± 9 19 ± 5 %O2máxexpected % 81b ± 33 72 ± 10 68 ± 17 76 ± 24 62 ± 13
VCO2pico ml .min-1 (STPD) 2493 c. d ± 843 2161 d ± 422 1805 ± 745 1837 ± 713 1459 ± 499
Rpico 1.17 ± 0.14 1.15 ± 0.06 1,13 ± 0,09 1,16 ± 0,09 1.11 ± 0.12
VCipico ml (BTPS) 2587 b. c. d ± 526 2251 c. d ± 461 1974 ± 470 1875 ± 423 1719 ± 343
VCepico ml (BTPS) 2651 c. d ± 695 2292 d ± 514 2108 ± 529 1895 ± 500 1776 ± 420 Respiretory frequency breaths. min-1 36 ± 8 39 ± 9 37 ± 7 36 ± 9 37 ± 5 VEpico l.min-1 (BTPS) 94 c. d ± 21 89 ± 31 77 ± 22 69 ± 27 66 ± 16 HRpico bmp 167 c. d ± 13 157± 21 158 ± 18 143 ± 24 139 ± 25
%HRmax expected % 91 ± 8 91 ± 12 91 ± 10 86 ± 12 85 ± 18
O2 pulse peak ml.beats 13 ± 4 12 ± 2 10 ± 3 11 ± 4 10 ± 3
AT ml.min-1 (STPD) 1509 ± 579 1577 c. d ± 278 1406 ± 617 1163 ± 429 1079 ± 312 AT/body mass ml.kg-1min-1 (STPD) 22 ± 9 20 ± 4 21 ± 6 18 ± 5 16 ± 4 AT %O2peak % 73 c. d ± 19 84 ± 7 90 ± 15 77 ± 20 83 ± 10
% AT expected % 91 ± 42 94 ± 13 93 ± 21 87 ± 25 80 ± 16
Maximum load Watts 172 a. b. c. d ± 22 131 d ± 31 133 d ± 26 109 ± 27 92 ± 18
Symbols as in diagram II; n- total of participants; significance level adopted p≤0.05; a- significantly different from group IA; b- significantly different from group IB; c- significantly different from group II; d- significantly different from group III.
VICpeak (ml BTPS) VECpeak (ml BTPS) VCO 2peak (ml.min-1STPD) VO 2peak (ml.min-1STPD) AT (ml.min-1STPD)
GROUPS Fig. 1 -Variables measured during exercise in the groups studied. definitions in diagram I
obtained through the equation of Itoh et al 16, expressing
the early interruption of the exercise due to limitations impo-sed by the disease.
VO2peak and body mass – Comparing only the groups of patients, we observed that even though group IA had a sig-nificantly higher body mass than group II, no significant dif-ference was obtained in regard to analysis of O2 consumption per unit of body mass between these two groups of patients (Table IV), leading to the assumption that this difference did not interfere with the analysis. Only group N had a significant difference in regard to group III for the variable O2 consump-tion per unit of body mass (Table IV). This points out to a better capacity of O2 absorption per unit of body mass in healthy individuals as compared with that of patients in more advanced stages of chronic Chagas’ heart disease.
VECpeak, VICpeak, respiratory frequency, and VEpeak – Patients with heart disease often have ventilatory abnorma-lities that include structural changes, because of the in-crease in venous pressure, and functional changes 25,27,30.
Intolerance to exercise in patients with heart disease may occur due to the presence of dyspnea, which is related to ta-chypnea and to variations in VE 27 due to pulmonary
chan-ges. In the present study, we observed that during exercise the respiratory frequency increased in all groups reaching maximum mean values between 36 and 39 breaths.min-1, but
no significant difference was observed between the groups. On the other hand, group N showed the highest mean values of VECpeak and VICpeak and the lowest values were seen in group III. VICpeak values of patients in groups IB, II, and III were significantly decreased as compared with those of group N. Consequently, VEpeak, which is the product between respiratory frequency and VECpeak, was significan-tly lower in group II and III patients when compared with that of group N. When comparing the groups of patients, we observed that the decrease in VECpeak and VICpeak is evi-dent in groups of patients with more advanced stages of the disease (II and III). This incapacity of the patients in mo-bilizing a greater current volume during exercise may reflect the presence of ventilatory changes in patients with severe
and advanced cardiac impairment. In patients with cardiac diseases and pulmonary congestion, the respiratory pattern may be altered by interstitial congestion, with an increased respiratory frequency and decreased current volume for a given ventilatory level, as compared with healthy indivi-duals 27. Studies of patients with heart diseases other than
Cha-gas’ heart disease showed that, for the same level of VCO2, these patients had an increased VE in relation to healthy indi-viduals. Change in the anatomical and physiologic dead spaces, which is usually present in patients with heart di-sease, requires a greater respiratory effort to ventilate these patients as compared with healthy individuals 27,30.
Accor-ding to Weber et al 27, this fact may be observed by the
ana-lysis of the relation between VE and VCO2 during exercise. Fi-gure 2 depicts this change in the sample analyzed with the curves of VE in relation to VCO2 of a group N volunteer and a group III patient. Notice that VE increases linearly with VCO2
in both cases, indicating that the arterial pressure of CO2 is stable, but for the same level of VCO2, we observe more ele-vated values of E for the patient in group III. This fact cha-racterizes the ventilatory limitation of the group III patient as compared with the healthy individual.
Heart rate – In regard to heart rate during exercise (HRpeak), the significant difference results from the compara-tive analysis between group N and groups II and III, pictu-ring an expected response. An inadequate elevation in heart rate during physical exertion is considered a characteristic of patients in advanced chronic Chagas’ heart disease. It results from an autonomic dysfunction occurring due to greater parasympathetic depression as compared with the sympathetic depression, which is characteristic of the di-sease and aggravated by the ventricular dysfunction resul-ting from chronic Chagas’ heart disease 22,25,31.
Even though no significant difference was obtained for the HRpeak variable when the four groups of patients were compared, we observed that the p value (0.08) was close to the significance level adopted in the analysis (p≤0.05). The mean HRpeak in group IA was 18 bpm higher than that in group III. The interpretation of this result considering the approaches found in the literature in regard to the autono-mic abnormalities in chronic Chagas’ heart disease 31 leads
to the assumption that the sample studied has a mild reduc-tion in the chronotropic response, which is a characteristic of chronic Chagas’ heart disease 31,32. This alteration makes
it impossible for the patients, mainly those in advanced sta-ges of the disease, to widen their tolerance to exercise by improving the chronotropic competence, i. e., the capacity of the sinus node to increase heart rate in response to meta-bolic necessities that increase during exercise is limited. Therefore, adjustment of the cardiac output to exercise needs, which is performed through an increase in systolic volume and in greater loads mainly by increasing heart rate, is limited in chronic Chagas’ heart disease, leading to an early interruption of the exercise. The lowest values reached by groups II and III for the variable %HRmax expected for age (Table IV) are more evidence of the limited chronotropic response of these patients.
Fig. 2 - Relation between V
E e VCO2 of a healthy individual and a group III patient during exercise. Note that for same level of V
CO2 the patient has a higher V
E .
O2 pulse – In healthy individuals O2 pulse, which reflects systolic volume and O2 arteriovenous difference 11,
has higher values during exercise than it does in patients with diseases causing a reduction in systolic volume. The greatest values are found in athletes because they reach a higher O2 consumption with a lower heart rate at a given load of exercise. Even though O2 pulse did not show a significant difference between the groups in the present study, its highest values were found in group N, and they decreased as the degree of cardiac impairment increased. This is in accordance with the characteristics of the groups studied.
Anaerobic threshold - The inadequate O2 supply during exercise causes an early imbalance between lactate production and removal, leading to metabolic acidosis and, consequently, a pH imbalance. Studies 33 have shown that
cellular acidosis interferes with muscle contractions and re-lates to fatigue and, thus, is involved with patient’s tole-rance to exercise.
The results of the present study show a decrease in the mean values of the anaerobic threshold of the groups as the degree of cardiac involvement increases in patients (fig. 1). The absence of a significant difference between the mean values of the anaerobic threshold in groups IA and IB indicates that the patients of the sample have ventilatory signals of metabolic acidosis in similar levels of O2 con-sumption. Even though the left ventricular echocardio-graphic changes and ejection fraction (which is slightly decreased in group IB as compared with group IA) point out the presence of incipient cardiac impairment, they were not enough to cause significant changes in the anaerobic threshold of patients in group IB as compared with those in group IA. On the other hand, the significant differences in the anaerobic threshold between the mean values in group IA (with no electrocardiographic and echocardiographic changes) and groups II (echocardiographic and electrocar-diographic changes) and III (echocarelectrocar-diographic and elec-trocardiographic changes with congestive heart failure) (Table IV) indicate that in these groups cardiac changes resulting from progression of the chronic chagasic heart disease significantly altered the anaerobic threshold of the patients studied.
Analysis of the anaerobic threshold reached by the patients studied as compared with that expected for their ages allowed the conclusion that groups in the initial phase of chagasic heart disease (IA and IB) were closer to the values estimated for their ages than the groups in more advanced
stages of the disease (Table IV). A progressive reduction in the anaerobic threshold with progression of the disease according to the Los Andes classification was observed.
Anaerobic threshold and body mass – Analysis of the anaerobic threshold in regard to patients’ body mass did not show any significant difference between the groups with chronic chagasic heart disease for the 5% level of significance. However, as shown in table IV, this level was almost achieved (p=0.06). It is worth emphasizing that as re-commended for O2/body mass in a more careful analysis the patient’s lean body mass should be considered and not the total body mass, which includes the fatty tissue. This varia-ble, likewise with the others, decreases as the patient’s de-gree of cardiac impairment increases. The result of the pre-sent study for the anaerobic threshold/body mass is in ac-cordance with a previous study 34 in which a significant
dif-ference in the anaerobic threshold/body mass was found between the extreme groups of the Los Andes classification. In conclusion, we observed that the analysis of gas ex-changes in patients at rest did not provide information that all-owed an identification of responses changed due to chronic chagasic heart disease. Therefore, this technique provides no relevant information or advantage to those already used in medical practice for assessing these patients at rest.
In regard to the response to exercise, we observed that VO2peak, VCO2peak, VECpeak, VICpeak, anaerobic threshold, and ma-ximum load are the variables that best expressed the de-crease in functional capacity due to the evolution of chro-nic Chagas’ heart disease because the results are significan-tly altered in the groups with more advanced stages of the disease (according to the Los Andes classification). These changes progress with worsening of the disease. As these variables represent the interaction of the entire system of O2 transport and use, we may infer that the results found reflect a progressive decrease in the functional capacity of chronic Chagas’ heart disease, rendering therefore the evolution in the degree of cardiac impairment provided by the Los Andes clinical/hemodynamic classification.
Acknowledgment
1. Mady C, Cardoso RHA, Barretto ACP, Luz PL, Bellotti G, Pilleggi F. Survival and predictors of survival in patients with congestive heart failure due to Cha-gas‘ cardiomyopathy. Circulation, December; 1994, 90: 3098-102. 2. Faria CA. Ergometria na avaliação clínica da doença de Chagas crônica. In:
Car-diopatia Chagásica. Belo Horizonte: Editora da Fundação Carlos Chagas de Pes-quisa Médica, 1985: 223-65.
3. Bestetti RB. Heart transplantation as a treatment for patients whit end-stage Cha-gas’Heart Disease. Circulation 1997; 96: 2744-5.
4. Sullivan MJ, Hawthorne MH. Exercise intolerance in patients with chronic heart failure. Prog Cardiov Dis 1995; V XXXVIII: 1-22.
5. Carrasco HA. Diagnóstico de dano miocardico en la enfermedad de Chagas. Textos de la Universidad de los Andes. Merida: Consejo de Publicationes de la Universidad de Los Andes, 1983.
6. Medina M, Carrasco HA, Fuenmayor A, Medina A, Garcia MR. Diagnóstico por métodos no invasivos de dano ventricular izquerdo incipiente en pacientes cha-gásicos – utilidad de la ecocardiografia y la fonomecanografia. Archiv Inst Cardiol Méx 1980; 50: 663-9.
7. Maguirre JH, Mott KE, Souza JAA, Almeida EC, Ramos NB, Guimarães AC. Ele-trocardiographic classification and abbreviated lead system for population ba-sed studies of Chagas disease. Bull Pan Am Health Org 1982; 16: 47-58. 8. Xie GE, Berk MR, Smith MD, Gurley JC, De Maria AN. Prognostic value of
dop-pler transmitral flow patterns in patients with congestive heart failure. J Am Coll Cardiol 1994; 24: 132-9.
9. Teicholz LE, Kreulen T. Problems in echo-cardiographic volume determinations: echo-cardiographic-angiographic correlation in the present or absence of a synergy. Am J Cardiol 1976; 37: 7-11.
10. McKee PA, Castelli WP, McNamara PM, Kannel WB. The natural history of con-gestive heart failure. N Engl J Med 1971; 285: 1441-6.
11. Wasserman K, Hansen J, Sue DY, Whipp BJ. Principles of Exercise Testing and In-terpretation. Philadelphia: Lea & Febiger, 1987.
12. Abrantes ACS. Sistema computadorizado para monitoração cardiorrespiratória. Dissertação de Mestrado, COPPE/UFRJ. Rio de Janeiro, 1997.
13. Giannella-Neto A, Bellido C, Barbosa RB, Melo MFV. Design and calibration of unicapillary pneumotachographs. J Appl Phys 1998; 84: 335-43.
14. Noguchi H, Ogushi Y, Yoshiyia I, Itakura N, Yamabayashi H. Breaht-by-breath
CO2 and O2 require compensation for transport delay and dynamic response J Appl Phys 1982; 52: 79-84.
15. Wessel HU. Breath-by-breath variation of FRC: effect on
O2 and CO2 measured at the mouth. Am Phys Soc 1979; 46: 1122-6.
16. Itoh H, Taniguchi K, Koike A, Doi M. Evaluation of severity of heart failure using ventilatory gas analysis. Circulation 1990; 81(supp l II): II-31 - II-7. 17. Dickstein K, Barvik S, Aarsland T, Snapinn S, Karlsson J. A comparison of
metho-dologies in detection of the anaerobic threshold. Circulation 1990; 81: II-38-II-46. 18. Dickstein K, Barvik S, Arsland T, Svannes H, Barvik S. “A respiratory exchange ratio equal to 1 provides a reproducible index of sub-maximal cardiopulmonary exercise performance”. Am J Cardiol 1993; 71: 1367-9.
References
19. Carrasco HA, Palácius-Prüe, Scorza CD, Molina C, Inglessis GV, Mendoza RVB. Clinical, histochemical, and ultrastructural correlation in septal endomyocar-dial biopsies from chronic patients: Detection of early myocarendomyocar-dial damage. Am Heart J 1987; 113: 716-24.
20. Marin-Neto JA. Alteraciones neurovegetativas cardiovasculares en la enferme-dad de Chagas. Rer Fed Arg Cardiol 1988; 17: 177-89.
21. Mady C, Yazbek Jr P, Barretto ACP, et al. Estudo da capacidade funcional máxima pela ergoespirometria em pacientes portadores de doença de Chagas. Arq Bras Cardiol 1986; 47: 201-05.
22. Gallo Jr L, Morelo-Filho J, Maciel BC, Marim-Neto JA, Martins LB, Lima-Filho EC. Functional evaluation of sympathetic and parasympathetic system in Cha-gas‘ disease using dynamic exercise. Cardiov Res 1987; 21: 922-7. 23. Mady C, Ianni BM, Arteaga E, et al. Capacidade funcional máxima e função
diastó-lica em portadores de cardiomiopatia chagásica sem insuficiência cardíaca con-gestiva. Arq Bras Cardiol 1997; 69: 237-41.
24. Andrade ZA. Bases morfológicas das arritmias na miocardite chagásica In: Car-diopatia Chagásica. Belo Horizonte: Editora da Fundação Carlos Chagas de Pes-quisa Médica, 1985: 79-90.
25. Manço JC, Gallo Jr L, Marin-Neto JA, Terra Filho J, Maciel BC, Amorim BDS. Al-terações funcionais do sistema nervoso autônomo. In: Cardiopatia Chagásica. Belo Horizonte: Editora da Fundação Carlos Chagas de Pesquisa Médica, 1985: 91-98.
26. Higginbotham MB. Systolic failure. In: Exercise and Heart Failure. Future Publi-shing: Armok, NY, 1997: 31-8.
27. Weber KT, Kinasewitz GT, Janicki JS, Fishman AP. Oxygen utilization and ven-tilation during exercise in patients with chronic cardiac failure. Circulation 1982; 65: 1213-23.
28. Mady C, Cardoso RHA, Ianni BM, et al. Capacidade funcional máxima “normal” em pacientes com insuficiência cardíaca congestiva por miocardiopatia chagási-ca. Arq Bras Cardiol 1996; 67: 1-4.
29. Mady C, Cardoso RHA, Barreto ACP, Luz PL, Bellotti G, Pilleggi F. Survival and predictors of survival in patients with congestive heart failure due to Cha-gas‘ cardiomyopathy. Circulation 1994; 90: 3098-102.
30. Fink LI, Wilson JR, Ferraro N. Exercise ventilation and artery wedge pressure in chronic heart failure. Am J Cardiol 1986; 57: 249-53.
31. Gallo Jr L, Marim-Neto JA, Manço JC, Rassi A, Amorim DS. Abnormal heart rate responses during exercise in patients with Chagas’ disease. Cardiology 1975; 60: 147-62.
32. Guzzetti S, Pecis M, Bonura L, Prosdocimi M, Malliani A. Impaired heart rate variability in patients with chronic Chagas’ disease. Am Heart J 1992; 124: 1665-6.
33. Wasserman K. Determinant and detection of anaerobic threshold and conse-quences of exercise above it. Circulation 1987; 76(suppl VI): VI-29 - VI-39. 34. Pedrosa RC, Melo MFV, Saad EA. Limiar anaeróbio detectado pela análise da