ABSTRACT
Purpose: To evaluate the changes in several ocular parameters, including choroidal thickness, during and after hemodialysis.
Methods: Twenty-seven eyes of 27 patients with chronic renal failure undergoing hemodialysis were included. The patients underwent an ophthalmic examination, including intraocular pressure, central corneal thickness, iridocorneal angle, subfoveal choroidal thickness, and blood pressure, just before a hemodialysis session, during the second hour of the session, and half an hour after the end of the session. Body weight was measured before and after the session, and ultrafiltration volume was noted after the session. Central corneal thickness, intraocular pressure, and subfoveal choroidal thickness were measured by optical coherence tomography.
Results: In comparison with baseline levels, mean intraocular pressure and
central corneal thickness increased significantly during the second hour of hemodialysis (p=0.001 and p=0.011, respectively) and showed no significant changes after hemodialysis (p=0.844 and p=0.246, respectively). Mean iridocor-neal angle did not significantly change during the second hour of hemodialysis (p=0.101) and after hemodialysis (p=0.589). Mean subfoveal choroidal thickness was significantly lower during the second hour of hemodialysis (p<0.001) and after hemodialysis (p<0.001).
Conclusions: Mean intraocular pressure and central corneal thickness increased and subfoveal choroidal thickness decreased during the second half of the he-modialysis session. During the second half of the session, intraocular pressure and central corneal thickness had a trend toward reduction, while subfoveal choroidal thickness had a relatively steady course. Because of possible fluctuations in the values, it would be reasonable to evaluate the changes not only from before to after hemodialysis but also during hemodialysis when analyzing the ocular effects of dialysis.
Keywords: Cornea; Choroid; Intraocular pressure; Iris; Renal dialysis
RESUMO
Objetivo: Avaliar as alterações em vários parâmetros oculares, incluindo a espes-sura da coroide, durante e após a hemodiálise.
Métodos: Foram incluídos 27 olhos de 27 pacientes portadores de insuficiência renal crônica e submetidos a hemodiálise. Todos foram submetidos ao exame oftalmoló-gico, incluindo pressão intraocular, medida da espessura corneana central, ângulo iridocorneal e espessura da coroide subfoveal, além da medida da pressão arterial. A espessura corneana central, o ângulo iridocorneal e a espessura da coroide subfo-veal foram medidos através da tomografia de coerência óptica. Os exames foram realizados logo antes, durante (na segunda hora) e meia hora após uma única sessão de hemodiálise. O peso corporal foi medido antes e depois da sessão, e os volumes de ultra filtração foram anotados após a sessão de hemodiálise.
Resultados: Em comparação com os níveis basais, a pressão intraocular média e a espessura corneana central aumentaram significativamente na segunda hora de hemodiálise (p=0,001 e p=0,011, respectivamente), mas não houve diferença após a
hemodiálise (p=0,844 para pressão intraocular e p=0,246 para espessura corneana
central). O ângulo iridocorneal mostrou ligeira diminuição na segunda hora de he-modiálise (p=0,101) e após a sessão de hemodiálise (p=0,589), porém esta redução não foi estatisticamente significativa. Já a espessura da coroide subfoveal mostrou uma redução significativa tanto na segunda hora de hemodiálise (p<0,001) quanto após a sessão de hemodiálise (p<0,001).
Conclusões: A pressão intraocular e a espessura corneana central aumentaram, enquanto a espessura da coroide subfoveal diminuiu na primeira metade da sessão de hemodiálise. Na segunda metade da sessão, a pressão intraocular e a espessura corneana central mostraram uma tendência de redução, enquanto a espessura da coroide subfoveal permaneceu estável. Ao analisar os efeitos oculares da hemodiálise, seria interessante avaliar as mudanças não só antes e depois da sessão, como também durante a hemodiálise, devido a possíveis flutuações dos valores.
Descritores: Córnea; Coroide; Pressão intraocular; Iris; Diálise renal
Are the effects of hemodialysis on ocular parameters similar during and after a
hemodialysis session?
Os efeitos da hemodiálise sobre os parâmetros oculares são semelhantes durante e após
a sessão de hemodiálise?
Ahmet elbAy1, muhAmmed Altinisik2, Alper dincyildiz3, isil kutluturk4, Julide cAnAn1, umurhAn AkkAn1, Arif koytAk1, hAkAn ozdemir1
Submitted for publication: September 17, 2016 Accepted for publication: March 19, 2017
1 Department of Ophthalmology, Bezmialem University School of Medicine, Istanbul, Turkey. 2 Department of Ophthalmology, Nevsehir State Hospital, Nevsehir, Turkey.
3 Department of Ophthalmology, Pendik State Hospital, Istanbul, Turkey.
4 Umraniye Training and Research Hospital, Department of Ophthalmology, Istanbul, Turkey.
Funding: No specific financial support was available for this study
Disclosure of potential conflicts of interest: None of the authors have any potential conflict of interests to disclose.
Corresponding author: Ahmet Elbay. Zümrütevler Mh. Yol-6 Sk. No: 2 Seyrantepe Konutları A4/52
Maltepe, Istanbul, Turkey - E-mail: [email protected]
Approved by the following research ethics committee: Bezmialem Vakif University Research Ethics
Committee (#18/28, 30.09.2015). INTRODUCTION
Imaging the choroid is not easy with commercial standard spec-tral domain optical coherence tomography (SD-OCT) because of blocking of signal transmission by the retinal pigment epithelium. Recent modifications in enhanced depth imaging optical coherence tomography (EDI-OCT) allow imaging of the choroid with reasona-ble clarity(1).
The choroid has the highest blood supply per area of any tissue(2).
It has long been thought that, unlike retinal blood low, choroidal blood low does not exhibit autoregulation(3).However, recent studies
have shown that choroidal blood low can autoregulate according to luctuations in systemic blood pressure(4,5).In addition to diurnal
or circadian variations of intraocular pressure (IOP) and anterior chamber depth, diurnal variations of choroidal thickness (CT) have been reported, and it was found that these changes are associated with changes in systemic blood pressure(6-8).
and leads to an increase in plasma colloid osmotic pressure(9). After
an increase in colloid osmotic pressure in hemodialysis patients, an osmotic pressure gradient develops between the plasma and the interstitial fluid that causes a shift of water from the interstitial fluid to the plasma(10).
The purpose of this study was to evaluate immediate changes in several ocular parameters, including subfoveal choroidal thickness (SFCT), in response to systemic hemodynamic changes induced by hemodialysis. To the best of our knowledge, this is the irst study that evaluates ocular changes not only from before to after hemodialysis but also during hemodialysis.
METHODS
Forty-six patients with chronic renal failure (CRF) undergoing hemodialysis in the Haemodialysis Unit of Pendik Government Hospital were enrolled in this study. The study was approved by the local university ethics committee. Informed consent from all patients and institutional review board approval were obtained in accordance with the Declaration of Helsinki. The inclusion criterion was a best corrected visual acuity (BCVA) >20/200. The exclusion criteria were the presence of ocular disease that would preclude examination of the cornea or macula or a history of ocular surgery, laser, or intravitreal injection during the previous three months.
Nineteen patients were excluded: 14 with diabetes mellitus (DM), 4 with hypertensive nephrosclerosis, and 1 with polycystic kidney disease whose choroidal tissue could not be clearly visualized by SD-OCT (signal image <8) in both eyes. The measurements were taken from the right eye except for four patients in whom SFCT could not be measured in the right eye. Thus, 27 eyes of 27 patients were included in the study.
The patients underwent hemodialysis three times per week for an average of 4 to 4.5 hours with the use of a high-performance dialyzer at a blood flow rate of 250 mL/min. The causes of CRF in the 27 patients were hypertensive nephrosclerosis (n=13), DM (n=7), polycystic kidney disease (n=3), chronic glomerulonephritis (n=2), and idiopathic renal failure (n=2). Four patients with DM also suffered from hypertension. Patients with CRF and DM (n=7) were diagnosed with nonproliferative diabetic retinopathy (NPDR) in three eyes and proliferative diabetic retinopathy (PDR) in four eyes. Three patients with PDR had previously undergone panretinal laser photocoagulation treatment. Two patients underwent a focal or grid laser or intravitreal injection for diabetic macular edema.
A detailed ophthalmologic examination, including IOP, central corneal thickness (CCT), iridocorneal angle (ICA), and SFCT, was per formed on each patient. The patients were examined in their beds in the sitting position just before and half an hour after a single hemodialysis session and also during the second hour of hemo-dialysis. The hemodialysis sessions started around 8:00 to 9:00 AM, and three or four patients were examined per day.
For IOP measurements, a tonometer (Tonopen-Avia, Reichert, Depew, NY, USA) was used. The measurements were taken with the patient in the sitting position and repeated three times. The mean value was noted.
CCT, ICA, and SFCT were measured with an SD-OCT device (Nidek RS-3000 Advance, Nidek Co, Aichi, Japan). For measurements of CCT and ICA, the anterior segment attachment of the device was used. A horizontal cross section of the central cornea was taken for CCT measurements. Care was taken that all measurements were obtained from the same section. The average of the measured three points, obtained automatically by the device, was used for calculating corneal thickness (Figure 1).
The iridocorneal angle could be measured in 24 eyes of 27 patients. One section was taken from the nasal quadrant for ICA measurement. All measurements were taken from the same section. To calculate the ICA, irst the scleral spur point on the OCT image was manually marked. Then, a circle with 750-µm radius centered on this
scleral spur point was displayed. After another point was marked on the intersection of this circle and the posterior surface of the cornea, a red line was displayed vertically from this point. After mar king a third point on the intersection of the red line and the anterior surface of the iris, another red line aligning close to the anterior surface of the iris was displayed. Finally, the red line was ma nually dragged exactly onto the surface of the iris. Thus, the ICA was displayed and was automatically calculated by the device (Figure 2). The limitations of this method include measurement of only one section and an absence of follow-up. The Macula Line scan protocol and ultrafine mode was used to evaluate SFCT, which ena-bles good-quality depth penetration with 120 averaged B-scans. SFCT was defined as the distance between the hyperscattering line of the retinal pigment epithelial cells and the border between the choroid and sclera, that is, the choroid-scleral interface (CSI)(11).
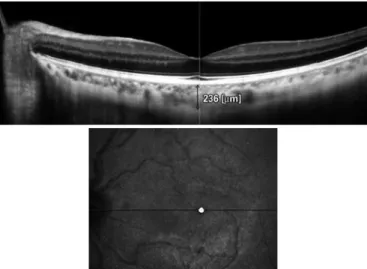
This method of CT analysis involves taking manual measurements perpendicularly from the outer edge of the hyperreflective retinal pigment epithelium to the CSI (Figure 3). All measurements were performed by the same physician. The device has an eye tracking system and reference scans.
Systemic blood pressure was measured at the same time as the ophthalmic examinations. Body weight was measured with a cali-brated scale (DESİS M307, ETS Co, Istanbul, Turkey) before and after hemodialysis, with the patient wearing the same clothes. The ultra-iltration volume for each patient was noted after the hemodialysis session from the screen of the dialysis machine (Fresenius 4008-S, Fresenius Medical Care AG, Bad Homburg, Germany).
Statistical analyses were performed with the Statistical Package for Social Sciences version 20.0 (SPSS, Chicago, IL, USA). Normality was initially assessed by the Kolmogorov-Smirnov test. Numerical data are expressed either as the median (minimum and maximum) or the mean ± standard deviation. The paired t-test or Wilcoxon test was used to compare means or medians, and the Pearson correla-tion test or Spearman’s rho correlacorrela-tion test was used to evaluate the correlations of numerical variables. A p value<0.05 was required for statistical significance.
AOD= angle open distance; TISA= trabecular iris space area; ACA= anterior chamber angle.
Figure 2. Optical coherence tomography image of iridocorneal angle (ICA) measurement in a patient.
Figure 3. Optical coherence tomography image of choroidal thickness (CT) measure-ment in a patient.
RESULTS
D
EMOGRAPHICCHARACTERISTICSA total of 27 eyes from 27 patients (16 men and 11 women; aged 20-82 years, mean age 54.92 ± 18.84 years) were examined in this study. The patients had been undergoing dialysis for a mean of 3.37 ± 2.30 years. Table 1 summarizes the demographic and clinical characteristics of the patients.
E
FFECTOFHEMODIALYSISONSYSTEMICPARAMETERSBody weight decreased signiicantly from 64.53 ± 12.71 kg before hemodialysis to 62.41 ± 12.25 kg after hemodialysis (p<0.001). Systolic blood pressure (SBP) decreased significantly from 140 (80-180) mmHg before hemodialysis to 120 (50-170) mmHg during the second hour of hemodialysis (p<0.01) and 120 (80-260) mmHg after hemodialysis (p<0.001). Diastolic blood pressure (DBP) was 80
(50-110) mmHg before hemodialysis, 80 (30-100) mmHg during the second hour of hemodialysis, and 70 (40-120) mmHg after hemo-dialysis; the differences were not statistically significant (p=0.701 and p=0.054, respectively) (Table 2).
E
FFECTOFHEMODIALYSISONOCULARPARAMETERSMean SFCT decreased signiicantly from 270.85 ± 73.82 µm before hemodialysis to 257.01 ± 71.49 µm during the second hour of hemodialysis (p<0.001). After hemodialysis, it increased slightly to 258.44 ± 75.17 µm, but it was still signiicantly lower than before hemodialysis (p<0.001).
Mean IOP increased signiicantly from 16.20 ± 3.27 mmHg before hemodialysis to 18.28 ± 3.79 mmHg during the second hour of he-modialysis (p=0.001). After hemodialysis, it decreased to 16.09 ± 2.97 mmHg, which did not difer signiicantly from the value before hemodialysis (p=0.844).
Mean CCT increased signiicantly from 546.11 ± 35.14 µm before hemodialysis to 553.89 ± 33.89 µm during the second hour of hemo-dialysis (p=0.011). However, no signiicant diference was observed after hemodialysis (550.44 ± 31.39 µm, p=0.246).
Mean ICA decreased slightly during the second hour of hemo-dialysis, then increased slightly after hemodialysis. There were no signiicant diferences from the values before hemodialysis (p=0.101 and p=0.589, respectively). Table 3 summarizes the efects of hemo-dialysis on ocular parameters.
A
SSOCIATIONSBETWEENCHANGESINSFCT
ANDOTHERPARAMETERSNo signiicant correlations were observed between the percen-tage changes in SFCT and other ocular and systemic parameters. On the other hand, the percentage changes in IOP from before to after hemodialysis were positively correlated with changes in SBP (r=0.449, p=0.019) (Figure 4). The power of these tests was calculated as between 0.497 and 0.509.
DISCUSSION
including refractive changes, increased tear osmolarity, dry eye, cor-neal endothelium changes, band keratopathy, and lenticular opa-city(10). Macular and retinal alterations have also been reported(12).
It is important to consider the potential effects of normal diurnal variation of IOP, CCT, and especially CT on the reported results(7,8).
One study reported that CT decreased progressively during the period from 9:00 AM to 5:00 PM, which is presumably when the he modialysis treatments were performed(7). However, Usui et al.
found that CT did not change signiicantly between 9:00 and 12:00 AM(8). Therefore, we measured the ocular parameters in the morning
hemodialysis sessions, not only before and after hemodialysis but also during hemodialysis.
In addition, hemodialysis has some unfavorable side efects on systemic parameters. One of the most frequent complications of hemodialysis is hypotension. It has been reported that the systemic parameters blood pressure, body weight, and serum osmolarity signi-icantly decreased and plasma colloid osmotic pressure signisigni-icantly increased after a single session of hemodialysis(9,10). During a single
session, removal of 2 to 4 L of luid is probably the most important factor in dialysis-induced hypotension and decrease in body weight. Autonomic nervous system dysfunction, which is common among dialysis patients, contributes to the pathogenesis of hypotension(13).
In agreement with other reports, we found that mean systolic and diastolic blood pressure and body weight decreased signiicantly after hemodialysis.
A structurally and functionally normal choroidal tissue is essential for retinal function. Abnormal choroidal blood flow can result in dysfunction and death of photoreceptors(14). The choroid also
modu-lates IOP by vasomotor control of blood flow and outflow of aqueous humor from the anterior chamber via the uveoscleral pathway, which is responsible for approximately 35% of the drainage(5).
Imaging the choroid with conventional SD-OCT has been dii-cult, mainly because of the diiculty in signal transmission beyond the retinal pigment epithelium. Recent modiications have provided a reasonably clear image of the choroid(1). We investigated SFCT with
macula line scan protocol and ultraine mode in this study, which enables good-quality depth penetration with 120 averaged B-scans.
CT varies for several reasons. A recent review suggested ive hy-potheses that include redistribution of luid as the cause of CT changes(15).First, it is possible that the increase in thickness is due to
increased synthesis of proteoglycans, which would draw water into the choroid. Second, the increase in thickness could be the result of an increase in the size or number of fenestrations in the chorioca-pillaris. Third, luid could enter the choroid as part of the drainage from the anterior chamber. Fourth, the luid could enter as a result of altered transport of luid from the retina across the retinal pigment epithelium. Finally, the increase in thickness could be due to changes in nonvascular smooth muscle tonus. Previous studies have reported age, axial length, and refractive error as factors afecting CT(16,17).
Recent investigations have shown that choroidal autoregulation or baroregulation can compensate for systemic blood pressure fluctua-tions(4). Hemodialysis and associated changes in systemic
circula-tory parameters, such as systemic blood pressure, hematocrit, and the amount of fluid removed, may affect the retinal and choroidal circulation, which decrease after hemodialysis(18).
In our study, mean SFCT decreased signiicantly during hemo-dialysis. Although SFCT increased slightly just after hemodialysis, it was still signiicantly thinner than before hemodialysis. Two recent studies by Ulas et al. and Celikay et al. reported similar results(19,20).
Conversely, Usui et al. and Jung et al. reported increased SFCT after hemodialysis(5,8).They suggested that SFCT was signiicantly
negatively correlated with SBP and that the increase in SFCT was due to vasodilation of choroidal vessels induced by a choroidal autoregu-latory response to the reduction in blood pressure.
There are contradictory reports about the relationship between SBP and SFCT. Tan et al.(7) found a positive correlation between
diurnal SBP and SFCT changes. On the other hand, Ulas et al.(19) Table 1. Patient characteristics
Characteristic Mean SD Range
Age (yr) 0054.92 018.84 20-82
Duration of hemodialysis (yr) 0003.37 002.30 1-9 Ultrailtration volume (mL) 2071.20 809.58 1000-4100 Intradialytic weight gain (kg) 0002.11 000.82 1.0-4.3
Table 2. Efect of hemodialysis on systemic parameters (n=27)
Variable Pre-HD 2nd hour of HD Post-HD
SBP (mmHg), median (range) 140 (80-180) 120 (50-170)
p=0.002* 120 (80-260)p<0.001*
DBP (mmHg), median (range) 080 (50-110) 080 (30-100)
p=0.701*
070 (40-120)
p=0.054*
Body weight (kg), mean ± SD 64.53 ± 12.71 - 62.41 ± 12.25 p<0.001**
HD= hemodialysis; SBP= systolic blood pressure; DBP= diastolic blood pressure. *= Wilcoxon test. **= Paired sample t-test.
Table 3. Efect of hemodialysis on ocular parameters
Variable Pre-HD 2nd hour of HD Post-HD
SFCT (n=27, µm) (mean ± SD) 270.85 ± 73.82 257.01 ± 71.49 p<0.001*
258.44 ± 75.17 p<0.001*
IOP (n=27, mmHg) (mean ± SD) 016.20 ± 03.27 018.28 ± 03.79
p=0.001*
016.09 ± 02.97
p=0.844*
CCT (n=27, µm) (mean ± SD)
546.11 ± 35.14 553.89 ± 33.89 p=0.011* 550.44 ± 31.39 p=0.246*
ICA (n=24°) (mean ± SD)
035.74 ± 07.85 034.79 ± p=0.101*07.65 035.38 ± p=0.589*07.43
HD= hemodialysis; SFCT= subfoveal choroidal thickness; IOP= intraocular pressure; CCT= central corneal thickness; ICA= iridocorneal angle.
*= Paired sample t-test.
Figure 4. Percent change in intraocular pressure (IOP) plotted against percent change
found that mean arterial pressure did not change after dialysis. They did not observe any correlation between changes in mean SBP and SFCT. Recently, Celikay et al.(20) suggested that SBP, DBP,
and SFCT decreased after hemodialysis. Although there was no correlation between the changes in SFCT and SBP, there was a po-sitive correlation between changes in SFCT and DBP. In our study, mean SFCT and SBP decreased after hemodialysis, but there was no significant change in DBP after hemodialysis. SBP increased in only four patients and decreased by more than 30 mmHg in three pa-tients. Additionally, we did not observe any significant correlations among changes in SBP, DBP, and SFCT. However, the power analysis of the correlation tests of the present study did not reveal strong findings. Further research with a larger sample size is needed to clarify the matter.
In a previous study, color Doppler ultrasonography revealed that the velocity of systolic and diastolic blood low in the ophthalmic artery, central retinal artery, and posterior ciliary arteries signiicantly decreased after hemodialysis when compared with predialysis va-lues(14). This decrease may be the cause of the choroidal thinning
that we observed.
On the other hand, an important mechanism in the changes in ocular parameters related to hemodialysis is shifting of luid and molecules between the blood and intraocular luids, including the aqueous humor, vitreous, and choroidal interstitium. There seem to be two intradialytic forces that afect ocular structures: ultrailtration and solute clearance. During hemodialysis, ultrailtration gives rise to a gradual decrease in the volume of the liquid in the extracellular luid compartment. Ultrailtration inally increases the oncotic pressure of the extracellular space, resulting in pulling out of luid from the surrounding tissues. During hemodialysis, the elux of water from the eye to the plasma occurs due to an increase in plasma colloid osmotic pressure(21). These changes can lead to a decrease in CT(20,21).
Therefore, ultrailtration-induced hypovolemia and increased plasma colloid osmotic pressure are thought to play a role in choroidal thinning. Several studies found that retinal thickness and macular edema decreased after hemodialysis(10), a result compatible with this
idea.Signiicant retinal thinning has also been observed in diabetic patients after hemodialysis(22,23). Decreases in corneal thickness and
IOP after a hemodialysis session have been mentioned in some studies with similar mechanisms of changing the extracellular luid compartment(10,21,24).
In the early period of dialysis, a diferent mechanism has a role. As mentioned above, in hemodialysis patients with narrow angles, neovascular glaucoma, or exfoliative glaucoma, a peak in IOP was observed after hemodialysis(25,26). According to this mechanism, a
rapid fall in plasma osmolarity during hemodialysis results in an os-molar gradient between the plasma and ocular tissue that provokes a shift of luid into the ocular tissue(25).Burn proposed a similar
mecha-nism and described it as being analogous to cerebral edema in the disequilibrium syndrome(27). This mechanism was further supported
by Ghafariyeh et al.(28), who noted high vitreous urea rebound in a
glaucoma patient with increased IOP during hemodialysis. The shift of luid from the choroid into the eye may lead to choroidal thinning as well as an increase in IOP. In the later period of hemodialysis, the relatively stable SFCT may be related to relatively stable serum osmo-larity(29,30), which may result in a decrease in the shift of luid between
the blood, intraocular luid, and choroidal interstitium.
A signiicant elevation in IOP during hemodialysis may increase the risk of the development and progression of glaucoma. A history of hemodialysis needs to be considered in anamnesis of patients who have progression of glaucoma, even when IOP has been well controlled. Routine monitoring of IOP during hemodialysis sessions may be beneicial for glaucoma patients to minimize elevation in IOP.
The lack of correlation between mean SFCT change and ultrail-tration volume or body weight in our study may due to the fact that other parameters that also inluence CT are afected during the course of hemodialysis. The alterations in CT during hemodialysis cannot
be explained only by the choroidal autoregulatory response to SBP. Choroidal regulation can be caused by a range of factors (Müller cells, vascular endothelial growth factor [VEGF], and other cytokines). Several studies have demonstrated that clearance or membrane adsorption of cytokines during hemodialysis can alter circulating cytokine levels(31,32). Further studies of this mechanism are needed.
There are several limitations to this study. Serum osmolarity and plasma total protein and albumin levels were not measured. Due to the small sample size, it is diicult to apply these results to all hemo-dialysis patients. On the other hand, these indings are quite consis-tent and repetitive, which suggests that they represent the efects of hemodialysis for most CRF patients. We did not control what the patients did during hemodialysis, such as watching television or reading. These factors might have afected the ocular surface changes.
In conclusion, CCT and IOP increased and SFCT decreased during the first half of the hemodialysis session. During the second half of the session, CCT and IOP showed a trend towards reduction, whereas SFCT had a relatively steady course. Measurements of the iridocorneal angle revealed no statistically signiicant changes during and after hemodialysis sessions. When analyzing the ocular efects of dialysis, it would be reasonable to evaluate the changes not only from before to after hemodialysis but also during hemodialysis.
Further largescale randomized studies are needed to fully eva -luate the efect of hemodialysis on ocular structures and the rela-tionships among ophthalmologic changes and systemic hemody-namic alterations induced by hemodialysis in patients with CRF.
ACKNOWLEDGMENTS
The authors thank Dr. Yunus Gül (Haemodialysis Unit of Pendik Government Hospital), who facilitated the carrying out of this study.
REFERENCES
1. Wong IY, Koizumi H, Lai WW. Enhanced depth imaging optical coherence tomogra-phy. Ophthalmic Surg Lasers Imaging. 2011;42 Suppl:S75-84.
2. Yu DY, Yu PK,Cringle SJ,Kang MH,Su EN. Functional and morphological characteris-tics of the retinal and choroidal vasculature. Prog Retin Eye Res.2014;40:53-93. 3. Delaey C, Van De Voorde J. Regulatory mechanisms in the retinal and choroidal
cir-cu lation. Ophthalmic Res. 2000;32(6):249-56.
4. Reiner A, Li C, Del Mar N, Fitzgerald ME. Choroidal blood low compensation in rats for arterial blood pressure decreases is neuronal nitric oxide-dependent but compen-sation for arterial blood pressure increases is not. Exp Eye Res. 2010;90(6):734-41. 5. Jung JW, Chin HS, Lee DH, Yoon MH, Kim NR. Changes in subfoveal choroidal thickness
and choroidal extravascular density by spectral domain optical coherence tomogra-phy after haemodialysis: a pilot study. Br J Ophthalmol. 2014;98(2):207-12. 6. Chakraborty R,Read SA,Collins MJ. Diurnal variationsin axial length,choroidal
thickness, intraocular pressure, and ocular biometrics. Invest Ophthalmol Vis Sci.2011; 52(8):5121-9.
7. Tan CS, Ouyang Y, Ruiz H, Sadda SR. Diurnal variation of choroidal thickness in normal, healthy subjects measured by spectral domain optical coherence tomography. Invest Ophthalmol Vis Sci. 2012;53(1):261-6.
8. Usui S, Ikuno Y, Akiba M, Maruko I, Sekiryu T, Nishida K, et al. Circadian changes in subfoveal choroidal thickness and the relationship with circulatory factors in healthy subjects. Invest Ophthalmol Vis Sci. 2012;53(4):2300-7.
9. Leypoldt JK, Cheung AK, Delmez JA, Gassman JJ, Levin NW, Lewis JA, et al. Rela-tionship between volume status and blood pressure during chronic hemodialysis. Kidney Int. 2002;61(1):266-75.
10. Jung JW, Yoon MH, Lee SW, Chin HS. Efect of hemodialysis (HD) in intraocular pres-sure, ocular surface and macular change in patients with chronicrenal failure. Graefes Arch Clin Exp Ophthalmol. 2013;251(1):153-62.
11. Adhi M, Duker JS. Optical coherence tomography-current and future applications. Curr Opin Ophthalmol. 2013;24(3):213-21.
12. Niutta A, Spicci D, Barcaroli I. Fluoroangiographic indings in hemodialyzed patients.
Ann Ophthalmol. 1993;25(10):375-80.
13. Tosun O,Davutluoglu B,Arda K, Boran M, Yarangumeli A, Kurt A, et al. Determination of the efect of a single hemodialysis session on retrobulbar blood hemodynamics by color doppler ultrasonography. Acta Radiol.2007;48(7):763-7.
14. Regatieri CV,Branchini L,Fujimoto JG,Duker JS. Choroidal imaging using spectral-do-main optical coherence tomography. Retina.2012;32(5):865-76.
15. Nickla DL, Wallman J. The multifunctional choroid. Prog Retin Eye Res. 2010;29(2):144-68. 16. Ikuno Y, Kawaguchi K, Nouchi T, Yasuno Y. Choroidal thickness in healthy Japanese
17. Agawa T, Miura M, Ikuno Y, Makita S, Fabritius T, Iwasaki T, et al. Choroidal thickness measurement in healthy Japanese subjects by three-dimensional high-penetration optical coherence tomography. Graefes Arch Clin Exp Ophthalmol. 2011;249(10): 1485-92.
18. Nagaoka T, Takeyama Y, Kanagawa S, Sakagami K, Mori F, Yoshida A. Efect of haemo-dialysis on retinal circulation in patients with end stage renal disease. Br J Oph thalmol.
2004;88(8):1026-9.
19. Ulaş F, Doğan Ü, Keleş A, Ertilav M, Tekçe H, Celebi S. Evaluation of choroidal and re-tinal thickness measurements using optical coherence tomography in non-diabetic haemodialysis patients. Int Ophthalmol. 2013;33(5):533-9. Comment in: Int Ophthalmol. 2014;34(4):735-6.
20. Çelikay O, Çalışkan S, Biçer T, Kabataş N, Gürdal C. The acute efect of hemodialysis on choroidal thickness. J Ophthalmol. 2015;2015:528681. doi: 10.1155/2015/528681 21. Tokuyama T, Ikeda T, Sato K. Efect of plasma colloid osmotic pressure on intraocular
pressure during hemodialysis. Br J Ophthalmol. 1998;82(7):751-3.
22. Theodossiadis PG, Theodoropoulou S, Neamonitou G, Grigoropoulos V, Liarakos V, Triantou E, et al. Hemodialysis-induced alterations in macular thickness measured by optical coherence tomography in diabetic patients with end-stage renal disease. Oph thalmologica. 2012;227(2):90-4.
23. Auyanet I, Rodriguez LJ, Bosch E, Sanchez AY, Esparza N, Lago MM, et al. Measurement of foveal thickness by optical coherence tomography in adult haemodialysis patients with diabetic nephropathy. Nefrologia.2011;31(1):66-9.
24. Dinc UA, Ozdek S, Aktas Z, Guz G, Onol M. Changes in intraocular pressure and cor neal and retinal nerve iber layer thickness during hemodialysis. Int Ophthalmol. 2010; 30(4):337-40.
25. Lim SH, Son J, Cha SC. Recurrent symptomatic intraocular pressure spikes during he modialysis in a patient with unilateral uveitis. BMC Ophthalmol 2013;13:3. doi: 10.1186/1471-2415-13-3
26. Levy J, Tovbin D, Lifshitz T, Zlotnik M, Tessler Z. Intraocular pressure during haemo-dialysis: a review. Eye (Lond). 2005;19(12):1249-56.
27. Burn RA. Intraocular pressure during haemodialysis. Br J Ophthalmol. 1973;57(7):511-3. 28. Ghafariyeh A, Honarpisheh N, Pishva E. High vitreous urea rebound in a glaucoma
patient with increased intraocular pressure during hemodialysis. Can J Ophthalmol.
2009;44(5):e51.
29. Rodrigo F, Schideman J, McHugh R, Buselmeier T, Kjellstrand C. Osmolality changes during hemodialysis. Natural history, clinical correlations, and inluence of dialysate glucose and intravenous mannitol. Ann Intern Med. 1977;86(5):554-61.
30. Hisashi M, Yuzo S, Akihiro O. Markedly increased unilateral intraocular pressure during hemodialysis in a patient with ipsilateral exfoliative glaucoma. Am J Ophthalmol. 2000;129(4):534-6.
31. Tarakçıoğlu M, Erbağci AB, Usalan C, Deveci R, Kocabaş R. Acute efect of hemodialysis on serum levels of the proinlammatory cytokines. Mediators Inlamm. 2003;12(1):15-9. 32. Kuo HL, Chou CY, Liu YL, Yang YF, Huang CC, Lin HH. Reduction of pro-inlammatory
cytokines through hemodiailtration. Ren Fail. 2008;30(8):796-800.