A Work Project, presented as part of the requirement for the Award of a Masters Degree in Economics from the Faculdade de Economia da Universidade Nova de
Lisboa.
THE IMPACTS OF THE CAPE VERDE SELF-EMPLOYED
SOCIAL SECURITY SCHEME
ANA CRISTINA LOPES SEMEDO N0 14000360 Project carried out with the supervision of:
Professor Susana Peralta
1
Abstract
Cape Verde, as many developing countries, is attempting to extend the social protection toward the independent workers, which represent about 32% of the country employed force. This work project analysis the impacts of the Cape Verde self-employed social security framework, under both individual and scheme perspectives. Based on overlapping generations projections that allows for life-cycle behavior, we find that the returns on the pension contributions are negative for men, and that the scheme might not be financially sustainable, over a sixty year horizon.
2 1. Introduction
Half of the world’s population (workers and their families) is excluded from any type of
statutory security protection against the so-called social risks.1 The lack of social protection affects primarily the growing vulnerable populations of developing countries, the workers outside of the formal economy.2 In most of the cases, this poorest and unskilled population (self-employed in small businesses and their recruits) is averse to compromise a relatively high proportion of their low and variable earnings to finance insurance that does not meet their priority needs (immediate consumption, health care and primary education for their child), as stated by van Ginneken (2003)3. In other cases, administrative bottleneck and problems with compliance restrict the informal workers access to the statutory schemes. Lack of confidence on the public schemes (due to poor management), also, leads many of this work force to rely on informal safety nets to cope with idiosyncratic shocks (van Ginneken 1999)4. However, these family and community base supports are limited in addressing common shocks and situations of extreme poverty. Moreover, they are falling apart, in many countries, with the increasing urbanization (Murdoch, 1999).
Hence, the growing vulnerability of a relevant share of population is justifying major reforms on the developing countries statutory schemes, in attempt to both, properly, expand the coverage of the contributory pension (for those who can afford
1
According to ILO (2010). Furthermore, it is stated that only 20% of the world population is covered properly against unemployment, sickness and old age poverty risks.
2
The lack of social protection specially affects Sub-Saharan Africa and South Asia, where the statutory scheme are estimated to reach only 5 to 10% of the working population (those who have qualified and stable jobs). Nonetheless, most of the social security schemes in those countries are open to the informal workers participation (on a voluntary basis), as stated by van Ginneken (1999).
The informal (but legal) economy can be defined as the “market-based production of goods and services that escapes detection in the official estimates of GDP” Smith (1985). Both, OIT (2005) and Schneider (2002) find that governance and institutions issues are the main determinants of the weight of the informal economy in developing countries. At the global level the informal economy employs about 50% of the labor force, while in Sub-Saharan Africa these vulnerable employment reaches 75,5% of the working force, according to the International Labor Organization estimates (ILO, 2010).
3
In addition, they seek protection in case of death and disability rather than against old age poverty (van Ginneken, 1999).
4
3 it) and to extend the tax financed protection (non-contributory), for the financially constrained individuals.
Though, the policy is challenging. On one hand, absence of official records of the informal sector earnings makes it difficult to enforce contributions, for the universal benefits program. On the other hand, little fiscal space (given the size of the informal economy) restraints the public provision of the tax base pension. Thus, efforts to integrate the self-employed workers into the statutory schemes have mixed success (van Ginneken, 2003), most of them involving government subsidizing part of the contributions.5
The aim of this work project is to provide an assessment of the Cape Verde’s
case, in particular of the self-employed social security scheme. In Cape Verde the very first experience to extend social security protection started in 2001, with the introduction of a law establishing the framework for a multipillar scheme, followed by a specific law for the self-employed social protection, in 2003. However, the National Insurance Institute (INPS) reports that, by the end of 2009, only 8 independent workers (in a universe of close to 50 thousand) were part of the system. The low adherence motivated the revision of the 2003’s law in late 2009. In the same period, another law, targeted to the domestic servants was published.
In order to evaluate the self-employed social security program we undertook two different exercises. The first one consisted in computing the expected return on the pension contributions for several representative workers, with the objectives of
5
4 uncover the reasons behind the low responsiveness of the 2003 law, estimate if the required contribution is within the financial capacity of individuals and assess if the program is proficient in providing reliable means to smooth life time consumption. The second exercise entailed a projection of the system revenues and expenditures for a sixty years horizon. Apart from appraising if the scheme is financially sound, we also tested its resilience to shocks from economic and demographic volatility.
According to our estimates, the revised program is affordable by the targeted population; however, the returns on the pension contribution are negative for men, who retire later and have shorter life expectancy. This result may explain, among other reasons, the observed low adherence. In line with our baseline assumptions, the program is not financially sound, suggesting some inter-generations redistribution.
The report proceeds as follows. Section 2 provides a brief theoretical introduction to social security programs. Section 3 presents some information about the Cape Verde economy and describes the self-employed framework. Section 4 describes the data and the empirical strategy. Section 5 computes the individuals’ returns on the pension contribution. Section 6 provides the budgetary impacts of the scheme, and section 7 concludes.
2. Social Security – A Brief Theoretical Introduction
Public old age pension schemes, part of the social insurance systems, are one of the main programs run by government across the world.6 The social insurance programs are linked to the major objectives of the welfare state, namely efficiency and equity promotion, and aim at minimizing the disutility that risk averse workers have when faced with uncertainties (regarding, e.g., the contingencies and length of sickness and unemployment episodes, and old age poverty).
6
5 The public provision of old age pensions through Pay-as-you-go (PAYG) schemes is perceived to be important to counter for individuals life cycle myopia (which leads them to under-save against old age poverty), to prevent free-riding behavior in the presence of altruism, and to assure vertical income redistribution, based on life time earnings (Feldstein and Liebman, 2002).7 As opposed of funded schemes, which provides retirement pension based on individuals assets accumulation during the working life, PAYG (defined benefits) are contributory unfunded universal benefit programs, where the pension provision does not necessarily meet the
individual’s prior contributions.8
In such system, the pension of a current retired population is financed through an income tax (payroll tax) levied on the current workforce.9 Thus, the pension of the retired population is determined as follow:
𝑃𝑡 =𝑁𝑡∗ 𝑤𝑡∗𝑡
Where𝑃𝑡,𝑁𝑡,𝑤𝑡𝑎𝑛𝑑𝑡 stand, respectively, for the period t pension, working force, wages and payroll tax. Accordingly, and assuming that the payroll tax is kept unchanged from period t to period t+1, the current working population pension contribution return, is:
𝑃𝑡+1
𝑃𝑡 = 𝑁𝑡+1∗ 𝑤𝑡+1∗𝑡 /( 𝑁𝑡∗ 𝑤𝑡 ∗𝑡)= 1 +𝑛 ∗(1 +𝑔)
where 𝑛 and 𝑔 stand for the population and wage growth rates, respectively.10In turn, the government faces in each period the following budget constraint:11
𝐵𝑡+1=𝑟𝐵𝑡 +𝐺𝑡+𝑃𝑡− 𝑇𝑡
7
Roughly, the same efficiency arguments justify the appropriate regulation of the private pension schemes. In many countries, Chile for instance, instead of actually supply the pension insurance government makes compulsory the workers participation in the private schemes (funded schemes). However, the PAYG schemes are viewed to be superior than funded schemes in handling inflation shocks and others common shocks, such as unfavorable business cycle (Barr, 2004).
8 In the defined benefits scheme the worker is promised an annuity at retirement, generally based on some average of the last working life income.
9
In this overlapping generations representation we are assuming that (i) individuals have finite lives, which evolve in two distinct stages, working life and retirement; (ii) they only face idiosyncratic risks, the workers face potential income loss (e.g. due to sudden sickness), while the retirees face the longevity risk.
10
The wages are supposed to follow the economy (technological) progress. 11
6 Where 𝐵𝑡+1,𝑟𝐵𝑡,𝑃𝑡,𝐺𝑡𝑎𝑛𝑑𝑇𝑡 are, respectively, the government funding need in period t+1; the outstanding debt service in period t; the expenditures with the social security; others government expenditures and the income tax levied on the working force, including the payroll tax. Moreover, in the long run, the sovereign solvency requires that the government primary budget surplus (excluding the expenditure with the debt services) is sufficient to repay (all) the accumulated debt.
Thus, the (defined benefits social) security programs redistributes from the retired generation to the working generation, whenever the working force and the economy grows, as well as from rich to poor (given that the pension is a lump sum expenditure, whereas the contribution is income related).
3. The Self-Employed Social Security Framework
3.1. Cape Verde Economy - A Brief Overview
Cape Verde is a small middle income African economy, essentially driven by the services sector (which represented 67% of the GDP, in 2008, according to the Central Bank estimates), and in particular by tourism activity (19% of GDP). Since the late 90’s, the country is experiencing a steady economic growth (6,8% on average, in the last decade), relatively low inflation (2,5% on average), and generally a quite favorable macroeconomic conditions.12 The macroeconomic policy pursuit (fiscal consolidation and tight monetary policy) in order to support the exchange rate regime (currency peg to the Euro), in place since 1998, by contributing to strength the economy fundamentals, is the main responsible for this positive performance.13
However, the country is still very dependent on exogenous foreign capital inflows, such as emigrant remittances and official grants, which represented
12Some selected country’s economic and financial indicators are presented in Appendix 2. 13
7 respectively 8,5% and 6,7% of GDP in 2008.14 The unemployment rate is, also, high (17,8% in 2008, as reported by the survey conducted jointly by the National Statistics and Employment Institutes). In addition, the economy stands largely reliant on informal activities. Self-employment represented 31,4% of the working force in 2008, according to IEFP-INE (2008), and 13,7% of employed force were unpaid family and others recruits of the own account business.15 The informal entrepreneurship is the key driver of the extractive industry, agriculture and retail activities, employing, respectively, 96%, 92% and 64% of the total working force of these sectors.
3.2. Social Security Protection in Cape Verde
Social security protection is a Constitutional right in Cape Verde.16 Accordingly, the social insurance law (Law N0 131/V/2001) establishes a multipillar pension system, comprising a means tested, non-contributory pillar, targeted to individuals living below the poverty line (defined by the National Statistics Institute as 1,25 Euro per day); a contributory and compulsory scheme run by the National Insurance Institute (INPS); and a fully-funded private pillar, designed as a complement of the contributory scheme.
The INPS scheme, which provides comprehensive social protection (pensions, family benefits and health care) covers approximately 38% of the country´s total employed force, in both private and public sectors (new employed force from 2005).17 INPS is relatively young organization, both chronologically (operating from 1982) and
14
According to the Central Bank statistics, available at www.bcv.cv. 15
The employment survey conducted jointly by the Employment Institute (IEFP) and the National Statistics Institute (INE) is targeted to a randomized sample of families of all the country regions. The survey is carried out since 2006, on a two-year basis, in both rural and urban areas. It aims at evaluating the family life conditions, as well. The methodology used is direct interviews, consistent with the International Labor Organization’s recommendations. Detailed information about the methodology and results are provided by www.ine.cv and www.iefp.cv.
16
As defined in the article 69 th ofthe Constitutional Law of the Republic of Cape Verde. 17 The scheme covers about 28% of the country’s population (workers and families).
8 demographically (with the dependency ratio hovering 18).18 Thus the youth, besides a parametric reform approved in 2005 (Decree Law N0 51/2005) is responsible for its favorable financial situation (with a trust fund that amounts 15% of GDP).19
3.3. The Self-Employed Social Insurance Framework
The first self-employed insurance framework (Decree Law N0 28/2003) was targeted to specific professional categories (services rendered), whose contribution was compulsory for old age pensions and optional for other contingencies.For old age pensions only, they were required to contribute 11,5% of income; whereas for all the social insurance protection the payroll tax rate was 19,5%.
In 2009, the independent workers social insurance law was extended to all self-employed with a minimum monthly income of 8.800 Cape-Verdean Escudos (CVE), the
public servant’s minimum wage (Decree Law N0 48/2009). The contribution rate of the
self-employed (and spouse) was set at 19,5%, and included all the social protection, without possibility of opting out of specific categories, as under the precedent law. Accordingly, the law established as mandatory the enrollment of all independent workers, female under 45 years old and male younger than 50 years old. The gender discrimination is consistent with the retirement age (60 years old for women, and 65 years old for men) and aim at meeting the old age pension minimum required contribution length (15 years of contributions).
4. Data Availability and Empirical Strategy
The available records of self-employment in Cape Verde are sparse and aggregated. The information refers to the number, gender structure, average worker age and average income per sector of activity, as presented in Table 1.
18 The dependency ratio is the number of contributors over the number of beneficiaries. 19
9
Table 1: A Snapshot of the Self-Employment in Cape Verde
On the other hand, quite detailed data on the current beneficiaries of the statutory scheme is available, with individual records that include age, wage and gender, from 1982 to 2008. Thus, our strategy is to complement the available information of the self-employment with these detailed records on salaried workers, assuming that the two groups of workers are not significantly different. In this sense, we decided to exclude agriculture, fishing and extractive industry from our analysis. The very high proportion of self-employment in those sectors precludes us from using the formal sector information as a benchmark.20
As shown in Table 2, the most relevant difference between the two groups relates to the wage, with the salaried workers enjoying relatively higher wages, on average, unless for the first quartile. The wage differential is consistent with the estimated schooling gap between the two groups. According to Ministério de Emprego e Qualificação Profissional (2008) records, more than 60% of the self-employed only have the primary school degree or are illiterated, whereas 67% of the salaried force has at least secondary schooling.21
20 Notice that more than 90% of the employed force of these sectors is informal workers. 21
In an attempt to further validate our strategy, we interviewed 10 informal workers from different activity sectors. While it is hard to argue that the conclusions from this survey are representative of the self-employed population, it is worthwhile to remarks that (i) the reported characteristics regarding age and schooling are quite similar to the available data on the self-employed and (ii) 4 persons reported
Total Age Wage1
Workers (Average) (Average, CVE2) Agriculture and Fishing 26.139 40 60 38 32.639 Extractive Industry 2.554 67 33 31 54.657
Manufactures 4.266 34 66 39 24.665
Construction 8.949 9 91 33 63.553
Retails 15.572 65 35 39 35.567
Hotels and Restaurants 887 63 37 32 27.728 Transports and Communication 1.969 17 83 39 35.090
Other Services 544 64 37 40 29.523
Notes: The data on number of workers, gender and average age are from the 2008 employment survey (IEFP-INE, 2008). The wage distribution data is from the 2002 Business Census (INE, 2002).
1
Monthly average wage.
21 EUR=110,3 CVE
10
Table 2: The Main Characteristics of the Employed Force
5. The Individual Return on the Self-Employed Pension Scheme
The expected rate of return of the pension scheme is calculated, for several representative workers, according to the formula:
𝑃𝑟𝑒𝑠𝑒𝑛𝑡𝑣𝑎𝑙𝑢𝑒𝑜𝑓𝑟𝑒𝑡𝑖𝑟𝑒𝑚𝑒𝑛𝑡𝑝𝑒𝑛𝑠𝑖𝑜𝑛𝑠 𝑃𝑟𝑒𝑠𝑒𝑛𝑡𝑣𝑎𝑙𝑢𝑒𝑜𝑓𝑐𝑜𝑛𝑡𝑟𝑖𝑏𝑢𝑡𝑖𝑜𝑛𝑠 −1
With the purpose of evaluating the cost of contributing for the old age pension in its best alternative use, we choose, for the computations, the individual marginal rate of time preference (rate at which individuals make the trade-off between current and future consumptions) as the best return on savings, i.e. the highest annual return on term deposits (3,5% in real terms, based on the Central Bank’s data).22
some mobility between the formal and the informal jobs, while 1 complements the business with a formal job. The main results are presented in appendix 3.
22
Note that this critical assumption implies that our targeted population has access to the financial market, face the same interest rate and are willing to trade the current for the future consumption at the same rate. Furthermore, this assumption rules out transactions costs and uncertainty. Notice, also,
Number 32.186,0 35.217,0 -8,6
Gender
Female (%) 42,3 39,2 7,9
Male (%) 57,7 60,8 -5,1
Age
Mean 37,1 38,5 -3,7
Median 39,0 38,5 1,2
Standard Deviation 3,6 9,8 Wage (CVE)
Quartile I 28.176,5 20.000,0 40,9
Quartile II 32.306,7 38.455,0 -16,0
Quartile III 35.448,0 64.121,5 -44,7
Quartile IV 63.552,7 989.443,0 -93,6
Mean 36.020,9 49.596,0 -27,4
Standard Deviation 14.135,3 43.358,0 Notes:
1
Based on the employment survey of 2008 (INE-IEFP, 2008) excluding agriculture, fishing and extractive industry. The wage distribution is in line with the Business Census of 2002 (INE, 2002).
2
Sample of the current contributors of INPS with monthly wage 8.800 CVE, based on 2008 records.
3 [(Self-Employed - Salaried Workers) / Salaried Workers] *100
Relative Difference3 Salaried Workers2
11 In order to project the contributions and the retirement pension flows we estimate the life cycle income in line with the human capital earnings function proposed by Mincer in 1974 (Willis, 1986) of the form:
𝐿𝑛𝑦𝑖 =𝛽0 +𝛽1𝑠𝑖+𝛽2𝑥𝑖+𝛽3𝑥𝑖2+𝑢𝑖
Where 𝑦𝑖,𝑠𝑖 𝑎𝑛𝑑𝑥𝑖, stand for income, schooling level, and age of the individual 𝑖, respectively, while 𝑢𝑖 is an error term. The coefficient β1 provides an estimate of the constant rate of returns to education, whilst the coefficients of 𝑥𝑖 and 𝑥𝑖2, with expected opposite signs, yield the return of the experience term, and confer the concave shape to the earnings profile.23 In our case, since the INPS sample lack both reliable data on experience and schooling information, we approximated the life cycle income of the independent workers by the following cross sectional quartiles regressions, to account for the skill premium and activity sector earnings differentials:24
Quartile 1: 𝐿𝑛𝑤𝑎𝑔𝑒𝑖 = 8,186858 + 0,077296𝑎𝑔𝑒𝑖−0,000833𝑎𝑔𝑒𝑖2+ 0,133126𝑔𝑒𝑛𝑑𝑒𝑟
Quartile 2:𝐿𝑛𝑤𝑎𝑔𝑒𝑖= 7,889445 + 0,129724𝑎𝑔𝑒𝑖−0,001423𝑎𝑔𝑒𝑖2−0,032816𝑔𝑒𝑛𝑑𝑒𝑟
Quartile 3: 𝐿𝑛𝑤𝑎𝑔𝑒𝑖 = 9,222000 + 0,077472𝑎𝑔𝑒𝑖−0,000728𝑎𝑔𝑒𝑖2−0,003535𝑔𝑒𝑛𝑑𝑒𝑟
Quartile 4: 𝐿𝑛𝑤𝑎𝑔𝑒𝑖 = 9,593364 + 0,107496𝑎𝑔𝑒𝑖−0,001044𝑎𝑔𝑒𝑖2+ 0,135020𝑔𝑒𝑛𝑑𝑒𝑟
that IEFP (1997) reports that 67% of the informal businesses have access to formal financial market, which makes our assumption not completely unrealistic.
Given the nominal rate (from the Central Bank statistics), the savings real rate was calculated considering the twelve month inflation rate of 2009 (1%, according to the National Statistics Institute). The highest market savings rate is the 2 years term deposits rate. Though, the individuals can enjoy higher returns with some stock market products. Thus, aiming at control some market imperfection, in particularly, regarding this special population, we are being conservative.
23
In the absence of reliable data on experience, a transformation of the workers age is commonly used as proxy (Willis, 1986). Hence, 𝑥𝑖 is determined by subtracting the worker age to his years of schooling, supposing that he is full-time employed, immediately after completing his education.
24 These regressions allow us to make a more robust inference about the evolution of the wages, under the assumption that the individuals do not change the respective quartiles along their life cycle.
12 The remaining baseline assumptions for the computations are: 1) the payroll tax rate, which is 19,5% of yearly income, from which 10% are allocated to pension provision; 2) the length of contribution (40 years for men and 35 years for women, according to the law); 3) the life expectancy which is 75 years old for women and 70 years old for men, according to the INE demographics projections, based on the population census of 2000; 4) the retirement pension which is equal to 80% of the average of the 10 best incomes of the last 15 years of contribution. We also use alternative assumptions on discount rate and life cycle income, as a means to test for the robustness of our results.
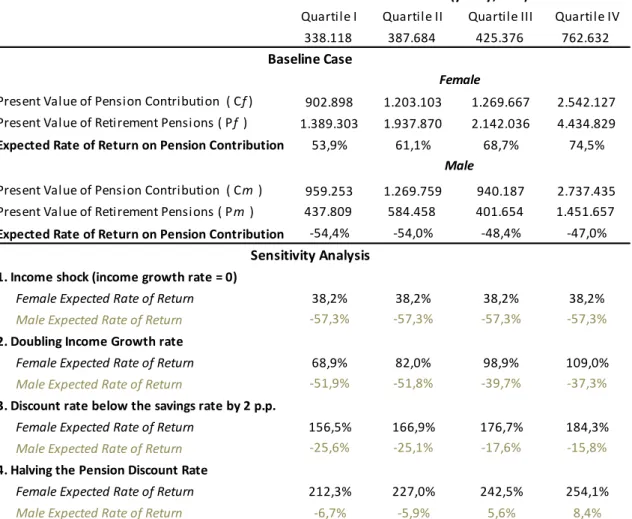
As shown in Table 3, at the baseline scenario the expected rate of return on pensions are negatives for men, whilst positives for women, who retire earlier and live longer.25 The women expected returns decline, although remaining positives, when we simulate an income shock, setting the wages growth rate equal to 0. On the other hand, even doubling the incomes growth rate the men expected returns remain negatives.
Relaxing further the perfect financial market assumption and considering that due to credit rationing people will under invest, a sensitivity analysis dropping the discount rate below the savings rate by two percentage points, increases the men returns, but not enough to make them positive.26 In turn, halving the pensions’
25
Notice that for the income projections, we are using the average wages, as reported by INE (2002), as the starting career earnings. Since the self-employed framework law targets the business owner of a sole proprietorship and spouse, we suppose that on aggregated their earnings are equal to their business cash flow (i.e. close to the activity highest wages). However, we are considering some tendency to under report.
It is important to highlight that even the poorest individual (according to Decree Law N0 48/2009 the one who earns 8.800 CVE per month) does not qualify for the minimum pension (4.260 CVE per month). 26
This analysis is similar to a case aiming at evaluate the individuals opportunity cost of contributing at a one year Euribor trend. Given the exchange rate regime and being a small open economy, we are considering the Euribor rates as the closest analogue to the country’s world interest rate.
13 discount rate, in order to place higher weight on benefits that occurs far in the future, yield positive returns for the men enjoying the highest wages (at quartiles 3 and 4).
Table 3: Baseline Expected Returns on the Pension Contribution and Sensitivity Analysis
Notes: Contribution in period t (Ct) = 10%*wages in period t.
Pension (P) =10%*average of 10 best wages of last 15 years of contribution.
𝐶𝑓= (𝐶𝑡)
(1+𝑟)𝑡; 𝐶𝑚=
(𝐶𝑡) (1+𝑟)𝑡; 39
𝑡=0 34
𝑡=0 𝑃𝑓= 49𝑡=35(1+𝑃𝑟)𝑡; 𝑃𝑚=
𝑃
(1+𝑟)𝑡 44
𝑡=40
Thus, considering these consistent results, negative expected returns are likely to prevent the forward looking rational men to join the statutory scheme and therefore might, partially, explain the low responsiveness to the 2003 law.27 On the other hand, an analysis to the closed list of the professional categories, the Decree Law N0 28/2003 target, suggests a negative selection bias. The list only includes services rendered, which represents only 0,9% of total self-employed force (see other services
27
Notice that men are 58% of the self-employed force, according to INE records (see Table 2).
Quartile I Quartile II Quartile III Quartile IV 338.118 387.684 425.376 762.632
Present Value of Pension Contribution ( Cf) 902.898 1.203.103 1.269.667 2.542.127 Present Value of Retirement Pensions ( Pf ) 1.389.303 1.937.870 2.142.036 4.434.829
Expected Rate of Return on Pension Contribution 53,9% 61,1% 68,7% 74,5%
Present Value of Pension Contribution ( Cm ) 959.253 1.269.759 940.187 2.737.435 Present Value of Retirement Pensions ( Pm ) 437.809 584.458 401.654 1.451.657
Expected Rate of Return on Pension Contribution -54,4% -54,0% -48,4% -47,0%
1. Income shock (income growth rate = 0)
Female Expected Rate of Return 38,2% 38,2% 38,2% 38,2%
Male Expected Rate of Return -57,3% -57,3% -57,3% -57,3%
2. Doubling Income Growth rate
Female Expected Rate of Return 68,9% 82,0% 98,9% 109,0%
Male Expected Rate of Return -51,9% -51,8% -39,7% -37,3%
3. Discount rate below the savings rate by 2 p.p.
Female Expected Rate of Return 156,5% 166,9% 176,7% 184,3%
Male Expected Rate of Return -25,6% -25,1% -17,6% -15,8%
4. Halving the Pension Discount Rate
Female Expected Rate of Return 212,3% 227,0% 242,5% 254,1%
Male Expected Rate of Return -6,7% -5,9% 5,6% 8,4%
Incomes (yearly, CVE)
Baseline Case
Sensitivity Analysis
Female
14 in Table 1). Furthermore, the minimum income level of each professional category defined in the list seems excessively high (see appendix 4). Indeed, according to the business census records (see Table 1), the other services earnings were on average 69% below the lowest income considered in the referred list, suggesting that the law was requiring prohibitive contributions. In turn, assessing the role of hyperbolic discounting and myopia on the low adherence requires a more detailed investigation. The savings rate reported by the Central Bank (on average 13,5% and 9,8%, in nominal and real terms, respectively) only captures the formal financial system. The weight of the savings accumulated in the informal sector is not known. Besides, the financial market is still underdeveloped and incomplete. The stock market started functioning only as from 2005; microcredit institutions that care for the ones who do not have collateral to qualify for bank loans are recent in the country and there is no pension fund yet. Furthermore, difficulties with enforcement and public awareness can, also, explain the reduced number of self-employed in the statutory scheme.
In general, although the expected returns are negative for men, the program provides reliable means to smooth consumption. However, in order to maintain the pre-retirement living standards, both men and women are required to save. Moreover, according to our baseline assumptions, the savings gap, given by the ratio of the pension benefit to pre-retirement earnings, is on average close to 10% for women and 20% for men.
6. The Budgetary Impacts of the Self-Employed Social Security Scheme
15 1. Ten percent of the current population of self-employed will join the scheme in the next 10 years (3.219 individuals).28
2. Based on the medium run trend of self-employment (average yearly increase of 1,7%, from 1997 to 2008), we assume that the informal economy will create on average 1,5% new jobs per year. This 0,2 percentage point differential aim at capturing the observed fall in the self-employment weight on total labor force.29 Ten percent of this work force is estimated to join the system in 2011. From 2011 onwards, the statutory scheme will gradually improve its attractiveness for the new self-employed population, reaching 20% by 2016. This increase in adherence is likely to result from the INPS strategy of (i) enhance program’s awareness and (ii) open branches in geographical areas where the informal sector is pervasive.30 We expect that this new cohort will reach 6.491 individuals by the end of 2070.
3. Women will join the program in a higher proportion than men.31 For the current employed force we take the existing gender distribution (see Table 2). However, in the first four years (2011-2014) we set the women’s adherence rate equal to 60% of the total adherence per year. From 2015 onwards, we assume that men adherence will catch up and overcome the women participation rate, gradually. For the new contributors the women share is 55% against 45% of men share.
28
Notice that we are being conservative, given the results of the 2003 self-employment social security framework.
29
According to IEFP-INE (2008), between 2008 and 2006 the total self-employed weight on the total employed force decreased by 1 percentage point. However, we cannot tell for sure if this behavior is structural or it is an effect of some short run business’s environmental change.
30 The INPS strategy is close to the Tunisia case. According to Chaabane (2002) the Social Security Fund displacement, setting up itinerant centres where the informal activities were carried out, was crucial for the program’s success.
31
16 4. To take into account the technological progress, the baseline earnings for each new self-employed cohort are increased by the half of the long run real GDP growth (2,5%).32
5. The age at which the independent worker starts full time work is 26 years old, consistent with the fact that 92% of the salaried employed force (men and women) from the INPS sample is more than 25 years old. We assume further, that the current cohort is older, and therefore starts to contribute at age 37 (the average self-employed age) and with higher base earnings.33 This assumption relies on the hypothesis that they are on the business for longer and that the more educated ones (with higher wages) will be more responsive to the policy.
6. The retirement age for women and men are, respectively, 60 and 65 years. Accordingly, the length of contribution of the current cohort is 23 years for women and 28 years for men, whilst for the new employed groups it is 35 and 40 years, respectively, for women and men. The life expectancy is 75 years old for women and 70 years old for men.
7. The individual incomes evolve according to the life-cycle paths, estimated on the previous section.
8. Finally, the discount rate (r) that we use to discount the program future costs and benefits is the riskless market interest rate (the real rate of the 10 years Treasury
bond’s, 4,5%, according to Banco de Cabo Verde).34
Table 4 summarizes the income distribution, as considered on the projections
32
According to Banco de Cabo Verde (2006), that estimates the long run GPD ranging between 5% and 7%. Here the objective is to be conservative, incorporating the likely decrease in the weight of the informal economy, given the country potential path toward a more developed economy.
33
Baseline incomes plus a standard deviation (see Table 2). 34
17
Table 4: Baseline Income Distribution35
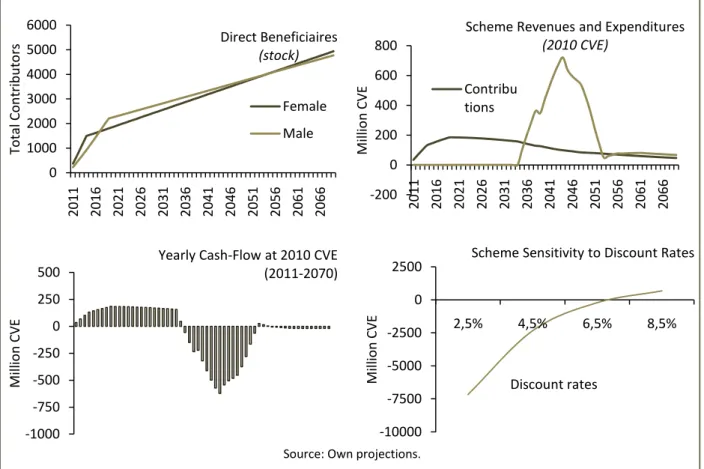
Due to the impact on the system of the first cohort, the scheme is not financially sound on the time horizon 2011-2070, according to our results. Under the baseline scenario, the program’s net benefits amount to -2,3 billion CVE (approximately -2% of the 2010 GDP).36 Our results are, however, sensitive to both gender distribution and to the INPS enforcement capacity. Indeed, decreasing the impact of the new cohort of women on the system, by setting equal adherence rate for men and women, or halving the current cohort adherence rate, makes the scheme net present benefit positive. This latter assumption lowers the impact of the oldest and wealthier force on the system (the current cohort) that is estimated to leave the scheme completely by the end of 2052.37
The program becomes financially sound, with a positive net present benefit of 2,4 billion CVE, if we withdraw the current cohort from the system. However, even excluding the current cohort the program is still vulnerable to ageing. In fact reducing the length of the contribution to 15 years for women and 20 years for men and raising the life expectancy by 3 and 2 years for women and men, respectively, decreases the scheme revenues to expenditures ratio from 2,72 to 0,69,
35 According to our assumptions on the current employed side, the total women and men joining the system in 2011 are respectively 340 and 206. Thus, for instance, the program total revenues with the female current employed force in 2011 is computed as follow:
10%*[(50,6%*(340*507.744 )+6,2%*(340*557.304)+3,0%*(340*594996)+40,3%*(932.256*340) 36
According to the Central Bank GDP projections (BCV, 2010). Notice that all the figures from now on are in 2010 CVE, unless otherwise stated.
37
Notice that the system internal rate of return (the rate at which the scheme breaks even) hovers 6,85%.
Quartile I Quartile II Quartile III Quartile IV Current Employed Force 507.744 557.304 594.996 932.256 New Cohorts of Employed 338.124 387.684 425.376 762.636
Female 50,6% 6,2% 3,0% 40,3%
Male 48,3% 7,3% 4,6% 39,7%
Notes: Baseline incomes according to the Business Census (INE, 2002). The Baseline incomes for the current cohort force are increased by one standard deviation. The gender distribution is according to our sample on salaried workers (INPS).
18 -200 0 200 400 600 800
2011 2016 2021 2026 2031 2036 2041 2046 2051 2056 2061 2066
Mi ll io n CV E
Scheme Revenues and Expenditures
(2010 CVE) Contribu tions -1000 -750 -500 -250 0 250 500 Mi ll io n CV E
Yearly Cash-Flow at 2010 CVE (2011-2070)
Figure 1: Policy Main Impacts
Source: Own projections.
Nonetheless, the new cohort’s case is resilient to a positive income shock (doubling
the individuals’ earnings). Also, decreasing (halving) the discount rate, to put small
weight on benefits and costs occurring far in the future, does not invert the sign of the scheme net benefit. In turn, halving the pension discount rate (to account for a future decrease on the country’s risk premium, for instance) make the new entrants case unsustainable, as shown in Table 5. Table 5 distinguishes the results for the total self-employed work force from the case considering only the new cohorts, as from 2011.
-10000 -7500 -5000 -2500 0 2500
2,5% 4,5% 6,5% 8,5%
Mi ll io n CV E Discount rates
Scheme Sensitivity to Discount Rates 0 1000 2000 3000 4000 5000 6000
2011 2016 2021 2026 2031 2036 2041 2046 2051 2056 2061 2066
T o ta l Con tri b u to
rs Direct Beneficiaires(stock)
19
Table 5: The Budgetary Impacts of the Self-Employed Social Security Framework (2011-2070)
Notes: Contribution in period t (Ct) = 10% *wage of period t; Pension=80%*10 best wages of last 15 years of contribution.
1
Pension of women=52,5%*10 best wages; pension of men=70%*10 best wages of last 15 years of contribution, according to the law.
𝐶= 𝐶𝑡
1+𝑟 𝑡
𝑇
𝑡=0 ; 𝑃= 𝑈𝑡=𝑇+1 1+𝑃𝑡𝑟 𝑡
Hence, our results strongly suggest that the self-employed social security framework is redistributive across generations, benefiting the first group of contributors. The program is, as well as, redistributive for men to women. Accordingly, being the Cape Verdean women, in general, poorer and more vulnerable than men, we are compelled to state that vertical equity goals, within this target population, are, also, part of the direct objectives of the policy.
7. Conclusions
The Cape Verde public policy that we analyzed in this work project can benefit an important share of the country’s population. The policy benefits especially the poorest self-employed, those who are in an unfavorable position to access a yet underdeveloped financial market; the myopic business owners, who do not save properly, and have to rely on social pension when retired (and potentially face a higher income drop); and the independent female workers, in general.
Including Current Cohort (million CVE)
Equal Halving Discount Income Growth
Scenario Gender proportion Adherence Rate rate =6,5% rate = 0
Present Value of Contributions (C) 6.699,3 10.542,6 5.255,9 4.373,1 5.380,2
Present Value of Expenditures with Pensions (P) 9.038,7 9.517,6 5.220,7 4.587,0 7.524,2
Scheme Net Benefits (C-P) -2.339,4 1.025,0 35,2 -213,9 -2.144,0
Revenues to Expenditures ratio 0,74 1,11 1,01 0,95 0,72
Excluding Current Cohort (million CVE)
Halving Doubling Halving
Scenario Pension Discount Rate Income Discount Rate
Present Value of Contributions (C) 3.812,6 3.812,6 5.454,5 3.842 7.250,6
Present Value of Expenditures with Pensions (P) 1.402,7 4.166,2 3.797,3 5.540,6 4.166,2
Scheme Net Benefits (C-P) 2.409,8 -353,7 1.657,2 -1.698,7 3.084,4
Revenues to Expenditures ratio 2,72 0,92 1,44 0,69 1,74
Baseline
Ageing 1 Baseline
20 According to our results and in the light of the data limitation, the scheme might facea period of budget imbalance, however. The effects of this imbalance on the Cape Verde economy will depend on how it will be financed. We believe that increasing the payroll tax for this special labor force can rise political (for being an unpopular measure) and administrative issues. As every kind of arrangement that relies on tax collection, we expect the self-employed program to generate deadweight loss, by encouraging individuals to adjust their behavior in order to avoid being taxed. Therefore, we presume that enforcement will be challenging for the INPS, which has to estimate as accurately as possible the informal businesses cash-flows, in order to cope with potential under reporting. Hence, a reform that lowers the individuals’ pension expectations is likely to increase the INPS burden in integrating the independent workers.
Considering the case for debt financing (of a temporary shock), provided that the government faces no payment problem (i.e. is not at insolvency risk) and can issue bonds in, relatively, favorable terms, the macroeconomic effects of this debt, given the country exchange rate regime, might be not extremely distressing. 38 Though, the opportunity cost of this funding need, to support social security, can be quite high for a developing country, yet in big need of public investment.39
As a final remark, we believe that success of this welfare state intervention rely significantly on the INPS enforcement capacity, on the soundness of the scheme management and on its proficiency in addressing potential moral hazard problems. Furthermore, we consider that the achievements on the efficiency grounds are important to foster the implicit policy equity goals (namely gender inequality reduction and informal workers social integration).
38 Provided that foreign capital inflows are able to reverse the increasing tendency of the domestic interest rate, or that the central bank has to accommodate the government interventions, so as to prevent the currency nominal appreciation.
39
21 References
Barbosa, António S. Pinto. 1997. Economia Pública. Lisboa: McGraw-Hill.
Barr, N. 1998. The Economics of the Welfare State. Oxford: University Press.
Banco de Cabo Verde. 2006. “Estimação do Produto Potencial para a Economia de Cabo
Verde (1980-2004)”. Boletim Económico, Fevereiro 2006: 22-31.
Banco de Cabo Verde. 2010. “Relatório de Política Monetária”. Praia: BCV.
Behrman, Jere and Barbara Wolfe. 2002. “Labor Force Participation and Earnings
Determinants for Women in the Special Conditions of Developing Countries.” Journal of
Development Economics, 15: 259-288.
Buvinic, Mayra and Geeta Rao Gupta. 1997. “Female-Headed Households and Female- Maintained Families: Are They Worth Targeting to Reduce Poverty in Developing Countries?”Economic Development and Cultural Change, 45: 259-280.
Boardman E. Anthony, David E. Greenberg, Aidan R. Vining, David L. Weimar. 2001.
Cost-Benefit Analysis. Concepts and Practice. New Jersey: Prentice Hall Inc.
Chaabane, Mohamed. 2002. “Towards the Universalization of Social Security: The Experience of Tunisia.” Working Paper No 4. Geneva: International Labour Office.
Direcção Geral da Solidariedade Social. 2007. Estratégia para o Desenvolvimento da
Protecção Social em Cabo Verde. Praia: Ministério do Trabalho, Família e Solidariedade.
Feldstein, Martin and Jefrey B. Liebman. 2002. “Social Security.” In Handbook of Public
Ecnomics, ed. Alan J. Auerbach and Martin Felsdstein, 2245-2315. Amsterdam: Elsevier
Science B.V.
Getler, Mark. 1997. “Government Debt and Social Security in a Life Cycle Economy.”
EconomicResearch Report, 97 (14). New York: New York University.
IEFP. 1997. Inquérito ao Sector Informal. Praia: Instituto de Emprego e Formação Profissional.
IEFP-INE. 2008. Inquérito ao Emprego 2008. Praia: Instituto de Emprego e Formação Profissional.
ILO. 2010. Global Employment Trends. Geneva: International Labour Office.
ILO. 2006. Changing the Paradigm in Social Security: From Fiscal Burden to Investing in
People. Geneva: International Labour Office
INE. 2002. IIº Recenseamento Empresarial. Praia: Instituto Nacional de Estatísticas.
INE. 2008. Projecções Demográficas. Praia: Instituto Nacional de Estatísticas.
22
Lazear, Edward. 1976. “Age, Experience, and Wage Growth.” The American Economic
Review, 66 (4): 548-558.
Lim, Lin Lean. 2002. “Female Labour-Force Participation and Fertility.” Population Bulletin
of The United Nations, 48: 203-213.
Ministério da Qualificação e Emprego. 2008. Estudo/Diagnóstico sobre o Mercado de
Emprego em Cabo Verde. Praia: CESE.
Murdoch, Jonathan. 1999. “Between the Market and State. Can Informal Insurance Patch the Safety Net?” Paper presented at the Stiglitz Summer Research Workshop on Poverty, Washington DC.
OECD. 2009. Pension at a Glance. Public Policies Across OECD Countries. Berlin: Directorate for Employment, Labor and Social Affairs
OIT. 2005. A OIT e a Economia Informal. Lisboa: Escritório da OIT.
Schneider, Friedrich. 2002. “Size and Measurement of the Informal Economy in 110 Countries.” Paper presented at the Workshop of Australian National Tax Centre, Canberra.
Smith, J. D. 1985. “Market Motives in the Informal Economy.” In The Economics of The
Informal Economy, ed. W. Gaertner and A. Wenig, 161-177. Heidelberg: Springer
Publishing Company.
Stiglitz, Joseph E. 2000. Economics of the Public Sector. New York: Northon & Company.
Tablellini, Guido. 2000. “A Positive Theory of Social Security.” Scandinavian Journal of
Economics 102(3): 523-545.
van Ginneken, Vouter. 1999. Social Security for the Excluded Majority: Case Studies of
Developing Countries. Geneva: International Labour Office.
van Ginneken, Vouter. 2003. “Extending Social security: policies for developing countries.”
International Labour Review, 142(3): 277-294.
Willis Robert J. 1986. “Wage Determinants: A survey and reinterpretation of human
capital earnings function.” In Handbook of Labor Economics, ed. O. Ashenfelter and R. Layard, 525-602. Amsterdam: Elsevier Science B.V.
23
Parameter β0 β1 β2 β3 β0 β1 β2 β3 β0 β1 β2 β3 β0 β1 β2 β3 Estimate 8,187 0,077 -0,001 0,133 7,890 0,130 -0,001 -0,033 9,222 0,077 -0,001 -0,004 9,593 0,107 -0,001 0,135 Std Error 0,073 0,004 0,000 0,013 0,089 0,005 0,000 0,013 0,084 0,004 0,000 0,009 0,26 0,014 2E-04 0,034 t-statistics 112,60 18,76 -15,18 10,27 88,17 28,49 -25,04 -2,53 109,7 17,60 -13,19 -0,41 36,23 7,79 -6,07 4,00 p-value 0,000 0,000 0,000 0,000 0,000 0,000 0,000 0,000 0,000 0,000 0,000 0,000 0,000 0,000 0,000 0,000
Pseudo R square 0,021 0,024 0,039 0,048
Quartile I Quartile II Quartile III Quartile IV
Appendix 1. Data Characteristics and Estimation Results
1. Sample Descriptive Statistics
Source: INPS
2. Estimation results of the life –cycle wages
Equation: 𝐿𝑛𝑤𝑎𝑔𝑒𝑖 =𝛽0 +𝛽1𝑎𝑔𝑒𝑖+𝛽2𝑎𝑔𝑒𝑖2+𝛽3𝑔𝑒𝑛𝑑𝑒𝑟
Notes: Regressions run in E-views 6, on the sample of the INPS current contributors with monthly income 8.800 CVE. Number of observations = 35.218
Robust standard errors were used (Huber Sandwich standard errors & covariance).
0 400 800 1,200 1,600 2,000
20 25 30 35 40 45 50 55 60
Series: WOMENAGE Sample 1 21400 Observations 13817 Mean 38.21683 Median 37.00000 Maximum 60.00000 Minimum 18.00000 Std. Dev. 9.367676 Skewness 0.317010 Kurtosis 2.134733 Jarque-Bera 662.4496
Probability 0.000000 0 500 1,000 1,500 2,000 2,500
20 30 40 50 60
Series: AGEMALE Sample 1 21400 Observations 21399 Mean 38.65559 Median 38.00000 Maximum 65.00000 Minimum 17.00000 Std. Dev. 10.02772 Skewness 0.344694 Kurtosis 2.311274 Jarque-Bera 846.6873 Probability 0.000000
0 1,000 2,000 3,000 4,000 5,000
0 100000 200000 300000 400000 500000 600000
Series: WOMENWAGE Sample 1 21400 Observations 13817 Mean 47822.48 Median 38455.00 Maximum 577346.0 Minimum 8800.000 Std. Dev. 38708.08 Skewness 2.677851 Kurtosis 18.69868 Jarque-Bera 158395.9 Probability 0.000000
0 1,000 2,000 3,000 4,000 5,000 6,000 7,000
0 250000 500000 750000 1000000
24 0 200.000 400.000 600.000 800.000 1.000.000 1.200.000 1.400.000 1.600.000 1.800.000
25 35 45 55
y e arl y wag e s (C V E )
Men Life Cycle Earnings (full carrer) 0 200.000 400.000 600.000 800.000 1.000.000 1.200.000 1.400.000 1.600.000 1.800.000
25 35 45 55
y e arl y wag e s (C V E )
Women Life Cycle Earnings (full carrer)
3. The self-employed life cycle income path (for the low, median and high incomes)
Source: Own Estimations
4. Men return on pension contribution: sensitivity analysis for the median income case
Discount rates (r) Life Expectancy (T)
Source: Own Estimations
Notes:
1. P=present value of pension (P). P=Pension* 1
(1+𝑟)𝑡 𝑇−25
𝑡=41 , where
Pension = 𝑤𝜌
10 (1 +𝛽1 +𝛽2((25 +𝑖)
2−(24 +𝑖)2) 𝑗
𝑖=1 34
𝑗=25 ), and ρ=0,8
2. C=present value of contributions.
𝐶=𝑤 (1 + 39𝑗=1 𝑖𝑗=1(1 +𝛽1 +𝛽2((25 +𝑖)2− 24 +𝑖)2 ) , where =0,1 3. r=discount rate, the baseline case discount rate = 3,5%
25
Appendix 2. Cape Verde’ Selected Economic and Financial Indicators
GDP per capita (USD-PPP; 2009) 3.445
Gini Index (2007) 0,47
Population Under Poverty Line 27%
Population Illiterate (2006) 25%
Real GDP Government Disposable Real Savings Private Capital Stock Mkt
growth Budget Income real Rate Openess Capitalization
Rate (%)1 Rate (%)2 Rate (%)3 (% of GDP)4 Deficit (% GDP)5 growth rate 4 (%) 4 Creation (%) 4 (% GDP) 4 (% GDP) 6
1998 8,4 4,4 26,0 -11,0 4,4 6,9 4,6 11,7 n.a
1999 11,9 4,4 25,0 -13,7 7,3 16,3 11,6 15,7 12,2
2000 7,3 -2,4 21,0 -10,9 9,3 9,3 18,7 4,5 9,7
2001 3,3 3,7 19,3 -10,6 5,3 1,5 10,1 14,7 11,9
2002 5,3 1,8 16,2 -11,1 1,8 3,4 11,5 13,0 8,0
2003 4,7 1,2 n.a -11,2 3,9 5,4 12,2 15,4 5,5
2004 5,0 -1,9 n.a -14,4 0,9 3,8 17,0 9,4 14,5
2005 3,6 0,4 n.a -4,1 2,9 6,9 14,7 8,3 10,5 7,0
2006 10,1 4,8 18,3 -7,4 3,7 4,3 6,1 29,9 16,3 18,0
2007 8,6 4,4 n.a -14,7 1,5 1,9 8,2 16,0 17,0 16,0
2008 6,1 6,8 17,8 -12,9 -1,0 -1,0 4,0 29,5 14,1 20,0
2009 4,0 1,0 n.a -10,4 -6,0 -2,4 10,0 12,0 9,5 n.a
Sources:
1 National Statistics Institute from 1998-2007; Central Bank estimates from 2008.
2 National Statistics Institute (www.ine.cv)
3 Employment Institute (www.iefp.cv)
4 Central Bank (www.bcv.cv)
5 Ministry of Finance (www.gov.cv)
6 Cape Verde Stock Market (www.bvcv.cv)
Note: n.a. means not available.
26 Appendix 3. Survey to Informal Workers Results
The survey was carried out in Praia (the Cape Verde's capital), between April 19 and April 24. The methodology used was direct interviews. Notice that the survey aim at validating the empirical strategy used, only. Thus, merely few concerns with the randomization were considered and no major tests were performed in order to validate the results.
Sample Size 10
Gender Distribution
Male 6
Female 4
Activity Sectors
Transport Communications 20%
Construction 20%
Retails 20%
Small Manufacturies 20%
Other Services 20%
Average AGE 39
Average Years of the Business 13
Education Levels
Illiterated 10%
Primary School 30%
Lower Secondary school 40%
Vocational Education 10%
College Degree 10%
Reasons for running the Business
Became unemployed 30%
Never found a formal job 10%
Choose to run the business 50%
Other 10%
Wage (monthly, CVE)
20000-40000 50%
40000-60000 30%
60000-80000 10%
>80000 10%
How often substitute the own business activity for a formal job
Complement the business with a formal Job 10% Frequently, but not in a regular fashion 40%
Never 50%
Social Insurance Protection
INPS Contributors 10%
Knew the 2003's Self-Employed Law 0%
Want to Join INPS 90%
27 Appendix 4. List of Professional Category, as required by the 2003’s
Self-Employed Framework
Profession Yearly Income (CVE)
Source: Government Budget Law of 2003 (Law N0 18/VI/2003)
Notes: This list of professional category is for tax purposes. The yearly incomes refer to the minimum that government takes into account when taxing the services rendered.
Engineers agronomists 1.620
Agrarian engineers-technician 1.620
Architects 1.920
Engineers and engineer-technician 1.920
Civil designers , topographers and constructors 1.500
Painters, sculptors, decorators and others 1.000
Singers, musicians and artists of television 800
Journalists and reporters 800
Economists, auditors and consultants 1.800
Accountants, technician of accounts and keep-books 1.500
Technician and specialists in management of human resources and organization
1.800
Nurses, physiotherapists and massagistas 1.500
Obstetricians, dentists and others 800
Lawyers 1.800
Legal advisors 1.800
Solicitors 800
Dentists, doctors of general clinic 1.800
Doctors of specialty 2.100
Medical veterinarians 1.500
Psychologists 1.350
College Professors 1.200
Teachers 800
Master of sport or crafts 800
Technician of computer science, telecommunications or of information systems
2.100
Official dispatcher 2.100
Commission agents 2.100
Administrators 1.200
Typists and operators of computer science 600