Contents lists available atSciVerse ScienceDirect
Spectrochimica Acta Part A: Molecular and
Biomolecular Spectroscopy
j o u r n a l h o m e p a g e :w w w . e l s e v i e r . c o m / l o c a t e / s a a
Low-temperature Mössbauer study of heterosite, (Fe, Mn)PO
4
Eddy De Grave
a,∗, Geraldo Magela da Costa
b, Antoine Van Alboom
a,c, Robert Emile Vandenberghe
a aDepartment of Physics and Astronomy, University of Ghent, B-9000 Gent, BelgiumbDepartamento de Química, Universidade Federal de Ouro Preto, 35400-000, Ouro Preto (MG), Brazil cFaculty of Applied Engineering Sciences, University College Gent, B-9000 Gent, Belgium
a r t i c l e
i n f o
Article history:
Received 29 October 2011
Received in revised form 18 April 2012 Accepted 3 May 2012
Keywords:
Mössbauer spectroscopy Heterosite
Magnetic hyperfine field Isomer shift
a b s t r a c t
The heterosite phase occurring in a pegmatitic rock sample was characterized by X-ray diffraction, by energy-dispersive X-ray spectroscopy and by Mössbauer spectroscopy. The orthorhombic unit-cell parameters, expressed in ˚A, were found asa= 9.733 (1),b= 5.837 (1) andc= 4.776 (1). The composition was determined to be (Fe0.54Mn0.43Mg0.04)PO4. Mössbauer spectra recorded at temperaturesTof 65 K and higher consist of two broadened quadrupole doublets. Their isomer shiftsıare both diagnostic for the ferric state. The dominant doublet (∼60% of total area) exhibits an average quadrupole splittingEQ,av of 1.62 mm/s at room temperature, while the weaker broader doublet hasEQ,av= 0.68 mm/s. For tem-peraturesT≤60 K the spectra are composed of a broad sextet and a central quadrupole doublet. The doublet persists down to the lowest applied temperature of 17 K. It is concluded that this doublet is due to an Fe-bearing phase other than heterosite and which gives rise to the inner doublet appearing in the spectra recorded atT≥65 K. The broad sextets, attributable to the heterosite phase, were fitted with model-independent hyperfine-field distributions. However, it was consistently experienced that using the common Lorentzian-shaped elementary sextets composing the distribution, could not adequately reproduce the observed line shapes. Instead, the calculations had to be based on the diagonalization of the complete hyperfine-interaction Hamiltonian. This is due to the unusually strong quadrupole inter-action. The as-such calculated hyperfine parameters of the heterosite phase at 17 K may be summarized as follows: maximum-probability hyperfine fieldBhf,m= 473 kOe, isomer shiftıFe= 0.54 mm/s, average quadrupole coupling constant ½e2qQ= 1.50 mm/s, asymmetry parameter of the EFG= 0.80, and polar angles of the hyperfine field with respect to the EFGs principal axes frame˝= 40◦and= 90◦. The tem-perature variation of the hyperfine field was interpreted in terms of the Bean–Rodbell (BR) model. The BR parameter,BR, was found to be 0.90, indicating a first-order magnetic transition atTN= 59.7 K. The tem-perature variation of the isomer shift is explained by the second-order Doppler shiftıSOD. Using the Debye model for the lattice vibrational spectrum for calculatingıSOD, the characteristic Mössbauer temperature
Mwas found to be 400 K, which is unusually low for a ferric compound.
© 2012 Elsevier B.V. All rights reserved.
1. Introduction
The mineral heterosite, (Fe3+,Mn3+)PO
4, is an iron-rich member
of the solid solution series heterosite – purpurite, FePO4– MnPO4. It
is usually found as a constituent in pegmatitic rocks. The structure of a heterosite species with composition Fe0.65Mn0.35PO4has been
refined by Eventoff et al.[1]. It is of the orthorhombic olivine-type with Fe3+and Mn3+occupying strongly distorted corner-sharing
octahedral M2 sites, which form zigzag chains running parallel to thec-axis. A second type of edge-sharing octahedral sites, M1, forms linear chains that are also directed along the c-axis. In
∗Corresponding author at: Department of Physics and Astronomy, University of
Ghent, Proeftuinstraat 86, B-9000 Gent, Belgium. Tel.: +32 09 264 6566; fax: +32 09 264 6697.
E-mail address:eddy.degrave@Ugent.be(E. De Grave).
isostructural triphylite, Li+Fe2+PO
4, these M1 sites are occupied
by Li+ cations, while in heterosite-purpurite solid solutions they
are vacant. Each M2O6octahedron shares edges with two M1O6
octahedra and one PO4tetrahedron, and each M1O6has common
edges with two other M1O6octahedra, with two M2O6octahedra
and with two PO4tetrahedra. For an illustrative polyhedral view of
the triphylite structure, the reader is referred to a recent report by Van Alboom et al.[2].
It is well known that57Fe Mössbauer spectroscopy is a
pow-erful experimental technique, allowing to determine a variety of structural, electronic and magnetic properties of Fe atoms/cations present in solid materials. In that respect, the most complete infor-mation is obtained by studying the temperature dependence of the hyperfine parameters that are extracted from the Mössbauer spectra.
Mössbauer spectra recorded at room temperature (RT) for het-erosites, both synthetic and natural species, have been reported
by a number of authors[3–6]. Recently, Aldon et al.[7]presented the results of a Mössbauer study of a synthetic FePO4sample at
seven different temperatures in the range between 141 K and 301 K with the aim to evaluate the recoilless fraction of the material, the knowledge of which is useful for the estimation of the relative amount of FePO4formed during Li extraction or insertion processes
involving LiyFePO4(0≤y≤1) systems. In the present contribution, the authors describe the results of their Mössbauer measurements carried out at many different temperatures between 15 K and 295 K for a natural heterosite species. The emphasis of this work was put towards the magnetic spectra (T< 60 K). As far as could be traced such spectra for heterosite have so far not been reported in the literature.
2. Experimental
The heterosite sample was obtained from a private collection in the shape of a rock piece measuring a few cm2across. It had been
sampled from the Buranga pegmatite rock, Rwanda[8]. Crushed smaller pieces were finely ground in an agate mortar and the result-ing powder was used for the subsequent measurements.
Powder X-ray diffraction (XRD) patterns were recorded with a Shimadzu XRD-6000 diffractometer using FeK␣radiation and a
graphite monochromator. The 2range between 5◦ and 70◦was scanned at a speed of 0.5◦/min. Silicon was added to the sample powder as an internal standard. Unit-cell parameters were calcu-lated by least-squares refinement after subtracting the background and the K␣2contribution and using intensity and angular weighting
of the most intense peaks.
Microprobe analyses were carried out with a Jeol microscope, model JXA 8900R, equipped with a Noran EDS system and operating at (20 kV, 25 nA). A distinct well-developed crystallite, selected on the basis of the SEM observations, was probed at 20 different spots. Counting times were 10–100 s. Apatite, fayalite and rhodonite stan-dards were used for the determinations of P (and Ca), Fe and Mn, respectively.
The Mössbauer spectra were collected in transmission geome-try with WissEl time-mode spectrometers using triangular source motions and57Co(Rh) sources. All isomer shift values quoted
here-after are relative to␣-Fe at RT. The spectrometers, being of excellent linearity, were calibrated using Fe foil or standard␣-Fe2O3powder
depending on the applied velocity scale. The absorber-thickness was approximately 6 mg Fe per cm2 and counts were
accumu-lated in 1024 channels. The velocity increment per channel was
∼0.042 mm/s forT≤54 K (magnetic spectra) and∼0.016 mm/s for
T≥65 K (paramagnetic spectra). Final off-resonance counts were typically∼106per channel. The temperature of the absorber was
varied within the range 15–295 K using standard commercial cryo-genic equipment. All spectra were collected with the absorber plane perpendicular with respect to the incident␥-ray beam because no asymmetry in the line intensities was observed from the spectra in the paramagnetic region, and hence texture effects were not occurring.
3. Results
3.1. Characterization
All peaks detected in the XRD pattern could be assigned to the orthorhombic structure of heterosite. Indexed in thePmnbspace group the unit-cell parameters, expressed in ˚A, were found as
a= 9.733 (1),b= 5.837 (1) andc= 4.776 (1). These parameters are in agreement with those reported in the literature for a sample with composition Fe0.65Mn0.35PO4, i.e.,a= 9.79 ˚A,b= 5.83 ˚A andc= 4.77 ˚A [1]. The somewhat lower value forafor the present heterosite phase
3 2
1 0
-1 -2
-3
Velocity (mm/s)
86 88 90 92 94 96 98 100
Transmission (%)
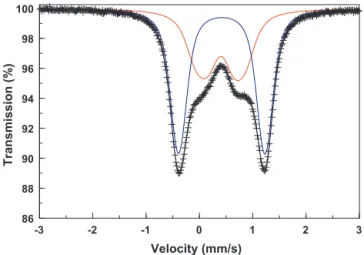
Fig. 1.Room temperature Mössbauer spectrum of the heterosite-containing rock sample from Buranga, Rwanda. Solid lines are the adjusted components and their superposition as calculated in terms of two model-independent quadrupole-splitting distributions. The sharp outer doublet is due to the heterosite phase.
might be related to the higher Mn3+content (see hereafter) for this
sample as compared to the sample considered by the authors of Ref. [1], Mn3+(ionic radius 0.61 ˚A) being smaller than Fe3+(0.64 ˚A) and
causing distortions of the M2 octahedra as a result of its Jahn–Teller activity.
The elemental contents measured at the different spots probed by the electron beam were found to be remarkably uniform and indicate a chemical composition of (Fe0.54Mn0.43Mg0.03)PO4, with
subordinate traces of Na, K, Ca and Al. It is expected that the small concentration of Mg in the sample does not significantly affect the results obtained from Mössbauer spectroscopy.
3.2. Mössbauer spectra
A typical Mössbauer spectrum as observed at all applied tem-peraturesT≥65 K is reproduced inFig. 1. Clearly, the spectrum consists of a broad inner doublet and a narrower outer doublet. These high-temperature, or paramagnetic, spectra were fitted in terms of a superposition of two unconstraint model-independent quadrupole-splitting distributions (QSD)[9]. The isomer shifts and the characteristics of the evaluated QSD profiles for the high-EQ
component at different temperatures are listed inTable 1. Consis-tently, these profiles are almost perfectly symmetric as evidenced by the observation that their maximum-probability values,EQ,m,
are very close to their respective average values,EQ,av, the mean
Table 1
Mössbauer parameters at various temperaturesTof the heterosite component as
obtained from fitting the spectra with a superposition of two model-independent quadrupole-splitting distributions.
T(K) ıa(mm/s) EQ,mb(mm/s) EQ,avc(mm/s) d(mm/s) RAe
85 0.524 1.632 1.619 0.17 0.59
105 0.517 1.638 1.629 0.18 0.58
125 0.509 1.649 1.640 0.20 0.56
155 0.496 1.631 1.630 0.17 0.59
180 0.483 1.645 1.617 0.16 0.62
204 0.470 1.617 1.636 0.18 0.58
222 0.456 1.658 1.638 0.20 0.60
252 0.441 1.648 1.642 0.19 0.58
277 0.426 1.661 1.637 0.19 0.60
295 0.413 1.626 1.625 0.16 0.63
aIsomer shift versus␣-Fe at room temperature (estimated error:±0.005 mm/s).
bMaximum-probability quadrupole splitting (estimated error:±0.015 mm/s).
c Average quadrupole splitting (estimated error:±0.02 mm/s).
dSecond-order moment (estimated error:±0.015 mm/s).
96 97 98 99 100
Transmission (%)
10 8 6 4 2 0 -2 -4 -6 -8 -10
Velocity (mm/s)
94 95 96 97 98 99 100
Transmission (%)
17 K
40 K
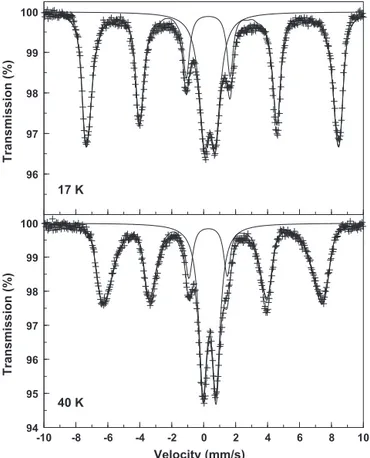
Fig. 2.Mössbauer spectra recorded at 17 K and 40 K of the heterosite-containing rock sample from Buranga, Rwanda. Solid lines are the adjusted components and their superposition. The sextet component is due to the heterosite phase and was fitted with a model-independent hyperfine field distribution.
difference being only∼0.02 mm/s. Within experimental error lim-its, the quadrupole splitting is constant with temperature and its magnitude is unusually high for a ferric state.
In sharp contrast with the results for the high-EQcomponents,
the QSD profiles obtained for the low-EQ components exhibit
strong asymmetry with a long tail spreading towards the higher values in the distributions. The average valuesEQ,avare randomly
scattered within the range 0.71±0.03 mm/s and the relative contri-bution to the total spectral area varies within the range (40±3)%. The isomer shiftıis 0.39 mm/s at RT and 0.51 mm/s at 80 K. As discussed and argued in Section4, the low-EQcomponent is not
due to Fe3+cations in the heterosite structure, but to ferric cations
that are present in some admixed Fe3+-bearing mineral species. As
the low- and high-EQsubspectra are well resolved, the presence
of the admixed phase has no significant effect whatsoever on the Mössbauer parameters of the heterosite spectral contribution.
Two example Mössbauer spectra recorded at relatively low tem-peratures (T< 60 K) are presented inFig. 2. Typically, the spectra in this low-temperature region are composed of a broad dou-blet superimposed on a broadened sextet, the width of the latter increasing with increasing temperature. Attempts to fit the spectra with a superposition of a model-independent ferric hyperfine-field distribution and a single quadrupole doublet failed in that the line shape of the sextet contributions could not be reproduced ade-quately, showing consistent and unacceptable misfits for all six absorption lines. The reason for this failure was found to be the large value of the quadrupole splitting of the magnetic component, reflecting the feature that the quadrupole interaction cannot be considered as a perturbation on the magnetic interaction. In such a case a magnetic subspectrum, either appearing as a single sextet or as an elemental sextet in a hyperfine-field distribution, cannot be
Table 2
Mössbauer parameters at various temperaturesTof the heterosite phase as obtained
from fitting the spectra with a superposition of a central quadrupole doublet and a model-independent hyperfine-field distribution.
T(K) ıa(mm/s) Bhf,mb(kOe) ½e2qQc(mm/s) d ˝e(◦) f(◦) RAg
17 0.543 473 1.50 0.79 40 93 0.67
20 0.540 463 1.46 0.78 40 89 0.66
25 0.536 457 1.48 0.83 40 91 0.66
29 0.534 445 1.49 0.70 41 90 0.65
35 0.537 441 1.50 0.79 40 94 0.64
40 0.529 401 1.52 0.93 40 68 0.63
46 0.534 375 1.58 0.95 41 60 0.62
49 0.536 359 1.57 0.88 42 59 0.60
54 0.546 303 1.54 0.84 43 55 0.58
57 0.589 250 1.50 0.79 43 60 0.55
aIsomer shift versus␣-Fe at room temperature (estimated error:±0.01 mm/s).
bMaximum-probability hyperfine field (estimated error:±3 kOe).
c (Average) quadrupole coupling constant (estimated error:±0.03 mm/s).
d Asymmetry parameter of the electric field gradient EFG (estimated error:±0.05).
eZenithal angle of the hyperfine field in the EFG (x,y,z)-axes frame (estimated
error:±5◦).
f Azimuthal angle of the hyperfine field in the EFG (x,y,z)-axes frame (estimated
error:±15◦).
gRelative spectral area (estimated error:±0.02).
approximated by a summation of six Lorentzian lines of which the positions
v
0,iare linear functions of the hyperfine parametersı (iso-mer shift),εQ(quadrupole shift, related to the quadrupole splittingEQ) andBhf(the magnetic hyperfine field):
v
0,i=ı+˛iεQ+ˇiBhf,i= 1,. . .,6[9]. Instead, the numerical analyses has to be based on the complete hyperfine-interaction Hamiltonian, the diagonalization of which allows the calculation of the energies and probabilities of the eight transitions between the sublevels of the nuclear ground state and those of the first excited state of57Fe[10,11]. This
proce-dure is seldom to be used in the case of Fe3+magnetic spectra, but
is commonly required in the case of Fe2+.
The solid lines in Fig. 2 represent the two components (doublet + sextet) and their superposition as fitted to the exper-imental data. For the doublet contribution a single quadrupole doublet was considered, while for the magnetic component a model-independent hyperfine-field distribution was modelled. The quadrupole splitting of the doublet was fitted at a value scattered in the range 0.75±0.05 mm/s for all 10-recorded low-temperature spectra. For the magnetic component the following parameters had to be adjusted: isomer shiftı, quadrupole coupling constant ½e2qQ,
asymmetry parameter of the electric field gradient (EFG), the polar angles˝and of the direction of the hyperfine field in the principal axes frame of the EFG (see Fig. 4 in Ref.[2]) and the relative spectral areaRA. The obtained values for these parameters are listed inTable 2for the various temperatures applied in this study. It may be reminded at this point that the relation between the quadrupole coupling constant and the quadrupole splittingEQas reflected in
a paramagnetic doublet spectrum is given by:
EQ=
1 2(eq)(eQ)
1+ 2
3, (1)
witheQthe nuclear quadrupole moment andeq(orVzz) the princi-pal component of the EFG. Further, the asymmetry parameteris defined by=|Vxx−Vyy|/Vzz, withViithe diagonal elements of the EFG tensor so organized thatVzz>Vxx≥Vyy.
4. Discussion
that type of iron site is not part of the heterosite structure and thus this finding suggests that the sample used for this study is not a pure heterosite species. One could argue that there may occur het-erosite species for which for some reason part of the cations have entered the M1 sites in the structure. However, if this were true the M1 cations would take part in the magnetic ordering and give rise to a second sextet component in the low-temperature Möss-bauer spectra. It is therefore concluded that the low-EQdoublet is
due to an iron-bearing impurity phase. Since the XRD pattern does not show the presence of a significant amount of a second phase beside heterosite, it is suggested that the impurity phase is amor-phous. This suggestion is consistent with the values of the observed very broad distribution of the quadrupole splitting. The presence of the impurity spectral component does not interfere with the het-erosite subspectrum in the sense that the characteristic Mössbauer parameters of the latter are well resolved and their determina-tion not obscured. This means that the present Mössbauer results are useful and valuable for deriving some basic properties of the mineral heterosite. It should be noted at this point that the occur-rence of amorphous manganese-iron phosphate has been reported for other pegmatite rocks[12]. Also, Fransolet[13]has frequently noticed, under the petrographic microscope, that an isotropic min-eral occurs in heterosite specimens, including those of the Buranga mine. He concludes that this mineral is an amorphous phosphate rich in Fe.
FromTables 1 and 2, and considering Eq.(1), it is noticed that the values of the quantity 1/2e2qQobtained from the low-temperature
spectra and those of the quadrupole splitting,EQ,mor EQ,av,
derived from the high-temperature spectra are reasonably well in line. The results further indicate that the quadrupole interac-tion is nearly invariant with temperature, which is a common feature for Fe3+compounds. Yamada and Chung[4]examined the
RT Mössbauer spectra for synthetic solid solutions MnyFe1−yPO4.
They found a clear linear correlation between the quadrupole split-tingEQand the Mn contenty. According to this correlation, the
presently observed EQ value of 1.625 mm/s for the heterosite
phase (Table 1,T= 295 K) corresponds to an Mn content ofy≈0.40, which is in reasonable agreement with the earlier derived compo-sition (Section3).
The existence of a distribution of hyperfine field values for the heterosite phase is explained by the non-ordered distribution of the Fe3+and Mn3+cations among the M2 sites. This feature implies that
the local cation environment of the probe iron nuclei is not uniform and that consequently the molecular field, and hence the strength of the hyperfine field, acting at the57Fe probes differ from one site
to the other. It is quite possible that also the direction of the mag-netic hyperfine field is not unique. The values obtained for the polar angles are therefore to be considered as average values. It might be that the assumption of one single value for the angle˝explains the minor, but consistent misfits of the calculated line shapes, in par-ticular in the velocity range of the fifth absorption lines (seeFig. 2). The second polar angle () in general has only a weak influence on the obtained theoretical line shape. It is therefore not conclu-sive whether the sudden drop from≈90◦ to≈60◦observed at temperatures around 40 K is real. On the other hand, the angle ˝between the hyperfine field and the EFGs principal axis is usu-ally rather well defined. The obtained results show that in the case of heterosite˝does not change with temperature and remains at
∼40◦. The orientation of the hyperfine field with respect to the crys-tallographic axes of the orthorhombic unit cell, however, cannot be inferred from the present data concerning the polar angles.
The temperature variation of the maximum-probability hyper-fine field,Bhf(T), is presented inFig. 3and has been interpreted by the model developed by Bean and Rodbell[14]. This model is based on the classical molecular field concept[15], but addition-ally takes into account that the strength of the magnetic exchange
60 50 40 30 20 10 0 0 100 200 300 400 500
Bhf
(kO
e
)
T (K)
Fig. 3.Temperature variation of the hyperfine fieldBhfof heterosite. Solid line was
calculated in terms of the Bean–Rodbell model. Theerror barsare approximately
half the size of the curve symbols.
interactions varies within the magnetically ordered regime as a result of magnetostriction. This effect is thought to be especially important when deformable lattices are concerned. Due to this magnetostriction effect, the inter-atomic distances change with changing sublattice magnetization, and consequently the strength of the magnetic interactions also change.
In terms of the Bean–Rodbell model,Bhf(T) follows a Brillouin
behaviour described by:
Bhf(T)=Bhf(0)×BS(x) (2)
withBhf(0) the saturation value,BS(x) the Brillouin function for magnetic spin momentS(S= 5/2 for Fe3+) and with argumentx
given by:
x=
2a+4bB
2 hf(T)
B2 hf(0)
BR
TNT Bhf(T)
Bhf(0)
, (3)
with
a= 3S
2(S+1) (4)
and
b= 9[(2S+1) 4
−1]
20[2(S+1)]4 (5)
In Eq.(3), the quantityBR is a measure for the departure from
an ideal second-order magnetic transition. Its value is generally structure-related and basically determined by the compressibility of the lattice and, as a consequence, of the deformation of the lat-tice on reaching the magnetic transition[14]. In case of an ideal second-order transition the value forBR equals zero (rigid
lat-tice) and the variation ofBhf(T) then follows the classical Brillouin
curve. Values forBR exceeding 1 indicate first-order transitions,
and values in between 0 and 1 are to be considered as intermediate-ordertransitions for which the transition phenomena are not well understood.
The solid curve in Fig. 1 shows the calculated temperature dependence of the hyperfine field. It is the result of recursive cal-culations embedded in a least-squares iteration routine in which BR,Bhf(0) andTNwere adjustable parameters. Their values were
iterated as 0.90, 479 kOe and 59.7 K, respectively. The agreement between the calculated and observed temperature variations is obviously satisfactory. The value forBRof 0.90 infers that the
mag-netic transition in heterosite is close to a first-order transition. It should be mentioned at this point that similar features regarding theBhf(T) variations have recently been noticed by some of the
Fig. 4.Temperature variation of the isomer shiftıof heterosite. Solid line is the the-oretical variation as obtained by applying the Debye model for the lattice vibrational spectrum to calculate the second-order Doppler shift as a function of temperature.
The shownerror barrefers to the low-temperature data (T< 60 K). For the
high-temperature data theerror barsare approximately half of that.
octahedral sites in a synthetic leucophosphite sample[16] and for the ferrous hyperfine field in a synthetic szomolnokite [17] and in a synthetic triphylite[2], yielding values forBR of 0.63,
0.74 and 0.97, respectively. It is not clear whether the difference inBR values for all these materials can be related to structural
or cationic charge differences. More quantitative data about the minerals, such as compressibility, fractional volume change at the magnetic transition temperature, slope of the variation of the tran-sition temperature with the lattice volume, etc. should be known in order to allow an at least qualitative interpretation of obtained BRparameters.
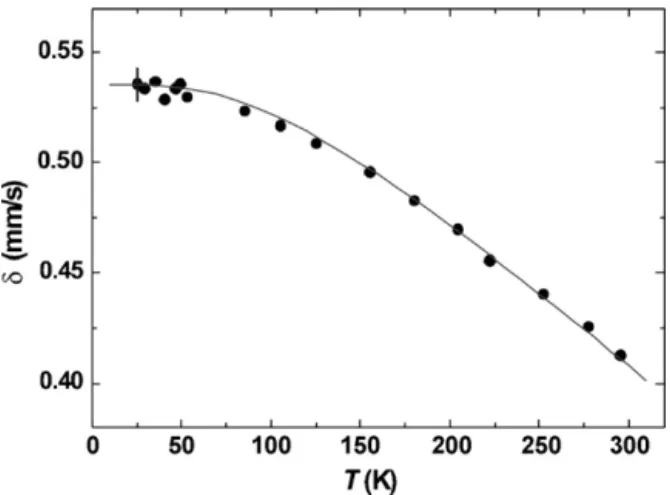
The temperature dependence of the isomer shiftıis plotted in Fig. 4. The data have been interpreted on the basis of the expression: ı(T) =ıI+ıSOD. The intrinsic isomer shiftıIis determined by the
s-electron density at the nucleus and in a first approximation exhibits a linear temperature variation:ıI(T) =ıI(0) +˛×10−5T. This weak
variation, however, has only significant effect onı(T) when data at temperatures far exceeding RT are involved. In contrast, the second-order Doppler shift,ıSOD, is strongly dependent on
temper-ature, being related to the vibrational properties of the probe nuclei
in the crystal structure. The Debye approximation for the lattice vibrational spectrum provides an adequate model for calculating ıSOD[18,19]. It contains one parameter, the so-called
characteris-tic Mössbauer temperature,M, the value of which is obtained by
adjusting the theoretical expression forı(T) to the experimental values. The solid curve inFig. 4represents the calculated temper-ature variation withıI= (0.64±0.01) mm/s andM= (400±20) K. This latter value does not fit the general tendency that ferric Möss-bauer temperatures are close to or exceeding 500 K, while ferrous species commonly exhibit values close to 400 K[18,19]. It is tempt-ing to ascribe the low value ofMfor heterosite to the defect nature
of its structure. That suggestion, however, remains speculative. For the aforementioned reason, the thermal coefficient˛could not be determined. The value ofıIwas found to be 0.64 mm/s.
References
[1] W. Eventoff, R. Martin, D.R. Peacor, American Mineralogist 57 (1972) 45–51.
[2] A. Van Alboom, E. De Grave, M. Wohlfahrt-Mehrens, American Mineralogist 96 (2011) 408–416.
[3] A.S. Andersson, B. Kalska, L. Häggström, J.O. Thomas, Solid State Ionics 130 (2000) 41–52.
[4] A. Yamada, S.C. Chung, Journal of the Electrochemical Society 148 (2001) A960–A967.
[5] H.J. Tan, J.L. Dodd, B. Fultz, Journal of Physical Chemistry C 113 (2009) 2526–2531.
[6] Th. Fehr, R. Hochleitner, A. Laumann, E. Schmidbauer, J. Schneider, Physics and Chemistry of Minerals 37 (2010) 179–189.
[7] L. Aldon, A. Perea, M. Womes, C.M. Ionica-Bousquet, J.-C. Jumas, Journal of Solid State Chemistry 183 (2010) 218–222.
[8] V.D.C. Daltry, O. von Knorring, Geologica Belgica 1 (1998) 9–15.
[9] R.E. Vandenberghe, E. De Grave, P.M.A. de Bakker, Hyperfine Interactions 83 (1994) 29–49.
[10] W. Kündig, Nuclear Instruments and Methods in Physics Research 48 (1967) 219–228.
[11] G.R. Hoy, S. Chandra, Journal of Chemical Physics 47 (1967) 961–965. [12] M.J. Gallagher, Mineralogical Magazine 36 (1967) 50–59.
[13] A.-M. Fransolet, private communication.
[14] C.P. Bean, D.S. Rodbell, Physical Review 126 (1962) 104–115.
[15] A.H. Morrish, The Physical Principles of Magnetism, Wiley, New York, 1965. [16] V.G. de Resende, G.M. da Costa, E. De Grave, A. Van Alboom, American
Miner-alogist 93 (2008) 483–487.
[17] A. Van Alboom, E. De Grave, V.G. de Resende, J.A.M. Gómez, Journal of Molecular Structure 924 (2009) 448–456.
[18] E. De Grave, A. Van Alboom, Physics and Chemistry of Minerals 18 (1991) 337–342.