BGD
8, 1137–1167, 2011East Siberian Sea, an arctic region of very high biogeochemical
activity
L. G. Anderson et al.
Title Page
Abstract Introduction
Conclusions References
Tables Figures
◭ ◮
◭ ◮
Back Close
Full Screen / Esc
Printer-friendly Version
Interactive Discussion
Discussion
P
a
per
|
Dis
cussion
P
a
per
|
Discussion
P
a
per
|
Discussio
n
P
a
per
|
Biogeosciences Discuss., 8, 1137–1167, 2011 www.biogeosciences-discuss.net/8/1137/2011/ doi:10.5194/bgd-8-1137-2011
© Author(s) 2011. CC Attribution 3.0 License.
Biogeosciences Discussions
This discussion paper is/has been under review for the journal Biogeosciences (BG). Please refer to the corresponding final paper in BG if available.
East Siberian Sea, an arctic region of very
high biogeochemical activity
L. G. Anderson1, G. Bj ¨ork2, S. Jutterstr ¨om1,3, I. Pipko4, N. Shakhova4,5, I. P. Semiletov4,5, and I. W ˚ahlstr ¨om1
1
Department of Chemistry, University of Gothenburg, Sweden
2
Department of Geosciences, University of Gothenburg, Sweden
3
Bjerknes Centre for Climate Research, UNIFOB AS, Bergen, Norway
4
Pacific Oceanological Institute FEB RAS, Vladivostok, Russia
5
International Arctic Research Center/University Alaska, Fairbanks, USA
Received: 18 January 2011 – Accepted: 19 January 2011 – Published: 8 February 2011 Correspondence to: L. G. Anderson (leifand@chem.gu.se)
BGD
8, 1137–1167, 2011East Siberian Sea, an arctic region of very high biogeochemical
activity
L. G. Anderson et al.
Title Page
Abstract Introduction
Conclusions References
Tables Figures
◭ ◮
◭ ◮
Back Close
Full Screen / Esc
Printer-friendly Version
Interactive Discussion
Discussion
P
a
per
|
Dis
cussion
P
a
per
|
Discussion
P
a
per
|
Discussio
n
P
a
per
Abstract
Shelf seas are among the most active biogeochemical marine environments and the East Siberian Sea is a prime example. This sea is supplied by seawater from both the Atlantic and Pacific Oceans and has a substantial input of river runoff. All of these waters contribute chemical constituents, dissolved and particulate, but of different sig-5
natures. Sea ice formation during the winter season and melting in the summer has a major impact on physical as well as biochemical conditions. The internal circulation and water mass distribution is significantly influenced by the atmospheric pressure field. The western region is dominated by input of river runofffrom the Laptev Sea and an extensive input of terrestrial organic matter. The microbial decay of this organic matter 10
produces carbon dioxide (CO2) over-saturating all waters from the surface to the bottom relative to atmospheric values, even if the nutrient concentrations of the surface waters showed recent primary production. The eastern surface waters were under-saturated with respect to CO2 illustrating the dominance of marine primary production. The drawdown of dissolved inorganic carbon equals a primary production of∼1 mol C m−2, 15
which when multiplied by half the area of the East Siberian Sea,∼500 000 km2, results
in an annual primary production of 0.5×10¹²mol C or 6×10¹²gC. Even though mi-crobial decay occurs through much of the water column it dominates at the sediment surface where the majority of organic matter ends up, and most of the decay products are added to the bottom water. High nutrient concentrations and fugacity of CO2 and 20
low oxygen and pH were observed in the bottom waters. Another signature of organic matter decomposition, methane (CH4), was observed in very high but variable con-centrations. This is due to its seabed sources of glacial origin or modern production from ancient organic matter, becoming available due to sub-sea permafrost thaw and formation of so-called taliks (layers of thawed sediments within the permafrost body). 25
BGD
8, 1137–1167, 2011East Siberian Sea, an arctic region of very high biogeochemical
activity
L. G. Anderson et al.
Title Page
Abstract Introduction
Conclusions References
Tables Figures
◭ ◮
◭ ◮
Back Close
Full Screen / Esc
Printer-friendly Version
Interactive Discussion
Discussion
P
a
per
|
Dis
cussion
P
a
per
|
Discussion
P
a
per
|
Discussio
n
P
a
per
|
natural ocean acidification making the saturation state of calcium carbonate low, re-sulting in under-saturation of all the bottom waters with respect to aragonite and large areas of under-saturation down to 50% with respect to calcite. Hence, conditions for calcifying organisms are very unfavorable.
1 Introduction
5
The East Siberian Sea (ESS) is the widest of the Arctic Ocean shelf seas, with an area of 895×103km2, but as the mean depth is only 52 m it has the smallest volume after
the Chukchi Sea (Jakobsson, 2002). From a hydrographic point it is a transit area with seawater of Pacific origin entering from the east and water of Atlantic origin entering from the west. However, especially the latter waters have been heavily diluted by river 10
runoff(mainly from the Lena river) before entering the ESS. River runoffis also added directly into the ESS, where the major rivers are the Indigirka and the Kolyma with mean annual discharges of 50.6 km3 for the period 1936–1998 and 102.7 km3 for the period 1978–2000, respectively (http://rims.unh.edu/).
The fresh water content of the ESS is high, especially in the western area (Steele 15
and Ermold, 2004), but its momentary spatial distribution is largely dependent on the wind and is controlled by the atmospheric pressure pattern. There is a clear tendency of having less fresh water in the eastern part during summers with dominant high pres-sure in the central Arctic (anticyclonic circulation) and vice versa for the low prespres-sure situation (cyclonic circulation) (Dmitrenko et al., 2005; Dmitrenko et al., 2008). Signifi-20
cant long term changes of the freshwater content as seen in the historical data record has been explained by variations in river discharge combined with changes in the at-mospheric circulation (Polyakov et al., 2008). The sea ice motion is also affected by the wind pattern resulting in that the ice generally moves in the wind direction except within a near shore zone during winter with stationary land fast ice (Morris et al., 1999; Holt 25
BGD
8, 1137–1167, 2011East Siberian Sea, an arctic region of very high biogeochemical
activity
L. G. Anderson et al.
Title Page
Abstract Introduction
Conclusions References
Tables Figures
◭ ◮
◭ ◮
Back Close
Full Screen / Esc
Printer-friendly Version
Interactive Discussion
Discussion
P
a
per
|
Dis
cussion
P
a
per
|
Discussion
P
a
per
|
Discussio
n
P
a
per
the ESS. From being an area largely ice covered even in the summer it has changed to a largely ice free area (Nghiem et al., 2006; Kwok et al., 2009).
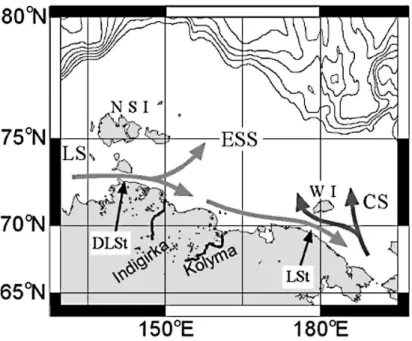
The current system in the ESS is controlled both by the strong baroclinic forcing by river runoffand by wind. The river runoffpromotes development of the fresh Siberian Coastal Current (SCC) following the coast from the west to the east (e.g. Weingartner 5
et al., 1999). However, the wind forcing has a strong impact on the current system which makes the ESS highly variable. The SCC was focused as a narrow jet along the coast under cyclonic atmospheric conditions in the summer-fall of 2003, while in 2004, with anticyclonic atmospheric circulation it was less confined as reported by (Savel’eva et al., 2008) and was not present at all in the Chukchi Sea east of ESS (Weingartner et 10
al., 1999). The SCC often extends all the way into the Chukchi Sea, where it mixes with the northward flow from the Bering Strait. Between the SCC and the Wrangel Island seawater from the Chukchi Sea, with its high nutrient signature, enters the ESS (e.g. Codispoti and Richards, 1968). A map of the ESS with the most common current field is illustrated in Fig. 1.
15
The temperature is generally close to the freezing point over the entire water column during winter as a result of surface cooling and ice formation. During summer the temperature raises to several degrees above zero near the surface in ice free areas. The bottom layer may well be affected by intrusions of warmer Atlantic water coming from the shelf slope during upwelling conditions (Dmitrenko et al., 2010).
20
The information on the biogeochemical environment of the ESS is limited, but some studies have been performed along the coast. Codispoti and Richards (1968) con-cluded that the nutrient distribution was impacted by summer primary production, res-piration of organic matter and the origin of the high salinity bottom water. Based on the high nutrient concentrations, mainly phosphate, they suggested that inflow from the 25
BGD
8, 1137–1167, 2011East Siberian Sea, an arctic region of very high biogeochemical
activity
L. G. Anderson et al.
Title Page
Abstract Introduction
Conclusions References
Tables Figures
◭ ◮
◭ ◮
Back Close
Full Screen / Esc
Printer-friendly Version
Interactive Discussion
Discussion
P
a
per
|
Dis
cussion
P
a
per
|
Discussion
P
a
per
|
Discussio
n
P
a
per
|
Lena River input from the Laptev Sea and the Eastern area is under direct influence of Pacific derived water. Furthermore the waters in the western near shore zone of the ESS has been shown to be a strong source of atmospheric CO2, possibly increasing due to added input of terrestrial organic matter from permafrost thawing (Pipko et al., 2005, 2008; Semiletov et al., 2007; Anderson et al., 2009).
5
In the summer of 2008 (15 August to 26 September) the International Siberian Shelf Study (ISSS-08) was conducted with the objective to investigate the flux and transfor-mation of carbon from land over the shelf seas and into the deep central basins of the Arctic Ocean. An extensive sampling program was undertaken on board the Russian vessel Yacob Smirnitskyi in the waters of the Laptev, East Siberian and Chukchi Seas. 10
This study of the East Siberian Sea is by far the most comprehensive collection of biogeochemical data and in this contribution we analyze them with the aim of elucidat-ing relevant biogeochemical processes, includelucidat-ing the magnitude of primary production, and the decay of organic matter as well as its impact on ocean acidification.
2 Methods
15
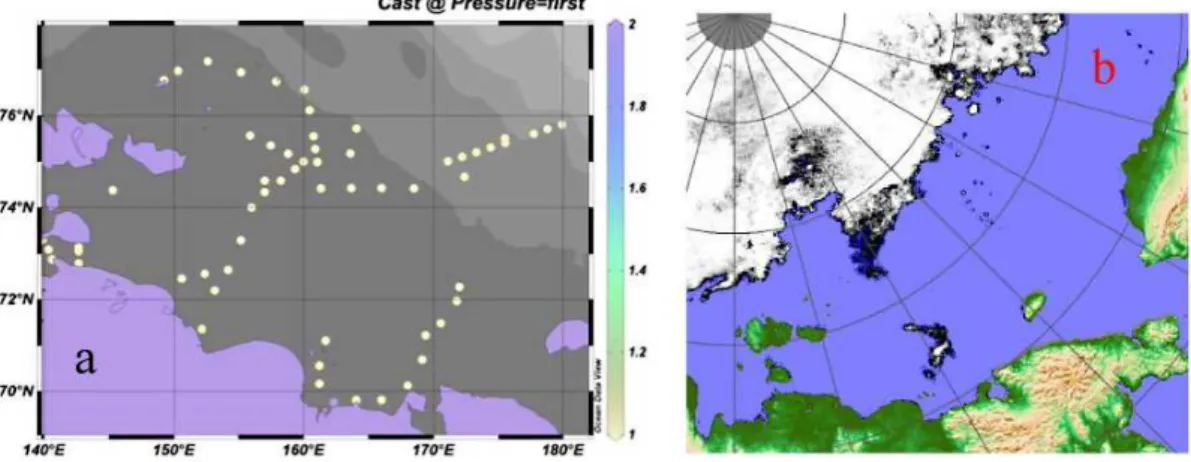
57 stations were occupied in the ESS between the 31 August and 15 September 2008, for station locations see Fig. 2a. A SeaBird 911+ CTD system was attached to a 12 bottle rosette system for water sample collection. The salinity data was calibrated against water samples analysed onboard using an AUTOSAL lab-salinometer on about half of the collected water samples. Depth profiles of nutrients, oxygen, pH, total al-20
kalinity (TA) and dissolved inorganic carbon (DIC) were collected and determined in a container laboratory on board using state of the art analytical techniques. Nutrients, phosphate, nitrate and silicate were determined by a SmartChem analyzer (Westco Scientific Instruments Inc.). The samples were filtered before analysis and evaluated by a 6 to 8-points calibration curve, precision being ∼1%. Oxygen was determined 25
BGD
8, 1137–1167, 2011East Siberian Sea, an arctic region of very high biogeochemical
activity
L. G. Anderson et al.
Title Page
Abstract Introduction
Conclusions References
Tables Figures
◭ ◮
◭ ◮
Back Close
Full Screen / Esc
Printer-friendly Version
Interactive Discussion
Discussion
P
a
per
|
Dis
cussion
P
a
per
|
Discussion
P
a
per
|
Discussio
n
P
a
per
DIC was determined by a coulometric titration method based on Johnson et al. (1987), having a precision of ∼2 µmol kg−1, with the accuracy set by calibration against certified reference materials (CRM), supplied by A. Dickson, Scripps Institu-tion of Oceanography (USA). TA was determined by potentiometric titraInstitu-tion, precision
∼2 µmol kg−1, (Haraldsson et al., 1997) with the accuracy set the same way as for
5
DIC. pH was determined by spectrophotometric detection (Clayton and Byrne, 1993; Lee and Millero, 1995), having a precision of∼0.003 pH units and the accuracy was set
by the equilibrium constants of the indicator. The values presented are on the seawater scale and are normalized to a temperature of 15◦C and atmospheric pressure.
The fugacity of CO2(fCO2) was computed from pH and total alkalinity using the soft-10
ware CO2SYS (Lewis and Wallace, 1998). The carbonate dissociation constants (K1 andK2) used were those of Roy et al. (1993) as they show the best internal consis-tency in the low temperature waters of the Arctic Ocean when using any two of pH, DIC or TA as input parameters. The data are archived at the PANGEA information system under the EU project European Project on Ocean Acidification (EPOCA). Atmospheric 15
fCO2were determined using the open-cell Licor7500 (www.licor.com).
For methane measurements water samples were immediately taken from Niskin bot-tles and poured into replicate 500-ml glass botbot-tles, overfilling 1.5–2 times with the sam-ple. The headspace technique for equilibrating between the dissolved and gaseous phases was applied (Semiletov et al., 1996). Methane concentrations were measured 20
BGD
8, 1137–1167, 2011East Siberian Sea, an arctic region of very high biogeochemical
activity
L. G. Anderson et al.
Title Page
Abstract Introduction
Conclusions References
Tables Figures
◭ ◮
◭ ◮
Back Close
Full Screen / Esc
Printer-friendly Version
Interactive Discussion
Discussion
P
a
per
|
Dis
cussion
P
a
per
|
Discussion
P
a
per
|
Discussio
n
P
a
per
|
3 Results and discussion
3.1 Hydrography
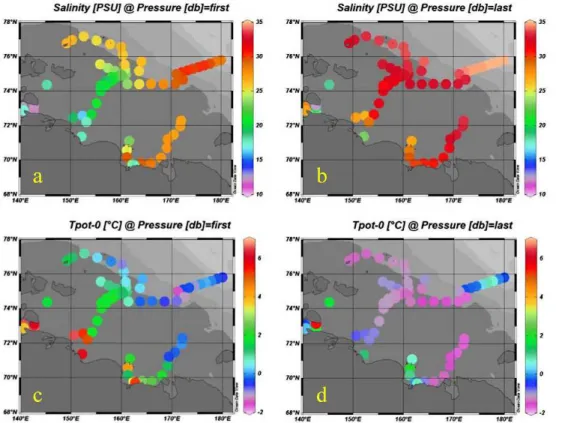
The sea ice coverage in the summer of 2008 was fairly favorable and a large area of the ESS could be sampled (Fig. 2a). Only some small patches of drifting sea ice were observed during the cruise and restricted the sampling program (Fig. 2b). The salinity 5
field shows generally low surface salinities in the west and high in the east (Fig. 3). The low salinity water from the Laptev Sea, a result of the large runofffrom the Lena River (about 4 times higher than the sum of Indigirka and Kolyma), enters the ESS along the Siberian coast and is seen all up to 75◦N in the west with salinities in the range of 20–25. The bottom waters in the shallow southwestern part have low salinities of the 10
same range. The surface water temperatures show a similar pattern with the warmest water to the southwest and the coldest to the northeast.
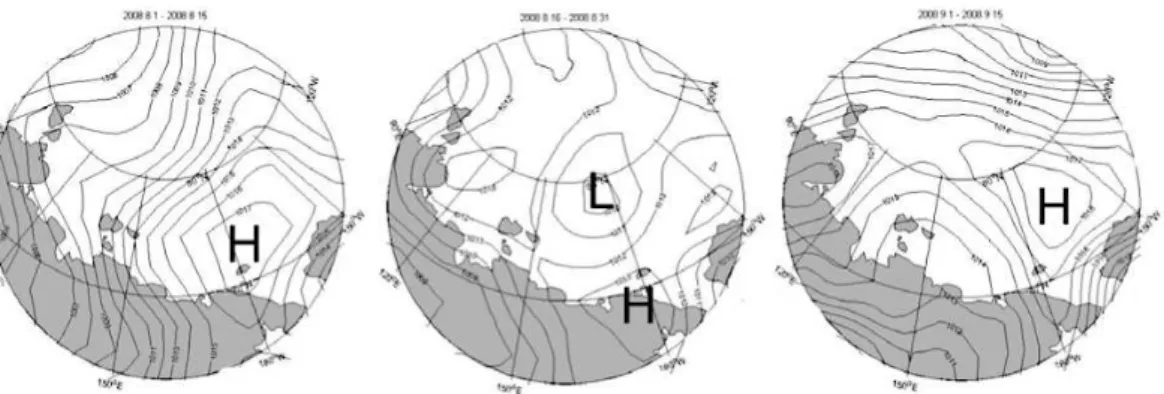
The summer of 2008 was characterized by persistent high pressure systems in the Beaufort Sea and Wrangel Island area (Fig. 4) which resulted in generally southerly wind over the ESS. A notable period of very strong southerly winds was around 2–5 15
September, when the observations near the Kolyma River were made. The offshore winds over a month prior to the expedition as well as under the expedition likely forced most of the river water offshore and also inhibited development of a confined SCC. This is reflected in the hydrographical data which generally show high surface salinity (>25) in the eastern part of the ESS (east of about 160◦E), with no clearly represented SCC 20
in the surface water salinity in the southeastern ESS. There are even some enhanced salinities of near 30 close to the coast at longitudes 160 to 170◦E, indicating an inflow from the Chukchi Sea. Alternatively these waters have been mixed up from the bottom (depth around 30 m), but if this was the case it must have been early in the season as there is a clear signature of primary production, i.e. oxygen super-saturation as well as 25
low nitrate and phosphate concentrations.
BGD
8, 1137–1167, 2011East Siberian Sea, an arctic region of very high biogeochemical
activity
L. G. Anderson et al.
Title Page
Abstract Introduction
Conclusions References
Tables Figures
◭ ◮
◭ ◮
Back Close
Full Screen / Esc
Printer-friendly Version
Interactive Discussion
Discussion
P
a
per
|
Dis
cussion
P
a
per
|
Discussion
P
a
per
|
Discussio
n
P
a
per
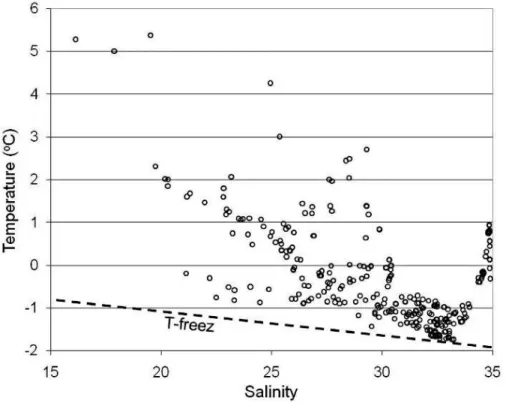
above zero degrees. This has been explained by heating from runoff, e.g. the Lena River plume that heated the bottom sediment to up to 3◦C in the top 1 m layer in the Dmitry Laptev Strait inducing the thermal abrasion of frozen seafloor deposits (Shakhova and Semiletov, 2007). The bottom waters at the continental slope are well above freezing as these have a signature of warm Atlantic Layer water (e.g. Dmitrenko 5
et al., 2010). The high temperatures in the waters of low and high salinities are clearly seen in aT-S plot (Fig. 5). The waters at freezing temperature have salinities around 32–33.
3.2 Biogeochemistry
The river runoffalso impacts the chemical signature of the waters as it has a high con-10
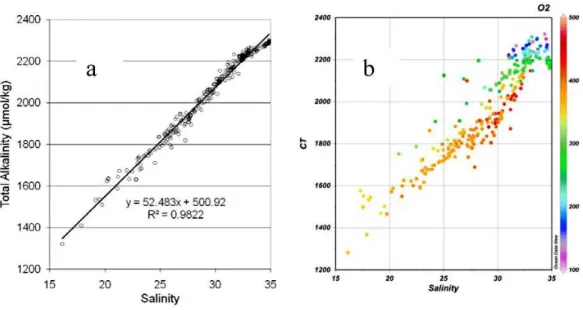
centration of total alkalinity (e.g. Anderson et al., 1983; Yamamoto-Kawai et al., 2005; Pipko et al., 2010), dissolved organic carbon (e.g. Anderson, 2002; Pipko et al., 2010) as well as nutrients (e.g. Gordeev et al., 1999). The ISSS-08 TA data from the ESS shows a clear linear relationship with salinity with an offset at zero salinity of about 500 µmol kg−1 (Fig. 6a). This offset is close to the 570
±21 µmol kg−1reported for
wa-15
ters with a salinity over 24 from the Laptev and East Siberian Seas in 1994 (Olsson and Anderson, 1997). The TA content in the runoffis a result of hydrogen carbonate ions from a combination of decay of organic matter and dissolution of calcium carbonate in the drainage basins, according to the reaction CH2O(org)+CaCO3(s)+O2→2HCO−
3
+Ca2+(e.g. Anderson et al., 2004). The linear fit of TA versus salinity is a result of the 20
relatively conservative behavior of TA, i.e. the small impact on TA by biological produc-tion and decay of organic matter in oxic water (Fig. 6a). It further implies that formaproduc-tion and dissolution of calcium carbonate is not very abundant in the ESS. DIC on the other hand shows a less conservative behavior (larger deviation from a linear fit) with concentrations on the low side of a mixing line associated with high oxygen concentra-25
BGD
8, 1137–1167, 2011East Siberian Sea, an arctic region of very high biogeochemical
activity
L. G. Anderson et al.
Title Page
Abstract Introduction
Conclusions References
Tables Figures
◭ ◮
◭ ◮
Back Close
Full Screen / Esc
Printer-friendly Version
Interactive Discussion
Discussion
P
a
per
|
Dis
cussion
P
a
per
|
Discussion
P
a
per
|
Discussio
n
P
a
per
|
The oxygen saturation in the surface waters with a deficit in DIC are typically between 100 and 110%, but higher oversaturation, up to ∼130%, is observed at about 20 m depth. This subsurface maximum in oxygen saturation was also observed by Codispoti and Richards (1971), which they attributed to in situ photosynthesis production in well stratified waters. The oxygen saturation in the waters of excess DIC was as low as 5
<40%, and these waters were found close to the bottom. However, no water samples were collected directly at the sediment – water interface and thus it is likely that even lower oxygen saturation values than the observed were present.
Biogeochemical transformation is even more obvious in plots of the nutrients and fCO2 versus salinity (Fig. 7). A common feature for these parameters is the high 10
values in the salinity range 32–33, the range with near freezing water temperatures. These high values are a signal of mineralization of organic matter, likely occurring at the sediment surface with the decay products released to the cold bottom water (Fig. 3d). The highest salinities are found in the deep water at the shelf break stations and they have significantly lower nutrient concentrations, all consistent with these waters being 15
of Atlantic origin circulating along the continental slope of the deep central Arctic Ocean (Rudels et al., 1994).
Waters having salinities below∼32 show much more diverse signatures, with a wide span of nutrient concentrations as well asfCO2 values. The lowest fCO2 values (at salinities between∼27 and∼32) are mostly found in the surface and sub-surface
wa-20
ters to the north and east of the ESS. This is a signature of recent primary production, consuming CO2 as well as nutrients. The very low salinities, below∼23, is found in
the southwestern region. Here thefCO2is at or above the atmospheric values at the time of the study which were in the range 375 to 380 µatm (A. Salyuk, personal com-munication, December 2010). Oversaturation of CO2shows that heterotrophic activity 25
exceeds that of autotrophic in these waters.
BGD
8, 1137–1167, 2011East Siberian Sea, an arctic region of very high biogeochemical
activity
L. G. Anderson et al.
Title Page
Abstract Introduction
Conclusions References
Tables Figures
◭ ◮
◭ ◮
Back Close
Full Screen / Esc
Printer-friendly Version
Interactive Discussion
Discussion
P
a
per
|
Dis
cussion
P
a
per
|
Discussion
P
a
per
|
Discussio
n
P
a
per
river runoff. At the low salinity waters, below ∼20, there is a signal of nutrient
con-sumption by marine primary production and the water is oversaturated with respect to CO2. The nutrient consumption is most pronounced for phosphate as the observed concentrations cannot be achieved by mixing of the two observed water masses, one being seawater with a phosphate concentration of ∼1 µmol kg−1 at S=25, the other
5
being runoffeven if it has no phosphate. The most plausible explanation of the pattern in nutrient andfCO2signature is that microbial decay of terrestrial organic matter, low in nutrients, is dominating over marine primary production when it comes to carbon transformation (Anderson et al., 2009).
In the salinity range of about 27–32 there is a signal of draw down of phosphate in 10
the waters with lowfCO
2 values relative to those at atmospheric equilibrium,
indicat-ing primary production. For nitrate this feature is less obvious, largely because of the many samples with close to zero concentration. Ammonium can also be used as a nitrogen source in primary production. Unfortunately ammonium was not determined on board the Yacob Smirnitskyi, but some samples were brought home and analyzed 15
in the laboratory. The quality of these data was not good and is thus not presented in this contribution. However, the majority of the samples from the upper waters had con-centrations at the detection limit, indicating that ammonium was of minor importance in this depth range. Hence nitrate is the limiting factor for marine primary production in these waters.
20
3.2.1 Primary production
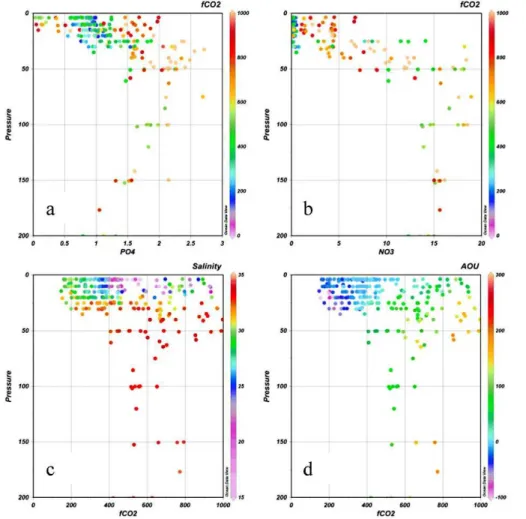
The waters with fCO2 below atmospheric values, and salinities between 25 and 32 (Fig. 7d) are the only ones where net autotrophic conditions prevail. These condi-tions are found in the surface waters of the northern and eastern ESS (Fig. 3a). A depth plot offCO2color coded for salinity (Fig. 8c) confirms this and shows that these 25
BGD
8, 1137–1167, 2011East Siberian Sea, an arctic region of very high biogeochemical
activity
L. G. Anderson et al.
Title Page
Abstract Introduction
Conclusions References
Tables Figures
◭ ◮
◭ ◮
Back Close
Full Screen / Esc
Printer-friendly Version
Interactive Discussion
Discussion
P
a
per
|
Dis
cussion
P
a
per
|
Discussion
P
a
per
|
Discussio
n
P
a
per
|
of under-saturatedfCO2. The nutrient signal is less straight forward (Fig. 8a and b), with phosphate concentrations in the range of 0.7 to 1.2 µmol kg−1 for waters being under-saturated infCO2. Nitrate on the other hand is very close to zero for these wa-ters. However, there are upper waters (shallower than 30 m) with higher concentrations in both phosphate and nitrate, as well as lower in phosphate, but these are all found 5
in the southwestern ESS. It is clear, though, that nitrate is the limiting nutrient in the eastern ESS.
From the fCO
2 profile it is seen that the minimum value is about 175 µatm that
gives a maximum under-saturation of about 200 µatm. Assuming that the mean under-saturation is 100 µatm and using this value to compute the corresponding con-10
sumption in DIC, using the observed mean S, T and TA, yields a consumption of 35 µmol kg−1. Applying the Redfield ratio of P:N:C of 1:16:106 means a
consump-tion of 0.33 µmol kg−1and 5.3 µmol kg−1of phosphate and nitrate, respectively. These values are in the range of all data in the top 30 m of Fig. 8a and b, making this a re-alistic consumption. However, the exact nutrient concentrations in these waters before 15
productivity started are not known and thus it is not possible to prove this carbon draw down from nutrient data.
When a DIC consumption of 35 µmol kg−1 is integrated over 30 m depth it results in a consumption of about 1 mol C m−2. This consumption is restricted to the area of the ESS with S >∼25, which according to the surface salinity map (Fig. 3a) is 20
about half of the ESS. Assuming that an annual consumption of 1 mol C m−2 is valid for half of the ESS, with an area of∼500 000 km2, gives an annual primary production
of 0.5×10¹²mol C or 6×10¹²gC, which is about one half of the previous estimations: 10–15×1012gC (Vetrov and Romankevich, 2004; Vinogradov et al., 2000) and sub-stantially lower than the 45×1012gC that was suggested by Sakshaug (2004).
How-25
BGD
8, 1137–1167, 2011East Siberian Sea, an arctic region of very high biogeochemical
activity
L. G. Anderson et al.
Title Page
Abstract Introduction
Conclusions References
Tables Figures
◭ ◮
◭ ◮
Back Close
Full Screen / Esc
Printer-friendly Version
Interactive Discussion
Discussion
P
a
per
|
Dis
cussion
P
a
per
|
Discussion
P
a
per
|
Discussio
n
P
a
per
3.2.2 Fate of organic matter
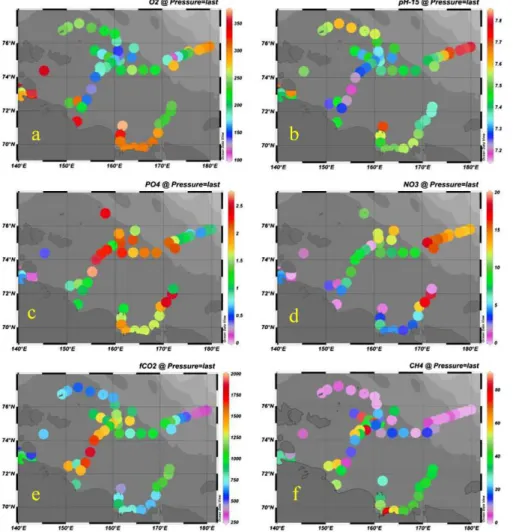
The fate of organic matter and and its impact on the chemical environment is clearly seen in the bottom waters of the ESS (Fig. 9). The lowest oxygen concentrations are observed in a region centered at about 75◦N and 155◦E. In the same region the lowest pH and the highestfCO2values are observed. However, the highest nutrient concen-5
trations are found in other regions. The maximum phosphate concentration is found slightly to the north of the region of the minimum oxygen and pH values, as well as in a region in the eastern ESS. In the latter region the highest nitrate concentrations are also observed. This over all pattern is likely the result that degradation of terres-trial organic matter (low in nutrients) dominates in the western ESS, while degradation 10
of marine organic matter (OM) dominates in the northern and eastern ESS. Such a pattern is supported by the δ13C signature of OM in the particulate material, POM (Dudarev et al., 2011, this issue) and in the sediment (Naidu et al., 2000; Semiletov et al., 2005), and molecular and radiocarbon in the POM along the Kolyma paleoriver transect (Vonk et al., 2010).
15
Another possible product of microbial decay of organic matter is methane (CH4), when CO2itself is used as electron acceptor. In marine environment modern methano-genesis can occur in strictly anaerobic sediments, where sulfate concentration is low, or in the anaerobic lenses that might at places occur in the pycnocline (Damm et al., 2005). In the ESS, such production is limited to the Holocene sediment layer accumu-20
lated above the sub-sea permafrost, which caps deeper sediments. This means that modern methanogenesis can only take place within the taliks and/or in areas of prefer-ential sediment accumulation, primarily in water depths greater than 50 m. Moreover, in order for this CH4to leak up into the bottom water methanogenesis rates need to be very high as anaerobic oxidation of CH4 when it passes through the upper sediment 25
BGD
8, 1137–1167, 2011East Siberian Sea, an arctic region of very high biogeochemical
activity
L. G. Anderson et al.
Title Page
Abstract Introduction
Conclusions References
Tables Figures
◭ ◮
◭ ◮
Back Close
Full Screen / Esc
Printer-friendly Version
Interactive Discussion
Discussion
P
a
per
|
Dis
cussion
P
a
per
|
Discussion
P
a
per
|
Discussio
n
P
a
per
|
from seabed deposits or hydrothermal vents (Hovland et al., 1993). An extensive re-view of possible sources of dissolved CH4 in the East Siberian Arctic Shelf, including the ESS was recently published (Shakhova et al., 2010b).
In the ESS methane is found in highly variable concentrations. At some areas of the ESS surface water is up to 20 times super-saturated in CH4 relative to the atmo-5
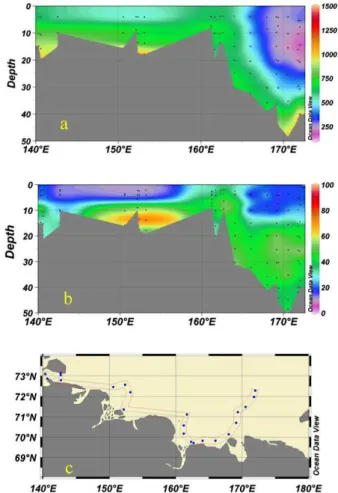
sphere, while mid- and bottom waters are supersaturated by up to 400 times. The maximum dissolved CH4 concentrations, up to 35–45 nM (Fig. 9f) were found in the bottom water along the Indigirka paleo-valley, between 150◦E and 160◦E, and along the shallow transect east of the Kolyma mouth, between 160◦E and 165◦E. This is il-lustrated in Fig. 10b where the distribution of dissolved CH4is not determined by water 10
mass circulation, asfCO
2is (Fig. 10a) with the largest contrasts in the frontal zone
be-tween the low saline and low-transparent heterotrophic local shelf waters and the high productive and high-transparent Pacific-derived autotrophic waters (Pipko et al., 2005, 2008, 2011; Semiletov et al., 2005, 2007). The dissolved CH4concentration is mostly related to the location of seabed CH4sources inside the fault zones and through taliks 15
(Nikolsky and Shakhova, 2010; Shakhova et al., 2010a and b). In the latter area twice as high CH4concentrations were found in September of 2003 (Shakhova et al., 2005). In general, the concentrations of dissolved CH4determined in 2008 are similar to those measured in 2003, but the highest CH4concentrations measured so far in the ESS, up to 900 nM, were found in 2008 at the mid-shelf beneath the pycnocline along the 74◦N 20
latitude transect from 155◦E to 170◦E. These huge clouds of dissolved CH
4 are
as-sociated with the massive CH4 release most likely due to ebullition from the seabed in the East Siberian Shelf (Shakhova et al., 2010a and b). Note that the variability in dissolved CH4 concentration between the years 2003 and 2004 was very high, up to 3–4 times in some particular areas including the shallow alongshore transect east 25
BGD
8, 1137–1167, 2011East Siberian Sea, an arctic region of very high biogeochemical
activity
L. G. Anderson et al.
Title Page
Abstract Introduction
Conclusions References
Tables Figures
◭ ◮
◭ ◮
Back Close
Full Screen / Esc
Printer-friendly Version
Interactive Discussion
Discussion
P
a
per
|
Dis
cussion
P
a
per
|
Discussion
P
a
per
|
Discussio
n
P
a
per
3.3 Impact on ocean pH
The low pH caused by microbial decay of organic matter results in a drift of the dis-solved carbonate system from carbonate ions to carbonic acid. This in turn will de-crease the solubility state of calcium carbonate, typically expressed as omega (Ω = [Ca2+] [CO2−
3 ]/KSO) whereKSO is the chemical solubility of CaCO3. Omega will be
fur-5
ther decreased by dilution with river runoffthat has a lower calcium ion concentration than that of seawater. These conditions have a profound impact on the saturation state of calcite and aragonite in the bottom waters of the ESS (Fig. 11). The western part is strongly under-saturated with respect to both calcite and aragonite. Most of the rest of the area investigated during the ISSS-08 is under-saturated with respect to aragonite 10
and close to saturation or slightly under-saturated also with respect to calcite. These conditions make the living conditions for benthic calcifiers very unfavorable.
If the situation has been like this for many years or if it has been “acidified” during later years as a result of both an increased load of terrestrial OM as well as increased atmospheric partial pressure of CO2cannot be concluded from these data. However, 15
in a shallow sea like the ESS the atmospheric signature will penetrate to the bottom within a very short time, maximum a few years. Hence, the conditions have likely been worsened during the last decades. Likewise, thawing of the permafrost likely has increased the load of terrestrial OM adding to the acidification.
4 Summary and conclusions
20
In this contribution a comprehensive data set of physical and chemical data, covering a large area of the East Siberian Sea, illustrate the substantial biogeochemical trans-formation that occurs in this region. The data confirm that two governing hydrographic regimes exists, one in the west that is dominated by an influence of river runoff and one in the east that is dominated by modified water from the Pacific Ocean. In these 25
BGD
8, 1137–1167, 2011East Siberian Sea, an arctic region of very high biogeochemical
activity
L. G. Anderson et al.
Title Page
Abstract Introduction
Conclusions References
Tables Figures
◭ ◮
◭ ◮
Back Close
Full Screen / Esc
Printer-friendly Version
Interactive Discussion
Discussion
P
a
per
|
Dis
cussion
P
a
per
|
Discussion
P
a
per
|
Discussio
n
P
a
per
|
exceeding that of autotrophic in the west, resulting in over-saturation of CO2, and the opposite in the surface waters to the east, i.e. under-saturation of CO2. The bottom wa-ters are all high in nutrients andfCO2, with extremely high values in the central western ESS. Here thefCO2 values were well above 1000 µatm and this, in combination with high nutrient and low oxygen concentrations shows extensive microbial decay of or-5
ganic matter. The origin of the organic matter is both marine primary production and input of terrestrial organic matter, where the latter dominates in the surface waters to the west, as deduced from the nutrient distribution. Another signature of microbial de-cay of organic matter could be methane, at least under non-seawater conditions. The observations showed a high-spatial variability of dissolved CH4, confirming earlier ob-10
servations of a source from the seabed of possible both glacial and modern produced methane.
From the depth profiles of the carbon system parameters it was possible to infer a quantitative estimate of primary production. The under-saturation offCO2corresponds to a DIC consumption of 35 µmol kg−1, which when integrated over 30 m depth results 15
in a consumption of about 1 mol C m−2. Assuming surface water at saturation in the spring when production starts gives an estimate of a corresponding areal productiv-ity. The under-saturation was observed in about half of the ESS, estimated area of
∼500 000 km2, giving an annual primary production of 0.5×10¹²mol C or 6×10¹²gC.
The decay of organic matter at the sediment surface that results in the highfCO2 20
levels also lowers pH. Values below 7.5 units, pHtot normalized to 15◦C, were ob-served making this one of the most naturally acidified open marine environments. The anthropogenic ocean acidification signal will in a short time penetrate all through the water column in these shallow seas of about 50 m bottom depth. Calcium carbonate is under-saturated especially with respect to aragonite. Consequently the conditions for 25
BGD
8, 1137–1167, 2011East Siberian Sea, an arctic region of very high biogeochemical
activity
L. G. Anderson et al.
Title Page
Abstract Introduction
Conclusions References
Tables Figures
◭ ◮
◭ ◮
Back Close
Full Screen / Esc
Printer-friendly Version
Interactive Discussion
Discussion
P
a
per
|
Dis
cussion
P
a
per
|
Discussion
P
a
per
|
Discussio
n
P
a
per
Acknowledgements. This work was carried out by logistic support from the Knut and Alice Wallenberg Foundation and form Swedish Polar research Secretariat. The science was finan-cially supported by; the Swedish Research Council (contract no. 2006-3240 and no. 621-2010-4084); the European Union projects, CarboOcean (contract no. 511176-2), EPOCA (con-tract no. 211384) and DAMOCLES (con(con-tract 018509); the Far-Eastern Branch of the Russian
5
Academy of Sciences (FEBRAS); the Cooperative Institute for Arctic Research through NOAA Cooperative Agreement NA17RJ1224; the US National Science Foundation (no. ARC-1023281 (NS & IS)); and the Russian Foundation for Basic Research (no. 04-05-64819, 10-05-00996-a (IPS), no. 05-05-64213, 08-05-00184 (IIP)). We 10-05-00996-are 10-05-00996-also gr10-05-00996-ateful to 10-05-00996-all our colle10-05-00996-agues th10-05-00996-at contributed to the implementation of the project.
10
References
Alling, V., Sanchez-Garcia, L., Porcelli, D., Pugach, S., Vonk, J., van Dongen, B., M ¨orth, M., An-derson, L. G., Sokolov, A., Humborg, C., Semiletov, I., and Gustafsson, ¨O.: Non-conservative behavior of dissolved organic carbon across the Laptev and East Siberian Seas, Global Bio-geochem. Cy., 24, GB4033, doi:10.1029/2010GB003834, 2010.
15
Anderson, L. G.: DOC in the Arctic Ocean, in: Biogeochemistry of Marine Dissolved Organic Matter, edited by: Hansel, D. A. and Carlson, C. A., Academic Press, 665–683, 2002. Anderson, L., Dyrssen, D., Jones, E. P., and Lowings, M. G.: Inputs and outputs of salt, fresh
water, alkalinity and silica in the Arctic Ocean, Deep-Sea. Res., 30, 87–94, 1983.
Anderson, L. G., Jutterstr ¨om, S., Kaltin, S., Jones, E. P., and Bj ¨ork, G.: Variability in river
20
runoffdistribution in the Eurasian Basin of the Arctic Ocean, J. Geophys. Res., 109, C01016, doi:10.1029/2003JC001773, 2004.
Anderson, L. G., Jutterstr ¨om, S., Hjalmarsson, S., W ˚ahlstr ¨om, I., and Semiletov, I. P.: Out-gassing of CO2 from Siberian Shelf Seas by terrestrial organic matter decomposition,
Geo-phys. Res. Lett., 36, L20601, doi:10.1029/2009GL040046, 2009.
25
Clayton, T. D. and Byrne, R. H.: Spectrophotometric seawater pH measurements: total hy-drogen ion concentration scale calibration of m-cresol purple and at-sea results, Deep-Sea Res., Part I, 40, 2115–2129, 1993.
Codispoti, L. A. and Richards, F. A.: Micronutrient distributions in the East Siberian and Laptev seas during summer 1963, Arctic, 21, 67–83, 1968.
BGD
8, 1137–1167, 2011East Siberian Sea, an arctic region of very high biogeochemical
activity
L. G. Anderson et al.
Title Page
Abstract Introduction
Conclusions References
Tables Figures
◭ ◮
◭ ◮
Back Close
Full Screen / Esc
Printer-friendly Version
Interactive Discussion
Discussion
P
a
per
|
Dis
cussion
P
a
per
|
Discussion
P
a
per
|
Discussio
n
P
a
per
|
Codispoti, L. A. and Richards, F. A.: Oxygen supersaturations in the Chukchi and East Siberian Seas, Deep-Sea Res., 18, 341–351, 1971.
Damm, E., Mackensen, A., Budeus, G., Faber, E., and Hanfland, C.: Pathways of methane in seawater: Plume spreading in an Arctic shelf environment (SW-Spitsbergen), Cont. Shelf Res., 25, 1453–1472, 2005.
5
Dmitrenko, I., Kirillov, S., Eicken, H., and Markova, N.: Wind-driven summer sur-face hydrography of the eastern Siberian shelf, Geophys. Res. Lett., 32, L14613, doi:10.1029/2005GL023022, 2005.
Dmitrenko, I. A., Kirillov, S. A., and Tremblay, L. B.: The long-term and interannual variability of summer fresh water storage over the eastern Siberian shelf: Implication for climatic change,
10
J. Geophys. Res., 113, C03007, doi:10.1029/2007JC004304, 2008.
Dmitrenko, I. A., Kirillov, S. A., Tremblay, L. B., Bauch, D., H ¨olemann, J. A., Krumpen, T., Kassens, H., Wegner, C., Heinemann, G., and Schr ¨oder, D.: Impact of the Arctic Ocean Atlantic water layer on Siberian shelf hydrography, J. Geophys. Res., 115, C08010, doi:10.1029/2009JC006020, 2010.
15
Dudarev, O., Charkin, A., Semiletov, I., Vonk, J., S ´anchez-Garc´ıa, L., and Gustafsson, ¨O.: Interannual variability of the particulate matter composition, the East Siberian Sea, Biogeo-sciences Discuss., to be submitted, 2011.
Gordeev, V. V., Dzhamalov, R. G., Zektser, I. S., Zhulidov, V. V., and Bryzgalo, V. A.: Assess-ment of nutrient discharge with river and groundwater flow into marginal seas of the Russian
20
Arctic Regions, Water Resources, 26, 2, 181–186, 1999.
Haraldsson, C., Anderson, L. G., Hassell ¨ov, M., Hulth, S., and Olsson, K.: Rapid, high-precision potentiometric titration of alkalinity in the ocean and sediment pore waters, Deep-Sea Res., Part I, 44, 2031–2044, 1997.
Holmes, R. M., Peterson, B. J., Gordeev, V. V., Zhulidov, A. V., Meybeck, M., Lammers, R.
25
B., and V ¨or ¨osmarty, C. J.: Flux of nutrients from Russian rivers to the Arctic Ocean: Can we establish a baseline against which to judge future changes?, Water Resources Res., 36, 2309–2320, 2000.
Holt, B. and Martin, S.: The effect of a storm on the 1992 summer sea ice cover of the Beaufort, Chukchi, and East Siberian Seas, J. Geophys. Res., 106, C1, 1017–1032, 2001.
30
Hovland, M., Judd, A., and Burke, Jr., A.: The global flux of methane from shallow sub-sea sediments, Chemosphere, 26, 559–578, 1993.
BGD
8, 1137–1167, 2011East Siberian Sea, an arctic region of very high biogeochemical
activity
L. G. Anderson et al.
Title Page
Abstract Introduction
Conclusions References
Tables Figures
◭ ◮
◭ ◮
Back Close
Full Screen / Esc
Printer-friendly Version
Interactive Discussion
Discussion
P
a
per
|
Dis
cussion
P
a
per
|
Discussion
P
a
per
|
Discussio
n
P
a
per
Geochem. Geophys. Geosyst., 3(5), 1028, doi:10.1029/2001GC000302, 2002.
Johnson, K. M., Sieburth, J. M., Williams, P. J., and Br ¨andstr ¨om, L.: Coulometric total carbon dioxide analysis for marine studies: automation and calibration, Mar. Chem., 21, 117–133, 1987.
Kwok, R., Cunningham, G. F., Wensnahan, M., Rigor, I., Zwally, H. J., and Yi, D.: Thinning and
5
volume loss of the Arctic Ocean sea ice cover: 2003–2008, J. Geophys. Res., 114, C07005, doi:10.1029/2009JC005312, 2009.
Lee, K. and Millero, F. J.: Thermodynamic studies of the carbonate system in seawater, Deep-Sea Res., Part I, 42, 2035–2061, 1995.
Lewis, E. and Wallace, D. W. R.: Program developed for CO2 system calculations,
10
ORNL/CDIAC-105, Carbon Dioxide Information Analysis Center, Oak Ridge National Lab-oratory, US Department of Energy, Oak Ridge, Tennessee, 1998.
Morris, K., Li, S. S., and Jeffries, M.: Meso- and microscale sea-ice motion in the East Siberian Sea as determined from ERS-1 SAR data, J. Glaciol., 45, 150, 370–382, 1999.
M ¨unchow, A., Weingartner, T. J., and Cooper, L. W.: The summer hydrography and surface
15
circulation of the East Siberian Shelf Sea, J. Phys. Oceanogr., 29, 2167–2182, 1999. M ¨unchow, A., Carmack, E. C., and Huntley, D. A.: Synoptic density and velocity observations
of slope waters in the Chukchi and East-Siberian Seas, J. Geophys. Res., 105, C6, 14103– 14119, 2000.
Naidu, A. S., Cooper, L. W., Finney, B. P., Macdonald, R. W., Alexander, C., and Semiletov, I. P.:
20
Organic carbon isotope ratios (δ13C) of Arctic Amerasian continental shelf sediments, Int. J.
Earth Sci., 89, 522–532, 2000.
Nghiem, S. V., Chao, Y., Neumann, G., Li, P., Perovich, D. K., Street, T., and Clemente-Col ´on, P.: Depletion of perennial sea ice in the East Arctic Ocean, Geophys. Res. Lett., 33, L17501, doi:10.1029/2006GL027198, 2006.
25
Nicolsky, D. and Shakhova, N.: Modeling sub-sea permafrost in the East-Siberian Arctic Shelf: the Dmitry Laptev Strait, Env. Res. Lett., 5, 015006, doi:10.1088/1748-9326/5/1/015006, 2010.
Olsson, K. and Anderson, L. G.: Input and biogeochemical transformation of dissolved carbon in the Siberian shelf seas, Cont. Shelf Res., 17, 819–833, 1997.
30
Pipko, I. I., Semiletov, I. P., and Pugach, S. P.: The carbonate system of the East Siberian Sea waters, Dokl. Earth Sci., 402, 4, 624–627, 2005.
BGD
8, 1137–1167, 2011East Siberian Sea, an arctic region of very high biogeochemical
activity
L. G. Anderson et al.
Title Page
Abstract Introduction
Conclusions References
Tables Figures
◭ ◮
◭ ◮
Back Close
Full Screen / Esc
Printer-friendly Version
Interactive Discussion
Discussion
P
a
per
|
Dis
cussion
P
a
per
|
Discussion
P
a
per
|
Discussio
n
P
a
per
|
of the carbonate system parameters in the coast–shelf zone of the East Siberian Sea during the autumn season, Oceanology, 48, 1, 54–67, 2008 (translated to English).
Pipko, I. I., Pugach, S. P., Dudarev, O. V., Charkin, A. N., and Semiletov, I. P.: Carbonate parameters of the Lena River: Characteristics and Distribution, Geochemistry Int., 48, 11, 1131–1137, 2010.
5
Pipko, I. I., Semiletov, I. P., Pugach, S. P., W ˚ahlstr ¨om, I., and Anderson, L. G.: Interannual variability of air-sea CO2fluxes and carbonate system parameters in the East Siberian Sea,
Biogeosciences Discuss., in press, 2011.
Polyakov, I. V., Alexeev, V. A., Belchansky, G. I., Dmitrenko, I. A., Ivanov, V. V., Kirillov, S. A., Korablev, A. A., Steele, M., Timokhov, L. A., and Yashayaev, I.: Arctic Ocean
fresh-10
water changes over the past 100 years and their causes, J. Climate, 21(2), 364–384, doi:10.1175/2007JCLI1748.1, 2008.
Reeburgh, W. S.: Oceanic methane biogeochemistry, Chem. Rev., 107, 486–513, 2007. Roy, R. N., Roy, L. N., Vogel, K. M., Porter-Moore, C., Pearson, T., Good, C. E., Millero, F. J.,
and Campbell, D. M.: The dissociation constants of carbonic acid in seawater at salinities 5
15
to 45 and temperatures 0 to 46 deg C., Mar. Chem., 44, 249–267, 1993.
Rudels, B., Jones, E. P., Anderson L. G., and Kattner, G.: On the intermediate depth waters of the Arctic Ocean, in: The Polar Oceans and Their Role in Shaping the Global Environment, edited by: Johannessen, O. M., Muench, R. D., and Overland, J. E., American Geophysical Union, Washington, D.C., 33–46, 1994.
20
Sakshaug, E.: Primary and secondary production in the Arctic seas, in: The Organic Carbon Cycle in the Arctic Ocean, edited by: Stein, R. and Macdonald, R. W., Springer, New York, 57–81, 2004.
Savel’eva, N. I., Semiletov, I. P., and Pipko, I. I.: Impact of synoptic processes and river dis-charge on the thermohaline structure in the East Siberian Shelf, Russian Met. Hydrol., 33, 4,
25
240–246, 2008 (translated to English).
Semiletov, I. P., Pipko, I. I., Pivovarov, N. Y., Popov, V. V., Zimov, S. A., Voropaev, Yu. V., and Daviodov, S. P.: Atmospheric carbon emission from North Asian Lakes: a factor of global significance, Atmos. Environ., 30, 10/11, 1657–1671, 1996.
Semiletov, I. P., Dudarev, O., Luchin, V., Charkin, A., Shin, K.-H., and Tanaka, N.: The East
30
Siberian Sea as a transition zone between Pacific-derived waters and Arctic shelf waters, Geophys. Res. Lett., 32, L10614, doi:10.1029/2005GL022490, 2005.
BGD
8, 1137–1167, 2011East Siberian Sea, an arctic region of very high biogeochemical
activity
L. G. Anderson et al.
Title Page
Abstract Introduction
Conclusions References
Tables Figures
◭ ◮
◭ ◮
Back Close
Full Screen / Esc
Printer-friendly Version
Interactive Discussion
Discussion
P
a
per
|
Dis
cussion
P
a
per
|
Discussion
P
a
per
|
Discussio
n
P
a
per
and carbon dioxide fluxes across the atmosphere–ice–water interfaces in the Arctic Ocean: Pacific sector of the Arctic, J. Mar. Sys., 66, 204–226, 2007.
Shakhova, N. and Semiletov, I.: Methane release and coastal environment in the East Siberian Arctic shelf, J. Mar. Sys., 66, 227–243, 2007.
Shakhova, N., Semiletov, I., and Panteleev, G.: The distribution of methane on the Siberian
5
Arctic shelves: Implications for the marine methane cycle, Geophys. Res. Lett., 32, L09601, doi:1029/2005GL022751, 2005.
Shakhova, N., Semiletov, I., Salyuk, A., Joussupov, V., Kosmach, D., and Gustafsson, ¨O.: Extensive methane venting to the atmosphere from sediments of the East Siberian Arctic Shelf, Science, 327, 1246–1250, 2010a.
10
Shakhova, N., Semiletov, I., Leifer, I., Rekant, P., Salyuk, A., and Kosmach, D.: Geochemical and geophysical evidence of methane release from the inner East Siberian Shelf, J. Geo-phys. Res., 115, doi:10.1029/2009JC005602, 2010b.
Steele, M. and Ermold, W.: Salinity trends on the Siberian shelves, Geophys. Res. Lett., 31, L24308, doi:10.1029/2004GL021302, 2004.
15
Vetrov, A. A. and Romankevich, E. A.: Carbon cycle in the Russian Arctic seas, Berlin, Springer Verlag, p. 331, 2004.
Vinogradov, M. E., Vedernikov, V. I., Romankevich, E. A., and Vetrov, A. A.: Some components of carbon cycle in the Russian Arctic seas, Oceanology, 40, 2, 221–233, 2000.
Vonk, J. E., S ´anchez-Garca, L., Semiletov, I., Dudarev, O., Eglinton, T., Andersson, A., and
20
Gustafsson, ¨O.: Molecular and radiocarbon constraints on sources and degradation of ter-restrial organic carbon along the Kolyma paleoriver transect, East Siberian Sea, Biogeo-sciences, 7, 3153–3166, doi:10.5194/bg-7-3153-2010, 2010.
Weingartner, T. J., Danielson, S., Sasaki, Y., Pavlov, V., and Kulakov M. I.: The Siberian Coastal Current: A wind- and buoyancy-forced Arctic coastal current, J. Geophys. Res., 104, C12,
25
29697–29713, 1999.
Yamamoto-Kawai, M., Tanaka, N., and Pivovarov, S.: Freshwater and brine behaviors in the Arctic Ocean deduced from historical data of d18O and alkalinity (1929–2002 A.D.), J. Geo-phys. Res., 110, C10003, doi:10.1029/2004JC002793, 2005.
BGD
8, 1137–1167, 2011East Siberian Sea, an arctic region of very high biogeochemical
activity
L. G. Anderson et al.
Title Page
Abstract Introduction
Conclusions References
Tables Figures
◭ ◮
◭ ◮
Back Close
Full Screen / Esc
Printer-friendly Version
Interactive Discussion
Discussion
P
a
per
|
Dis
cussion
P
a
per
|
Discussion
P
a
per
|
Discussio
n
P
a
per
|
BGD
8, 1137–1167, 2011East Siberian Sea, an arctic region of very high biogeochemical
activity
L. G. Anderson et al.
Title Page
Abstract Introduction
Conclusions References
Tables Figures
◭ ◮
◭ ◮
Back Close
Full Screen / Esc
Printer-friendly Version
Interactive Discussion
Discussion
P
a
per
|
Dis
cussion
P
a
per
|
Discussion
P
a
per
|
Discussio
n
P
a
per
|
Fig. 3. The top panels show the salinity distribution in the surface water(a)and bottom water
BGD
8, 1137–1167, 2011East Siberian Sea, an arctic region of very high biogeochemical
activity
L. G. Anderson et al.
Title Page
Abstract Introduction
Conclusions References
Tables Figures
◭ ◮
◭ ◮
Back Close
Full Screen / Esc
Printer-friendly Version
Interactive Discussion
Discussion
P
a
per
|
Dis
cussion
P
a
per
|
Discussion
P
a
per
|
Discussio
n
P
a
per
|
BGD
8, 1137–1167, 2011East Siberian Sea, an arctic region of very high biogeochemical
activity
L. G. Anderson et al.
Title Page
Abstract Introduction
Conclusions References
Tables Figures
◭ ◮
◭ ◮
Back Close
Full Screen / Esc
Printer-friendly Version
Interactive Discussion
Discussion
P
a
per
|
Dis
cussion
P
a
per
|
Discussion
P
a
per
|
Discussio
n
P
a
per
|
Fig. 7. Plots of phosphate (a), nitrate (b), silicate (c), and fCO2 versus salinity. The color
symbols in the nutrient plots illustrate thefCO2values, while the color in thefCO2plot illustrate
BGD
8, 1137–1167, 2011East Siberian Sea, an arctic region of very high biogeochemical
activity
L. G. Anderson et al.
Title Page
Abstract Introduction
Conclusions References
Tables Figures
◭ ◮
◭ ◮
Back Close
Full Screen / Esc
Printer-friendly Version
Interactive Discussion
Discussion
P
a
per
|
Dis
cussion
P
a
per
|
Discussion
P
a
per
|
Discussio
n
P
a
per
Fig. 8. Depth profiles of phosphate(a), nitrate(b), both color coded byfCO2, andfCO2color
BGD
8, 1137–1167, 2011East Siberian Sea, an arctic region of very high biogeochemical
activity
L. G. Anderson et al.
Title Page
Abstract Introduction
Conclusions References
Tables Figures
◭ ◮
◭ ◮
Back Close
Full Screen / Esc
Printer-friendly Version
Interactive Discussion
Discussion
P
a
per
|
Dis
cussion
P
a
per
|
Discussion
P
a
per
|
Discussio
n
P
a
per
|
BGD
8, 1137–1167, 2011East Siberian Sea, an arctic region of very high biogeochemical
activity
L. G. Anderson et al.
Title Page
Abstract Introduction
Conclusions References
Tables Figures
◭ ◮
◭ ◮
Back Close
Full Screen / Esc
Printer-friendly Version
Interactive Discussion
Discussion
P
a
per
|
Dis
cussion
P
a
per
|
Discussion
P
a
per
|
Discussio
n
P
a
per
Fig. 10. Distribution offCO2 (a)and dissolved CH4 (b)at the “alongshore” transect(c)in the
BGD
8, 1137–1167, 2011East Siberian Sea, an arctic region of very high biogeochemical
activity
L. G. Anderson et al.
Title Page
Abstract Introduction
Conclusions References
Tables Figures
◭ ◮
◭ ◮
Back Close
Full Screen / Esc
Printer-friendly Version
Interactive Discussion
Discussion
P
a
per
|
Dis
cussion
P
a
per
|
Discussion
P
a
per
|
Discussio
n
P
a
per
|