A Fast Clustering Algorithm for Mining Social
Network Data
Saeede Ajorlou,
Member, IAENG,
Issac Shams,
Member, IAENG,
and Kai Yang,
Abstract—Many groups with diverse convictions are interact-ing online. Interactions in online communities help people to engage each other and enhance understanding across groups. Online communities include multiple sub-communities whose members are similar due to social ties, characteristics, or ideas on a topic. In this research, we are interested in understanding the changes in the relative size and activity of these sub-communities, their merging or splitting patterns, and the changes in the perspectives of the members of these sub-communities due to endogenous dynamics inside the commu-nity.
Index Terms—social networks, clustering.
I. INTRODUCTION
T
HE spread and use of online media has been on the rise in the past decade. Internet has been gaining market share over television, newspapers, and magazines, as adver-tising budgets have shifted to online sources and traditional media have faced declining budgets and lower subscription [1]. This trend not only reduces media production costs, but also changes media content, as the homogenizing profes-sional standards that control traditional media do not apply to user generated content. On the one hand heterogeneity of ideas can expose individuals to many alternative perspectives and enhance dialogue and understanding.Online social news sites allow users to post online news stories from different sources (newspapers, blogs, etc) and to vote on stories posted by other users. The stories most voted will be filtered up to the first page, getting more visibility. Users can also comment on different stories, and vote on those comments. Digg.com, one of the top 50 popular U.S. websites, is the prime example of such service in English. Similar systems are popular for bookmarking links (e.g. Delicious.com) and other media (e.g. StumbleUpon.com), and are on the rise in other languages. The combination of user generated content, voting, commenting, and vote-based filtering makes social news sites the perfect setting to exam-ine polarization and homogenization in onlexam-ine communities. To be able to examine dynamics of online communities, first we need to identify these communities and measure their characteristics. Communities are typically defined based on individuals sharing some characteristic or activity, from where they live, to their political affiliation, sport of in-terest, and projects they work on. Network based methods for identifying communities build on relationships (links) among individuals (nodes), which could be direct personal relationships (undirected or directed graphs), or indirect links through common locations people attend, books they like,
S. Ajorloul is with the Department of Industrial & Systems Engi-neering, Wayne State University, Detroit, MI, 48202, USA, e-mail: (see http://www.hse.eng.wayne.edu).
I. Shams and K. Yang are with Wayne State University.
movies they watch, papers they have co-authored and so on (bipartite graphs).
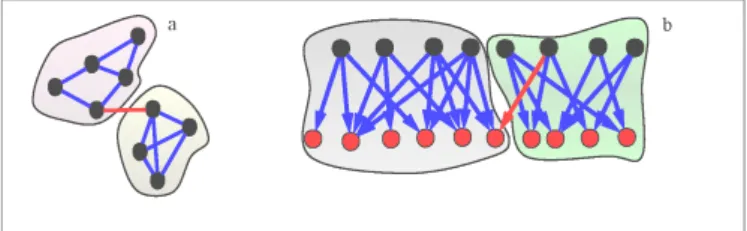
A network-based definition of community would define a set of nodes to belong to the same sub-community if there are many links among those nodes, but relatively few links with nodes outside that sub-community. Fig. I represents these network and community definitions.
Automatic identification of community structure is an ac-tive research domain where different algorithms are devised to efficiently identify such communities based on network dataset [2,3,4].
Social news sites are an example of bipartite networks, where users and the news stories are the two types of nodes, and the positive votes given to stories are the links. Taking into account the literature, we prefer not to impose the number or membership of communities a priori. The network we analyze is relatively large, consisting of thousands of user nodes and hundreds of thousands of story nodes, requiring computationally efficient algorithms. Given that the proposed method should be fast and scalable, we investigate the performance of Quality Threshold (QT) clustering as the primary method.
Fig. 1. Examples of undirected (a) and directed bipartite (b) networks, as well as sub-community structures emerging from those networks. Indi-viduals are shown in black circles, and the stories (or books, movies, etc) are shown in red. Links going across sub-communities are shown in red as well.
II. DATA ANDSETTING
We are given a data consisting of 100k records of approval votes of a set of individuals for a set of stories. The goal here is to cluster the individuals into subsets where those in the same subset have similar tastes, i.e. they are more likely to vote for the same items. Data is collected at several activity points. User records are added when new users register. There are about 36 distinct fields of data for each user. Records are added to the Story table when a new link is posted by a user. Description, media type (e.g. text), tags, and category (e.g. sports) are among items specified for each story at the time of submission. Votes to a link are recorded in another table and any click on each link is also captured. Comment records are added when a new comment is posted under a story, and CommentVote table is appended when a member Proceedings of the World Congress on Engineering 2014 Vol I,
WCE 2014, July 2 - 4, 2014, London, U.K.
ISBN: 978-988-19252-7-5
ISSN: 2078-0958 (Print); ISSN: 2078-0966 (Online)
votes for one of the comments. If multiple stories are related to the same topic, members can add a new hot topic to the Topic table.
III. METHOD
A. Dynamic Modeling Methods for Simulating Community Evolution
Two general approaches to simulating the dynamics of community evolution can be envisioned. One approach takes the community as the unit of analysis, simulating, through (potentially stochastic) differential equations, how different characteristics (e.g. number of members, activity, opinion) of the sub-communities evolve based on their online inter-actions and in the context of the online system over time. The second approach would use a bottom-up method, with the individual as the unit of analysis, and tracks through discrete event simulation how individuals activities, beliefs, and interaction patterns evolve over time within the online community.
System dynamics [5,6] provides the appropriate toolbox for the first approach. Built on the principles of control theory, this modeling method is developed to capture the dynamics of social systems. From the dynamics of growth in a constrained world [7] to diffusion of ideas and innovations [8], paradigm shift in scientific fields [9], commitment dy-namics in online communities [10], and many organizational dynamics [11, 12,13, 14], this approach has shown how accumulation processes and feedback loops explain many dy-namic social and organizational phenomena. Typical system dynamics modeling projects follow these steps: a) Problem definition b) Identification of the networks of causal factors and feedback loops relevant to the problem at hand based on literature, numerical data, expert opinion, and original case studies c) Building of a dynamic model of biological, physical, social, and behavioral processes that govern the interconnected evolution of the relevant system components d) Parameterization of this model based on the available empirical data and replication of historical trajectories e) Analysis of the model to generate insights about the most significant causal mechanisms and feedback loops, and to de-sign robust policy interventions. Sterman provides a detailed discussion of this method and reviews the relevant literature (2000)[15].
The second, individual based, approach to modeling online community dynamics can be best implemented using agent-based approaches. From the emergence of segregation to analysis of the Anasazi civilization, dynamics of markets, and diffusion of epidemics, agent-based (AB) modeling has been increasingly used to capture the dynamics of complex systems in diverse fields [16,17,18]. More closely related to this proposal, theoretically motivated agent based models have been used to study the emergence of ethnocentrism [19] and the convergence of user mental models in online com-munities [20]. This modeling approach identifies important actors and system components and their rules of interaction, then allows the simulated system to evolve based on these rules and actors. Validation is achieved through comparison of agent decision rules with empirical findings, and repli-cating aggregate historical patterns. Whereas broad model boundary and capturing multiple feedback mechanisms dis-tinguish system dynamics modeling, agent-based models
provide a platform to track and capture social networks among agents, their heterogeneity, and the stochasticity of different processes, thus growing the observed distributions bottom up [21]. Therefore system dynamics can provide more stylized insights into community evolution and agent-based modeling can get to nuanced individual-level effects that underlie the more aggregate dynamics. Rapid simulation-based optimization using Ystem Dynamics (SD) models can motivate alternative interventions in system design, which can then be further tested, before real implementation, in (computationally slower but more realistic) AB models, creating additional synergies between the two methods.
B. Empirical Setting
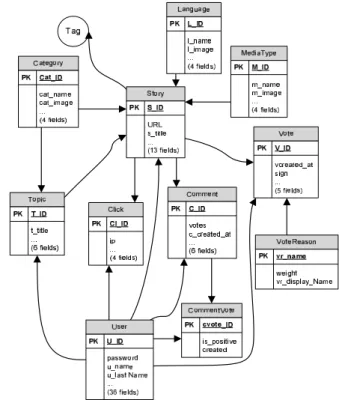
The below figure shows a simplified database structure with table names and relationships. User records are added when new users register. Records are added to the Story table when a new link is posted by a user. Description, media type (e.g. text), tags, and category (e.g. sports) are among items specified for each story at the time of submission. Votes to a link are recorded in another table and any click on each link is also captured. Comment records are added when a new comment is posted under a story, and CommentVote table is appended when a member votes for one of the comments. If multiple stories are related to the same topic, members can add a new hot topic to the Topic table.
Fig. 2. Data Structure
C. Proposed Method
We denote the set of individuals (users) by{u1, . . . , un}
and the set of items (stories) by {s1, . . . , sm} We assign a
vectorxi = [xi1, . . . , xim]T to each individual representing
its interest in the items; i.e.,xij= 1if the userui has voted
for itemsj, andxij = 0otherwise. Now, the goal is to cluster
the vectors xi’s, i= 1, . . . , n. Now, there are two parts to
Proceedings of the World Congress on Engineering 2014 Vol I, WCE 2014, July 2 - 4, 2014, London, U.K.
ISBN: 978-988-19252-7-5
ISSN: 2078-0958 (Print); ISSN: 2078-0966 (Online)
be done. First, choosing an appropriate clustering algorithm, and second, selecting an appropriate distance function that should be used by the clustering algorithm. This distance function should be chosen in such a way that results in the desired objectives mentioned in the problem formulation. We discuss these two issues in details. There are several clustering algorithms suitable for this problem. K-means algorithm is a simple and fast algorithm that can be applied to large data sets. However, it requires the number of clusters to be known a priori. Although some suggestions for the number of clusters for large data sets are proposed (e.g.pn
2),
however, clearly the number of the clusters depends on the structure of the data collected. For this problem, we use the Quality Threshold(QT) clustering algorithm, which can be considered as a generalization to the K-means algorithm. Below are the steps of a QT clustering algorithm.
• Choose a maximum diameter for the clusters (threshold)
• Build a candidate cluster for each point by iteratively adding the point with minimum increase in the diameter of the cluster, up to the point that the diameter of the cluster exceeds the threshold
• Save the cluster with maximum number of points in it
from the candidate clusters as the first cluster, remove all the points in it from the data set
• repeat the same procedure for the reduced set of points
We first implemented the above algorithm, but it was intractable for the set of data provided. Then, we simplified it by skipping the step that finds a cluster candidate for each point and then keeps the largest cluster. Instead, at each step, we select an unassigned point in the data set and establish a cluster, similar to QT, by iteratively adding the unassigned points with minimum increase in the cluster diameter up to the point before passing the diameter threshold. We remove the points in the cluster and repeat the same procedure. The resultant algorithm was quite fast and was able to cluster the sample data set in a few minutes. We have implemented this modified version of QT in MATLAB. As for the distance function, there were several choices that we thought of. One possible choice is d(xi, xj) = kxi−xjk1, where k · k1 is
the 1-norm. This basically gives the number of items on which the usersui anduj disagree. Therefore, by choosing
a thresholdδon the diameter of the clusters, one can make sure that any two users classified in the same cluster have different tastes on at mostδobjects. However, if we are more interested in similarity in voted items (and not both voted and non-voted ones), then we may defined(xi, xj)in some other
way; in this case, a good measure for similarity between to usersui anduj is the probability that an item voted by one
is also voted by the other. To formulate this, let Vi and Vj
denote the set of voted items for usersui anduj. Then, the
mentioned probability is equal to
P(s2Vi\Vj|p2Vi[Vj) = |Vi\Vj|
|Vi[Vj| (1)
= kxik1+kxjk1−kxi−xjk1 kxik1+kxjk1+kxi−xjk1 (2)
and hence the distance betweenxi andxj can be defined as
1 minus the above probability which leads to
d(xi, xj) =
2kxi−xjk1
kxik1+kxjk1+kxi−xjk1
(3)
By setting the threshold on the diameters to beδ, we make sure that for any two users in a cluster, an item voted by one of them is also voted by the other one with a probability of at least1−δ. Both distance functions proposed here are used for the provided data set.
IV. NUMERICALANALYSIS
For the data set provided, there are a total of n= 2747
users and m = 8502 items (stories). The mean of kxik1
is 36.4033, its maximum is 1108, and its minimum is 1, meaning there are users voting for over a thousand items and as low as only 1 item.
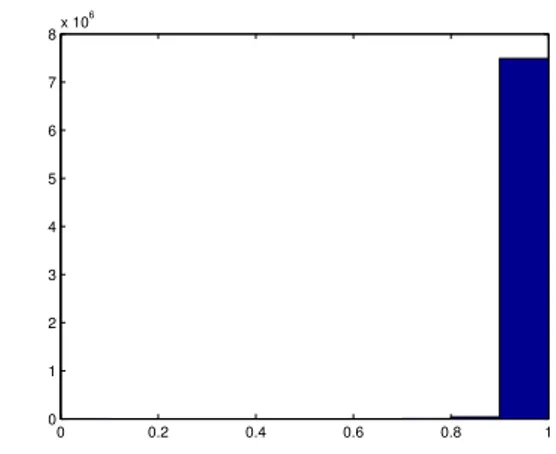
For the second distance function above (given by (3)), the histogram of the mutual distances among the users is depicted in Fig. IV. The average distance is 0.9934, meaning that for two randomly selected users it is very unlikely that an item voted by one is also voted by the other. We run the clustering program for this function and δ= 0.5 (requiring users in same cluster to be at least 50% similar). As expected, most of the clusters have just one element, having 2634 clusters for 2747 users. The cluster sizes and number of clusters of each size are listed in Table I. The runtime of the program is 125s, excluding the time required to calculate all the mutual distances between the users. This is done separately and the result is stored in a .mat file and is loaded and used in the clustering program.
0 0.2 0.4 0.6 0.8 1
0 1 2 3 4 5 6 7 8
x 106
Fig. 3. The histogram of the mutual distances between the vectors of users for the function given by (3)
TABLE I
LIST OF CLUSTER SIZES AND THE NUMBER OF CLUSTERS OF EACH SIZE FOR THE DISTANCE FUNCTION GIVEN BY(3)
Cluster size Number of clusters of each size
1 2572
2 43
3 11
4 2
5 1
6 1
7 2
11 1
12 1
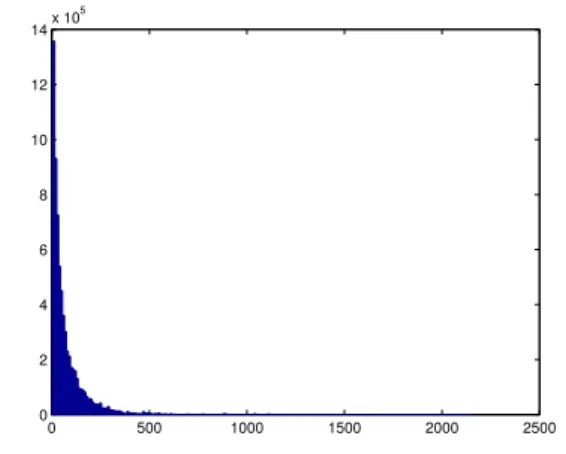
Next we use the distance functiond(xi, xj) =kxi−xjk1
for clustering. The histogram of the mutual distances among the users is depicted in Fig. IV. The average distance is 71.38, meaning that for two randomly selected users they Proceedings of the World Congress on Engineering 2014 Vol I,
WCE 2014, July 2 - 4, 2014, London, U.K.
ISBN: 978-988-19252-7-5
ISSN: 2078-0958 (Print); ISSN: 2078-0966 (Online)
disagree on 71.38 items in average. We run the clustering program for this function and δ = 35 (requiring users in same cluster to disagree on at most 35 items). The clustering takes 25s excluding the time required to calculate all the mutual distances between the users (which itself takes 530s). The cluster sizes and number of clusters of each size are listed in Table II. There are a total of 1026 clusters, with the maximum cluster having 1278 users.
0 500 1000 1500 2000 2500
0 2 4 6 8 10 12 14
x 105
Fig. 4. The histogram of the mutual distances between the vectors of users ford(xi, xj) =kxi−xjk1
TABLE II
LIST OF CLUSTER SIZES AND THE NUMBER OF CLUSTERS OF EACH SIZE FORd(xi, xj) =kxi−xjk1
Cluster size Number of Clusters of each size
1 961
2 44
3 11
4 5
5 2
8 1
349 1
1278 1
V. CONCLUSION
Social networking plays an important role in our daily life. It provides an environment to make communications among people and speeds up the process of works. Also they are powerful marketing and communication tools that companies use to contact their customers. In this research, we consider the changes in the relative size and activity of the sub-communities and we have proposed a Quality Threshold clustering for detecting online communities in a network. Two different distance functions with different interpretations are suggested and compared in a real-world data set. It is also shown that the proposals are totally different in terms of running time and clustering solutions in compare to other solutions.
ACKNOWLEDGMENT
The authors would like to thank Dr. Hazhir Rahmndad from Industrial & Systems Engineering department of Vir-ginia Tech University for designing this research question and for his note on Understanding the Dynamics of Online Communities.
REFERENCES
[1] A. Arenas and A. Fernandez,and S. Gomez, “Analysis of the structure of complex networks at different resolution levels,” New Journal of Physics, vol. 10, no. 5, pp. 53039, 2008.
[2] A. Clauset and M. E. J. Newman, “Finding community structure in very large networks,”Physical Review E, vol. 70, no. 5, pp. 53039, 2004.
[3] G. Palla, I. Derenyi, I. Farkas, T. Vicsek, “Uncovering the overlapping community structure of complex networks in nature and society,” in Nature, vol. 435, no. 7043, pp. 814–818, 2005.
[4] M. E. J. Newman, “Modularity and community structure in networks,” inProceedings of the National Academy of Sciences of the United States of America, vol. 103, no. 23, pp. 8577–8582, 2006.
[5] J.W. Forrester, “Industrial Dynamics,” inCambridge, MIT Press, 1961. [6] J. Sterman, “Business Dynamics: systems thinking and modeling for a
complex world,” inIrwin, McGraw-Hill., 2000.
[7] D. H. Meadows, J. Randers “The limits to growth : the 30-year update. White River Junction, Vt, Chelsea, 2004.
[8] J. B. Homer, “A Diffusion Model with Application to Evolving Medical Technologies,” inTechnological Forecasting and Social Change, vol. 31, no. 3, pp. 197–218, 1987.
[9] J. D. Sterman, J. Wittenberg “Path Dependence, Competition, and Succession in the Dynamics of Scientific Revolution,” inTOrganization Science, vol. 10, no. 3, pp. 322–241, 1999.
[10] P. Otto, M. Simmon “Dynamic perspectives on social characteristics and sustainability in online community networks,” inSystem Dynamics Review, vol. 24, no. 3, pp. 321–347, 2008.
[11] M. A. Sastry, “Problems and paradoxes in a model of punctuated organizational change,” inAdministrative Science Quarterly, vol. 42, no. 3, pp. 237–275, 1997.
[12] N. P. Repenning,“Understanding fire fighting in new product devel-opment,” inThe Journal of Product Innovation Management, vol. 18, no. 3, pp. 285–300, 2001.
[13] N. P. Repenning,“Capability Traps and Self-Confirming Attribution Errors in the Dynamics of Process Improvementt,” inAdministrative Science Quarterly, vol. 47, no. 3, pp. 265–295, 2002.
[14] H. Rahmandad,D. Weiss “Dynamics of concurrent software devel-opment,”System Dynamics Review, vol. 25, no. 7, pp. 224–249, 2009. [15] S. Ajorlou, I. Shamss, “Artificial bee colony algorithm for CONWIP production control system in a multi-product multi-machine manufac-turing environment,” inJournal of Intelligent Manufacturing, vol. 24, no. 6, pp. 1145–1156, 2013.
[16] S. Ajorlou, I. Shams, M. G. Arianezhad, ”Optimization of a multi-product conwip-based manufacturing system using artificial bee colony approach”, ”in Proc of the international multiconference of engineers and computer scientists (IMECS), pp. 1385–138, Hong Kong, 2011. [17] V. D. Blondel, J. L. Guillaume, “Fast unfolding of communities
in large networks,” inJournal of Statistical Mechanics: Theory and Experiment, vol. 20, no. 10, pp. 10008, 2008.
[18] L. Tesfatsion, “Economic agents and markets as emergent phenom-ena,”Proceedings of the National Academy of Sciences of the United States of America, vol. 99, no. 7, pp. 7191–7192, 2002.
[19] F. W. S Lima, T. Hadzibeganovic, “Evolution of ethnocentrism on undirected and directed Barabasi-Albert networks,”Physica a-Statistical Mechanics and Its Applications, vol. 388, no. 24, pp. 4999–5004, 2002. [20] I. Shamss, K. Shahanaghi, “Analysis of nonhomogeneous input data using likelihood ratio test,” inIn Proc of Industrial Engineering and Engineering Management, IEEM 2009. IEEE International Conference on, pp. 1780–1784, 2009.
[21] H. Rahmandad, J. Sterman, “Heterogeneity and network structure in the dynamics of diffusion: Comparing agent-based and differential equation models,” inManagement Science, vol. 54, no. 5,pp. 998–1014, 2008.
Proceedings of the World Congress on Engineering 2014 Vol I, WCE 2014, July 2 - 4, 2014, London, U.K.
ISBN: 978-988-19252-7-5
ISSN: 2078-0958 (Print); ISSN: 2078-0966 (Online)