SEARUMS: Studying Epidemiology of Avian Influenza
Rapidly Using Modeling and Simulation
Dhananjai M. Rao
∗, Alexander Chernyakhovsky
†, and Victoria Rao
‡Abstract—Effectively combating avian influenza using con-strained resources requires strategic planning and preemptive deployment of countermeasures. However, success of such proac-tive approaches is contingent on accurate and rapid forecasting of epicenters and time lines of outbreaks using epidemiological analyses. A pragmatic and effective methodology for such epi-demiological analysis is computer-based simulation. However, effectively using simulations requires a sophisticated, efficient, and user-friendly software environment for modeling, simula-tion, and analysis. Accordingly, we have developed an user-friendly, extensible, and portable software environment called SEARUMS in Java. SEARUMS enables modeling, simulation, and epidemiological analysis of avian influenza including pre-diction of time lines, epicenters, and economic impacts of dis-ease outbreaks. The analysis is performed using a compos-able, individual agent-based, spatially explicit model seeded with real world statistical data. Simulations are performed using a high performance, multi-threaded discrete event kernel built into SEARUMS. This paper presents the design and implementation of SEARUMS. The design rationale and implementation issues are discussed along with some of the lessons learned. The paper also presents experiments conducted to validate SEARUMS and verify its scalability.
Keywords: Avian Influenza, Spatially explicit model, Agent-based model, Discrete Event Simulation.
1
Introduction and Motivation
Avian influenza commonly refers to the disease caused by H5N1, a highly virulent strain of the influenza-A virus [4, 15]. It is known that the virus has become endemic to waterfowl in certain areas and it readily transmits within the Anatidae fam-ily, primarily through contaminated feed and feces [4, 11]. In spring 2006, it has been established that migrating waterfowl are the primary vectors responsible for intercontinental spread of the disease [10, 11]. The H5N1 virus readily transmits from infected waterfowl to poultry causing 100% mortality with in-cubation periods shorter than 48 hours [16]. Avian influenza has caused significant economic hardships at a global scale in the past few years [3]. Moreover, the pathogen also spreads to humans through direct contact with infected poultry and con-taminated surfaces causing human fatalities [16]. Therefore,
∗CSA Department, Miami University, Oxford, OH 45056. USA. Email:
†Mason High School, Mason, OH 45040. USA.
‡Cybernetic Evolution, Inc., Mason, OH 45040. USA. Email:
avian influenza is considered one of the most ominous threat to World economy and mankind.
Accordingly, significant effort and investments are being ex-pended to combat the disease by various international organi-zations and government agencies, including the World Health Organization (WHO) [15], Food and Agriculture Organiza-tion (FAO), and the Centers for Disease Control and Preven-tion (CDC) [4]. Currently, strategic deployment of vaccina-tions is the primary mechanism for prevention of avian in-fluenza [4, 16]. Unfortunately, a myriad of technological and socio-political issues have rendered manufacturing and distri-bution of H5N1 vaccine a significant challenge [4, 16]. Con-sequently, the only realistic approach to combat the disease is through proactive planning and strategic deployment of coun-termeasures [4, 16]. However, the success of such proactive approaches is contingent on availability and accuracy of fore-casts on epicenters and time lines of disease outbreaks.
Forecasting disease outbreaks requires comprehensive analy-sis of the disease’s epidemiology which is characterized by global, symbiotic interactions between the three main enti-ties, namely: migrating waterfowl [5, 10, 11], poultry, and humans [3]. Analyzing the epidemiology is a significant challenge due to its stochastic time dependent nature, large size, complexity, and nascence. The only realistic methodol-ogy to rapidly analyze such a complex, stochastic system is computer-based simulation. Simulation is widely employed for study and analysis of complex systems because it is a straightforward, cost effective, and non-destructive methodol-ogy for the study and analysis of a wide spectrum of systems. It enables explorations of complicated scenarios that would otherwise be difficult or impossible to analyze.
Needless to emphasize, realizing the advantages of simulation-based methodologies requires the use of an effective software environment for modeling, simulation, and analysis [12]. Specifically, in this case, the software environ-ment must be conducive for analyzing the epidemiology of avian influenza. It is imperative for the software system to be intuitive and robust to enable its use by domain experts who may not be adept programmers [12]. Moreover, the software must be portable and accessible to enable collaborative use. Currently, there is no M&S environment that is geared to ease study and analysis of epidemiology of avian influenza while satisfying the aforementioned criteria. Consequently, we have endeavored to design and develop such a software Proceedings of the World Congress on Engineering and Computer Science 2007
environment called SEARUMS.
SEARUMS is an acronym for Studying Epidemiology of Avian Influenza Rapidly Using Modeling and Simulation. It is a Java-based integrated, graphical modeling, simulation, and analysis environment that is specialized for epidemio-logical study of avian influenza. It provides an extensible, agent-based, spatially explicit modeling front-end coupled with a discrete event simulation kernel and libraries for plot-ting graphs and charts for analysis. In addition, SEARUMS also includes comprehensive models that incorporate real-world statistical data on: waterfowl migration, published by Global Register Of Migratory Species (GROMS) [6]; water-fowl species that are at higher risk to carry the virus [3]; global poultry population and distribution, published by the Food and Agriculture Organization (FAO) of the United Nations [1]; and human population in metropolitan areas of the United States, obtained from the U.S. Census Bureau. The model is stored as a portable XML document that can be readily reused and further extended.
This paper describes the design and implementation of SEARUMS. Section 2 presents some of the software environ-ments that were explored as a part of this research. These software environments also represent closely related research activities. The architecture of of SEARUMS is discussed in Section 3 along with selected implementation details. Verifi-cation of the models developed using SEARUMS is discussed in Section 4 along with performance experiments. Section 5 concludes the paper, discussing some of the lessons learned along with pointers to future work.
2
Related Research
SEARUMS leverages individual, Agent-based Spatially Ex-plicit (ASE) modeling methodology and Discrete Event Sim-ulation (DES) technique to enable epidemiological analysis of avian influenza. Impetus for such a Modeling and Simulation (M&S) approach, involving ASE models and DES, stems from its advantages [9, 12, 13] and popularity [9, 12]. Several eco-logical M&S environments and frameworks that utilize such an approach have been reported. Some of the related M&S software, that are similar to SEARUMS, are briefly described in this section. Furthermore, they are also compared and con-trasted with SEARUMS to elucidate some of the factors moti-vating the design and implementation of SEARUMS.
Railsback et alhave reviewed five popular, general purpose software platforms for scientific, agent-based M&S [12]. The platforms include NetLogo, Swarm, Swarm Java, Repast, and MASON. In their review, NetLogo was highly recommended for its ease-of-use. However, it uses a custom language for modeling and its source code is proprietary. Therefore, it poses interoperability issues. On the other hand, the latter four platforms uses traditional programming languages and source codes are freely available. These four platforms essentially provide a core framework for model development and a col-lection of library modules. The library modules are built using
the core framework and can be readily reused for modeling. SWARM, written in Objective-C, is reported to be one of the most mature environments [12]. However, Objective-C is not widely used, is not native to all platforms, and lacks developer tools [12]. SWARM Java provides a Java interface to Swarm’s Objective-C libraries to improve portability and interoperabil-ity. Nevertheless, Railsbacket alreport that Java Swarm does not combine the advantages of the two languages well. Fur-thermore, SWARM was reported to have lower performance for larger models [12]. Hence SWARM and SWARM Java were not viable candidates for developing SEARUMS, that we envision to be fast, portable, and interoperable. On the other hand, Repast and MASON are pure Java-based environments with slightly different design objectives. The focus of Repast is primarily on the domain of social science and includes tools specific to that domain [12]. MASON has been designed as a smaller and faster alternative to Repast with focus on compu-tationally demanding models. Although MASON is the fastest simulator amongst these software environments, it is the least mature and requires additional libraries for compilation. Con-sequently, the design of SEARUMS was steered away from Repast and MASON.
The High Level Architecture (HLA) and a web-enabled par-allel simulation environment called WESE [13] were also explored as potential candidates for developing simulations. HLA was disregarded because it requires a commercial Run-time Infrastructure (RTI) software and a federate library that can be cost prohibitive. WESE was not a viable alternative because it has been designed for batch simulations and does not provide an effective mechanism to interface with a GUI. The aforementioned drawbacks of various software systems motivated us to custom develop SEARUMS. The design and implementation of SEARUMS as discussed in the next sec-tion.
3
SEARUMS
SEARUMS is an acronym for Studying Epidemiology of Avian influenza Rapidly Using Modeling and Simulation. It has been developed in Java by capitalizing on many of its ob-ject oriented programming features [2]. SEARUMS is de-signed to be an user friendly, integrated, graphical model-ing, simulation, visualization, and analysis environment for conducting epidemiological analysis of avian influenza using an Agent-based, Spatially Explicit (ASE) model. These de-sign goals have been achieved by composing the system using a collection of interdependent but loosely coupled modules. Each module has a well defined functionality that can be ac-cessed and utilized via a set of Application Program Interface (API) method calls. The API of modules are essentially Java interface classes that are implemented by each module. Inter-actions between modules are performed via interface classes to ensure loose coupling. This approach permits seamless plug-n-play of modules and the environment is composed by loading suitable modules dynamically on-demand via Java’s reflection API [2]. Such an implementation approach has been Proceedings of the World Congress on Engineering and Computer Science 2007
00000000000 00000000000 00000000000
11111111111 11111111111 111111111110000000000
0000000000 0000000000
1111111111 1111111111 1111111111
0000000000 0000000000 0000000000 0000000000
1111111111 1111111111 1111111111 1111111111
000000 000000 000000 000000
111111 111111 111111 111111
000000000 000000000 000000000 000000000
111111111 111111111 111111111 111111111
000000000 000000000 000000000 000000000
111111111 111111111 111111111 111111111
000000 000000 000000 000000
111111 111111 111111 111111
Dynamic Control & Steering Module
Customizer Agent Repository
Agent
Poultry Agent
Human Agent Waterfowl
Agent
Simulation Controller
00000000000000000000000000000000000000 00000000000000000000000000000000000000 00000000000000000000000000000000000000 00000000000000000000000000000000000000
11111111111111111111111111111111111111 11111111111111111111111111111111111111 11111111111111111111111111111111111111 11111111111111111111111111111111111111
Persistence Module
1 N
Eco−description (Collection of Agent instances) Geographic
Attributes Migratory Attributes
Statistical Attributes
Group Editor
(XML−based)
Geographic
Event
Visualization & Analysis Subsystem
Attribute Editor Statistics & Charts Editor
Visualization Module
Visualization Module
Visualization Module Statistical
Time−based changes to observed parameters
Logging Module
SEARUMS
Parameters
Editor Subsystem
for analysis Group Info
Multi Threaded
Simulation Module Parameters for
Observation
G R A P H I C A L U S E R I N T E R F A C E (GUI)
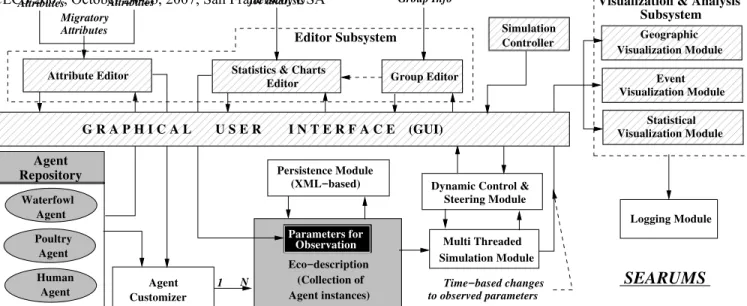
Figure 1: Architectural overview of SEARUMS. GUI modules are highlighted with a striped background. SEARUMS can be downloaded fromhttp://www.searums.org.
adopted to ease customization and extension of SEARUMS without requiring changes to its design or impacting existing modules.
An architectural overview of the modules constituting SEARUMS is shown in Figure 1. The modules can be broadly classified as core modules and Graphical User Interface (GUI) modules. The core modules of SEARUMS are Agent Reposi-tory, Agent Customizer, Persistence Module, Dynamic Con-trol & Steering Module, Simulation Module, and Logging Module. These modules provide the core M&S functionality of SEARUMS. The GUI facilitates interactions with the core modules via convenient and intuitive user interfaces. The GUI modules can be further categorized into the Editor subsystem, the Simulation Controller, and the the Visualization & Anal-ysis subsystem. SEARUMS uses the Model-View-Controller pattern to couple the core modules, the GUI models, and the Eco-description. The design permits the GUI modules to be easily replaced with a minimal command-line text interface for running SEARUMS in offline batch mode. The batch mode is useful for performing repeated runs or analyzing dif-ferent scenarios on computational clusters.
The modules and subsystems constituting SEARUMS cooper-atively operate on a shared, in-memory representation of the model called the Eco-description. The Eco-description is a centralized, memory data structure that includes all the in-formation necessary for modeling, simulation, and analysis. It is composed using a collection of Java classes and that provide efficient access to data and information required by the vari-ous modules. The primary information encapsulated by the Eco-description relates to the smart agents [8] that constitute the model. As shown in Figure 1, the agents are organized into anAgent Repositoryto facilitate instantiation and use via Java reflection API. Currently, SEARUMS includes
the following three smart agents: Waterfowl Agentthat represents a migrating waterfowl flock, Poultry Agent
that models behavior of poultry flocks, and Human Agent
that models humans. Each agent has its own behavior that reflects the characteristics of its real-world counterpart. The behaviors are customized to represent specific instances of an agent by specifying suitable values for the exposed attributes via theAttribute EditorGUI module. The attributes of an agent include:
1. Geographic attributesthat indicate the location (latitude and longitude) and logical association with countries and continents. In addition, each agent has a circle or influence that circumscribes its neighborhood.
2. Migratory attributesare specified only for agents whose location changes over the lifetime of the simulation. The migratory attributes are described as a sequence of migra-tion points. Each migramigra-tion point has geographical and chronological (arrival and departure dates) attributes asso-ciated with it. In SEARUMS, only one complete migra-tion cycle needs to be specified. The software automati-cally reuses the information to simulate annual migratory cycles.
3. Statistical attributesfor agent instances include their ini-tial population, density and distribution, iniini-tial infection percentage, infection spread parameters, incubation peri-ods, mortality rates, and population regrowth parameters.
The agents essentially implement the conceptual, mathemat-ical model of the system developed using Markov processes. They are added to a model via suitable toolbar buttons or menu options provided by SEARUMS. Agent instances are cre-ated with default attributes from the Agent Repository by the
Agent Customizermodule using Java’s reflection API. Once instantiated, the attributes for agents can be modified Proceedings of the World Congress on Engineering and Computer Science 2007
via the Attribute Editor module. The agents are implemented as a family of Java classes by extending a common base class called Agent. TheAgent class provides methods for in-teracting with the simulation kernel, inspecting the neighbor-hood, scheduling events, and interfacing with the GUI mod-ules.
The agents in a model are logically organized into hierarchi-cal sets hierarchi-called groups. SEARUMS permits multiple top-level groups with an arbitrary number of hierarchies, with one or more sub-groups at each hierarchical level. An agent can be a member of multiple groups. The groups serve several dif-ferent purposes in SEARUMS. A group can be used as a pa-rameter for statistical analysis and for plotting charts. For ex-ample, a group called “United States” can be created with 50 different sub-groups, one for each state, encompassing vari-ous agents. The main “United States” group can be selected for plotting charts and SEARUMS automatically collates and plots data for each state. Note that, even though graph plotting is restricted to one hierarchical level, statistics for plotting are collated in a recursive, depth-first manner and includes data from all agents in underlying hierarchies. A modeler can use a combination of groups to perform multi-faceted analysis at different scales. In addition, groups can be included or ex-cluded from simulations for analyzing different scenarios. The GUI modules utilize groups to provide control on visibility of agents to manage details displayed on the screen. The Group Editor module provides the user interface for managing group entries and hierarchies.
Once all the agent instances and groups have been established in a model, the parameters for observation are added to the Eco-description. These parameters are selected by the user via the Statistics & Charts Editor from a list of options. The list includes the attributes of the agents and the groups in the Eco-description. Each parameter is configured to be sampled hourly, daily, or weekly in terms of simulation time. More-over, each parameter can be subjected to statistical operations, such as sum, mean, and median. SEARUMS can dynamically (i.e.,during simulation) plot and save a variety of charts in-cluding: line graphs and pie charts. Multiple charts can be simultaneously used for analyzing a variety of data.
All of the aforementioned information is stored as an integral part of the Eco-description. The Eco-description can be saved for future reuse via thePersistence Module. The Eco-description is unmarshalled to an XML document that is com-pliant with a predefined XML schema. Serializing to an XML document has its advantages. First, it enables simple scripts to be developed that can modify specific values and perform multiple simulation runs in batch mode. Second, XML doc-uments can be readily version controlled and archived using commonly available revision control systems like CVS and Subversion. Third, it eases documentation, validation, shar-ing, and reuse of valuable domain-specific statistical data col-lated by different researchers from diverse sources. Such fea-tures play an important role in facilitating large-scale, collab-orative epidemiological studies.
The Simulation Module performs the task of conducting a Dis-crete Event Simulation (DES) using the Eco-description. This module utilizes a multi-threaded DES-kernel that manages and schedules the discrete events generated by the Agents. Multi-threading enables the DES-kernel to exploit the com-pute power of multi-processor or multi-core machines thereby reducing the wall-clock time for simulation. The number of threads spawned by the DES-kernel is configurable. Each thread processes concurrent events (events with the same timestamp) in parallel without violating the causal constraints between events. The Dynamic Control and Steering Module provides the infrastructure to control the DES-kernel. In ad-dition, it permits selected agent attributes to be modified dur-ing the course of simulation. The Simulation Controller mod-ule provides the graphical interface to the Dynamic Control & Steering Module.
4
Experiments
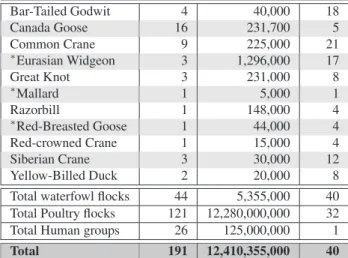
Several experiments have been conducted to evaluate the ef-fectiveness of SEARUMS. The initial experiments involved verification and validation of the simulations conducted us-ing SEARUMS. For this purpose, we have developed an Eco-description using selected, high risk species of waterfowl as reported by Hagemeijeret al[7]. Table 1 lists the waterfowl species, including high risk species [7], used in the model. The migratory flyways of the waterfowl and their population has been collated from data published by various organiza-tions [1, 4, 6, 7, 14, 15]. For modeling and simulation pur-poses the dates for migration were approximated to the middle of the months reported in the statistics. The initial positions of the flocks were set to correspond to 01/01/2006, which is the real-world time when this specific simulation is logically set to commence. The dispersion of poultry population in differ-ent contindiffer-ents has been approximated to circular regions with even density in the Eco-description [1, 9]. Poultry data has been collated from statistics published by national organiza-tions and government databases [1]. Currently, we have rep-resented human population, as reported by U.S. Census Bu-reau [14], only in 26 major metropolitan areas of the United States, approximated to circular regions. However, the Eco-description can be readily extended to include other parts of the world. Note that to the best of our knowledge, it is the most comprehensive model of its kind reported to date.
Having developed the Eco-description, we verified validity of the Eco-description by performing extensive simulations with initial source of infection set to outbreak in Indonesia [16]. We established validity of the Eco-description and SEARUMS by confirming that the timing and chronology of several out-breaks observed in the simulations correlate with significant real-world incidents as reported by WHO [16]. The data in Ta-ble 2 presents a comparison of real-world and simulated out-breaks. The data is presented for some of the significant, initial avian influenza outbreaks and not for repeated outbreaks that occur in these regions. Note that deviations of±2 weeks is ex-pected due to approximation of migration dates. In addition, Proceedings of the World Congress on Engineering and Computer Science 2007
Description of No. of Total CMP Agent Type Agents Population
Bar-Tailed Godwit 4 40,000 18
Canada Goose 16 231,700 5
Common Crane 9 225,000 21
∗
Eurasian Widgeon 3 1,296,000 17
Great Knot 3 231,000 8
∗
Mallard 1 5,000 1
Razorbill 1 148,000 4
∗
Red-Breasted Goose 1 44,000 4
Red-crowned Crane 1 15,000 4
Siberian Crane 3 30,000 12
Yellow-Billed Duck 2 20,000 8
Total waterfowl flocks 44 5,355,000 40 Total Poultry flocks 121 12,280,000,000 32
Total Human groups 26 125,000,000 1
Total 191 12,410,355,000 40
Table 1: Various agent instances used to develop the Eco-description used for experiments. Entries prefixed with ∗ in-dicate high risk waterfowl species [7]. TheCMPcolumn indi-cates the number of countries in the flocks migratory flyway. The bird population represented by a set of agents is shown in theTotal Populationcolumn.
Incident Real-world Simulated Error
Date Date (Days)
Outbreak in Indonesia 23-Jan-06 1-Jan-06 22 Infection in Iraq/Iran 1-Mar-06 25-Mar-06 24 Infection in China 27-Apr-06 2-Apr-06 -25 Infection in Egypt 11-Oct-06 14-Sep-06 -27
Table 2: Comparison of chronology of significant Real-world outbreaks with simulated outbreaks
deviations in dates also occur because the Eco-description does not include all types of migratory waterfowl flocks but only the high risk species. However, the sufficiently close concordance between simulated and real-world outbreaks es-tablishes validity and effectiveness of SEARUMS. Moreover, it significantly increases confidence in inferences drawn from the simulation. Currently, a variety of case studies using SEARUMS are already underway to predict and avert a pan-demic.
The validated Eco-description was also used to conduct scal-ability and performance evaluation of SEARUMS. The model was simulated using a varying number of threads on a Sun Netra-T12 SMP workstation with eight 1.2 GHz SPARCv9 processors with 16 gigabytes of RAM running Solaris 9. These simulations were conducted by running SEARUMS in batch mode, without any GUI overhead. The core statistics collated from these experiments are shown in Table 3. The CPU Utilization value indicates the actual amount of computa-tional power utilized by the simulations. The maximum value of CPU utilization is 800 for this workstation. The last column
250 300 350 400 450 500 550
1 2 3 4 5 6 7 8
Time for Simulation (sec)
Number of Threads SUN Netra-T12
(a) Sun Netra-T12
180 200 220 240 260 280 300 320
0 1 2 3 4 5
Time for Simulation (sec)
Number of Threads Windows
Linux
(b) PC (Windows & Linux)
Figure 2: Influence of number of threads on wall-clock time for simulation on different hardware platforms and operating systems.
in Table 3 presents the average number of events processed by each thread in the simulation. The of total number of events in each simulation is 21,045,540. The data in Table 3 indi-cates that as the number of threads are increased, the threads share the workload involved in processing the events; thereby leveraging the computational capabilities of the workstation.
The graph in Figure 2(a) plots the wall-clock time taken to complete the same simulation using different number of threads. As shown by the curve, initially the time taken for simulation reduces as the number of threads are increased. The wall-clock time decreases because the threads run in parallel on the multi-processor machine and rapidly process concurrent events. The performance improves as the num-ber of threads is increased from one to three highlighting SEARUMS’ scalability. However, the performance decreases as the number of threads are further increased. The deterio-ration occurs because the model used in this experiment does not have sufficient, inherent concurrency to leverage the avail-able compute power. In other words, multi-threading over-heads supersede the gains accrued using several threads. The plateauing CPU utilization data shown in the third column of Table 3 confirm that this specific simulation does not require more than three CPUs. On the other hand, larger models with more concurrency will benefit from the scalable design. This experiment highlights the scalability and performance aspects of SEARUMS design. In addition it illustrates its potential use in high performance computational workstations for conduct-ing large-scale epidemiological analysis.
#Threads Time CPU
(Secs) Usage
1 391 101.5
2 278 192.1
3 263 267.9
4 382 287.7
6 504 267.6
8 494 278.5
Table 3: Scalability and performance statistics collated from simulations conducted on a Sun Netra-T12.
. Proceedings of the World Congress on Engineering and Computer Science 2007
#Threads Time (Secs) CPU Usage Windows Linux Windows Linux
1 310 248 - 100
2 199 186 - 177
3 222 214 - 142
4 228 229 - 138
Table 4: Simulation statistics collated on a PC running Linux or Windows. The CPU usage under Windows is not available. The maximum possible CPU usage is 200, 100 per core.
The aforementioned Eco-description was also used to conduct performance test simulations on a conventional personal com-puter (PC). The PC had a dual-core, 64-bit Turion processor running at 2 GHz with 2 GB of memory. The PC was setup to a dual-boot configuration enabling it to run Windows XP (32-bit) or Linux (Fedora Core 7). Table 4 tabulates the various statistics collated from simulations conducted using a vary-ing number of threads. Note that the hardware configuration was the same but different operating systems were used. As illustrated by Table 4, the statistics under the two operating systems closely match with each other. The data indicates that SEARUMS operates consistently on the commonly used plat-forms. The graph in Figure 2(b) plots the wall-clock time for simulation. The performance curves mirror the graph in Fig-ure 2(b). Similarity, in the characteristics further highlights the scalability and portability of SEARUMS from high perfor-mance workstations to conventional PCs. Simulations involv-ing more than 20 million events complete within 4 minutes in optimal configurations demonstrating that SEARUMS en-ables rapid epidemiological analysis of avian influenza. Fur-thermore, the experiments provide empirical evidence that the design goals of SEARUMS have been successfully achieved.
5
Conclusion
This paper discussed the issues involved in the design and implementation of a Java-based modeling, simulation, and analysis environment called SEARUMS. SEARUMS has been designed to facilitate epidemiological analysis of avian in-fluenza. It permits an agent-based, spatially explicit model of avian influenza to be developed using an intuitive Graphical User Interface (GUI). SEARUMS does not require any special computing infrastructure or programming knowledge. The verification experiments presented in this paper highlight that the models developed using SEARUMS closely reflect real world scenario. The simulation provides accurate time lines and locations of outbreaks. Such information is invaluable to epidemiologists and disease control centers. In addition, SEARUMS also provides an offline batch mode for conduct-ing large-scale analysis usconduct-ing high performance computational workstations to analyze various scenarios. Ability to rapidly analyze various scenarios using calibrated models empowers researchers, epidemiologists, and disease control centers with timely information on outbreaks. The Eco-description devel-oped using SEARUMS embodies a broad range of
informa-tion and statistics which by itself is valuable. In addiinforma-tion, the Eco-description can be readily extended, shared, and reused. Consequently, experts from multiple domains can collabora-tively use SEARUMS to perform various types of analysis on a global scale, assess threats, and measure effectiveness of countermeasures. We are optimistic that the proposed soft-ware environment will enable mankind to strategically invest precious time and resources to combat Avian influenza, min-imize its impacts on human life and global economy thereby averting a pandemic.
References
[1] Animal Production and Health Division of Food and Agricul-ture Organization of the United Nations. Global Livestock Pro-duction and Health Atlas (GLiPHA).
[2] J. Bloch.Effective Java – Programming Language Guide. Pear-son, Prentice Hall, 200 Old Tappan Road, NJ 07675, USA, first edition, 2001.
[3] M. Brahmbhatt. Economic impacts of avian influenza propa-gation. InFirst International Conference On Avian Influenza in Humans, June 2006.
[4] Centers for Disease Control and Prevention. Avian influenza: Current situation, August 2006.
[5] H. Chen, G. Smith, S. Y. Zhang, K. Qin, J. Wang, and K. S. Li. Avian flu: H5n1 virus outbreak in migratory waterfowl.
Nature, 436:191–192, July 2005.
[6] GROMS: Global Register of Migratory Species. Summaris-ing knowledge about migratory species for conservation, April 2006.
[7] W. Hagemeijer and T. Mundkur. Migratory flyways in europe, africa, and asia and the spread of HPAI H5N1. In Interna-tional Scientific Conference On Avian Influenza and Wild Birds, Rome, Italy, May 2006. FAO and OIE.
[8] M. Hare and P. J. Deadman. Further towards a taxonomy of agent-based simulation models in environmental management.
Mathematics and Computers in Simulation, 64(1):25–40, 2004. [9] R. Law, U. Dieckmann, and J. A. Metz.The Geometry of Eco-logical Interactions: Simplifying Spatial Complexity. Cam-bridge University Press, 32 Avenue of the Americas, New York, NY 10013-2473, USA, 2005.
[10] J. Liu, H. Xiao, F. Lei, Q. Zhu, K. Qin, X. w. Zhang, X.-I. Zhang, D. Zhao, G. Wang, Y. Feng, J. Ma, W. Liu, J. Wang, and G. F. Gao. Highly pathogenic H5N1 influenza virus infection in migratory birds.Science, 309(5738):1206, Aug. 2005. [11] D. Normile. Avian influenza: Evidence points to migratory
birds in H5N1 spread.Science, 311(5765):1225, Mar. 2006. [12] S. F. Railsback, S. L. Lytinen, and S. K. Jackson. Agent-based
simulation platforms: Review and development recommenda-tions.Simulation, 82(9):609–623, Sept. 2006.
[13] D. M. Rao and P. A. Wilsey. Accelerating spatially explicit sim-ulations of spread of lyme disease. InProceedings of the 38th Annual Simulation Symposium, pages 251–258, San Diego, California, USA, Apr. 2005.
[14] U.S. Census Bureau. 100 largest counties, July 2006. [15] World Health Organization. Avian influenza, July 2006. [16] World Health Organization. Avian influenza: Situation
up-dates, April 2007.