HESSD
11, 6843–6880, 2014Coupling an LSM with a crop model to
improve ET estimations
G. M. Tsarouchi et al.
Title Page
Abstract Introduction
Conclusions References
Tables Figures
◭ ◮
◭ ◮
Back Close
Full Screen / Esc
Printer-friendly Version Interactive Discussion
Discussion
P
a
per
|
Discus
sion
P
a
per
|
Discussion
P
a
per
|
Discussion
P
a
per
|
Hydrol. Earth Syst. Sci. Discuss., 11, 6843–6880, 2014 www.hydrol-earth-syst-sci-discuss.net/11/6843/2014/ doi:10.5194/hessd-11-6843-2014
© Author(s) 2014. CC Attribution 3.0 License.
This discussion paper is/has been under review for the journal Hydrology and Earth System Sciences (HESS). Please refer to the corresponding final paper in HESS if available.
Coupling a land surface model with a crop
growth model to improve ET flux
estimations in the Upper Ganges basin,
India
G. M. Tsarouchi1,2, W. Buytaert1,2, and A. Mijic1
1
Department of Civil and Environmental Engineering, Imperial College London, London, UK 2
Grantham Institute for Climate Change, Imperial College London, London, UK
Received: 3 June 2014 – Accepted: 13 June 2014 – Published: 26 June 2014
Correspondence to: G. M. Tsarouchi (g.tsarouchi11@imperial.ac.uk)
HESSD
11, 6843–6880, 2014Coupling an LSM with a crop model to
improve ET estimations
G. M. Tsarouchi et al.
Title Page
Abstract Introduction
Conclusions References
Tables Figures
◭ ◮
◭ ◮
Back Close
Full Screen / Esc
Printer-friendly Version Interactive Discussion
Discussion
P
a
per
|
Discus
sion
P
a
per
|
Discussion
P
a
per
|
Discussion
P
a
per
|
Abstract
Land surface models are tools that represent energy and water flux exchanges be-tween land and the atmosphere. Although much progress has been made in adding de-tailed physical processes into these models, there is much room left for improved esti-mates of evapotranspiration fluxes, by including a more reasonable and accurate
repre-5
sentation of crop dynamics. Recent studies suggest a strong land surface–atmosphere coupling over India and since this is one of the most intensively cultivated areas in the world, the strong impact of crops on the evaporative flux cannot be neglected. In this study we dynamically couple the land surface model JULES with the crop growth model InfoCrop. JULES in its current version does not simulate crop growth. Instead,
10
it treats crops as natural grass, while using prescribed vegetation parameters. Such simplification might lead to modelling errors. Therefore we developed a coupled mod-elling scheme that simulates dynamically crop development and parameterised it for the two main crops of the study area, wheat and rice. This setup is used to examine the impact of inter-seasonal land cover changes in evapotranspiration fluxes of the
Up-15
per Ganges river basin (India). The sensitivity of JULES with regard to the dynamics of the vegetation cover is evaluated. Our results show that the model is sensitive to the changes introduced after coupling it with the crop model. Evapotranspiration fluxes, which are significantly different between the original and the coupled model, are giv-ing an approximation of the magnitude of error to be expected in LSMs that do not
20
include dynamic crop growth. For the wet season, in the original model, the monthly Mean Error ranges from 7.5 to 24.4 mm m−1, depending on di
fferent precipitation forc-ing. For the same season, in the coupled model, the monthly Mean Error’s range is reduced to 7–14 mm m−1. For the dry season, in the original model, the monthly
Mean Error ranges from 10 to 17 mm m−1, depending on di
fferent precipitation
forc-25
ing. For the same season, in the coupled model, the monthly Mean Error’s range is reduced to 1–2 mm m−1. The new modelling scheme, by o
HESSD
11, 6843–6880, 2014Coupling an LSM with a crop model to
improve ET estimations
G. M. Tsarouchi et al.
Title Page
Abstract Introduction
Conclusions References
Tables Figures
◭ ◮
◭ ◮
Back Close
Full Screen / Esc
Printer-friendly Version Interactive Discussion
Discussion
P
a
per
|
Discus
sion
P
a
per
|
Discussion
P
a
per
|
Discussion
P
a
per
|
of evapotranspiration estimations, is an important step towards a better understanding of the two-way crops–atmosphere interactions.
1 Introduction
In recent years, much progress has been made in developing sophisticated Land Sur-face Models (LSMs), which are able to represent biophysical and hydrological
pro-5
cesses of the land surface as well as their interaction with the atmosphere. However, one of the significant problems remaining to be addressed is the adequate representa-tion of evapotranspirarepresenta-tion (ET), which is the primary source of water transport from the land surface to the atmosphere.
Land surface processes are intrinsically coupled with the atmosphere; changes in
10
climate factors affect the vegetation dynamics and vice-versa. Nowadays, it is common practice that LSMs are driven with prescribed vegetation dynamics. Vegetation param-eters such us Leaf Area Index (LAI), root depth and canopy height are obtained offline and they either remain constant throughout the entire simulation period or can vary temporally and/or spatially depending on data availability prior to the simulation.
How-15
ever, such a simplified approach is expected to have a negative impact on the LSM’s performance by affecting the simulated ET fluxes and ultimately obstructing weather and climate predictions and assessment of their impact on water resources.
This is especially the case in the Ganges basin, a region which experiences mon-soon flooding almost every year (e.g., the summer 2013 floods over northern India). In
20
that region, the need for better predictions of the water resources regime and under-standing of the land surface–atmosphere interactions is very important. Recent stud-ies have shown that there is evidence of strong coupling between the land surface (soil moisture) and atmosphere (precipitation). In the simplest sense, changes in near-surface soil moisture alter the partitioning between sensible and latent heat fluxes at
25
HESSD
11, 6843–6880, 2014Coupling an LSM with a crop model to
improve ET estimations
G. M. Tsarouchi et al.
Title Page
Abstract Introduction
Conclusions References
Tables Figures
◭ ◮
◭ ◮
Back Close
Full Screen / Esc
Printer-friendly Version Interactive Discussion
Discussion
P
a
per
|
Discus
sion
P
a
per
|
Discussion
P
a
per
|
Discussion
P
a
per
|
increased humidity and reduced temperatures near the surface followed by lower ac-tual and potential evaporation. These changes can lead to local feedbacks in cloud formation and convection. Local feedbacks on convection have already been observed elsewhere in the tropics (e.g., in the Sahel Taylor and Ellis, 2006). However, feedbacks may apply also on larger spatio-temporal scales. Much evidence already suggests that
5
land–surface conditions in the Indo-Gangetic Plains are coupled to precipitation pat-terns. In early modelling experiments, Meehl (1994) showed the influence of the land surface on the Asian monsoon through changes in soil moisture and precipitation. More recently, several studies of the Global Land–Atmosphere Coupling Experiment (GLACE Koster et al., 2004, 2006; Guo et al., 2006; Seneviratne et al., 2006), based on an
en-10
semble of 12 atmospheric general circulation models, identified northern India as one of five global hotspots of land–atmosphere coupling strength during the boreal summer. This is also consistent with evidence of soil moisture feedbacks enhancing monsoon variability in West Africa (Lavender et al., 2010). Turner and Annamalai (2012) identify the South Asian monsoon as a fully coupled ocean–land–atmosphere while previous
15
studies found that croplands play an important role in determining the local climate. Krishna Kumar et al. (2004) found strong linkages between Indian monsoon rainfall variations and Indian crop yield. Further, Osborne et al. (2009) showed that there is a strong feedback of crops to the climate of seasonally arid climates. In the humid trop-ical regions (such as India), inter-annually varying crops were found to alter the mean
20
climate. Therefore, there is added complexity to the classical theory supporting that the strength of the Indian monsoon system is a consequence of the land–sea temperature contrast.
To overcome this limitation, several recent studies achieved dynamical coupling of LSMs, climate or hydrological models with crop growth models (Boegh et al., 2004;
25
HESSD
11, 6843–6880, 2014Coupling an LSM with a crop model to
improve ET estimations
G. M. Tsarouchi et al.
Title Page
Abstract Introduction
Conclusions References
Tables Figures
◭ ◮
◭ ◮
Back Close
Full Screen / Esc
Printer-friendly Version Interactive Discussion
Discussion
P
a
per
|
Discus
sion
P
a
per
|
Discussion
P
a
per
|
Discussion
P
a
per
|
2011). The novelty of our approach lies in the combination of the following points: (1) We attempt to quantify the potential error in ET estimations of LSMs with no dynamic vegetation, by comparing the pro-coupling and post-coupling modelling results; Most of previous studies did not show modelling results before the coupling. This allows us to test the sensitivity of an LSM with regard to the dynamics of the vegetation cover.
5
(2) The large spatial scale of the application. Most of the past studies are focused on small scales, or even point scales, and validated their results against flux tower sites. The extent of the agricultural areas such as the Ganges basin, and the lack of in situ measurements make it a very challenging research environment. (3) The specific focus on impact on evaporative flux, contrasting to most coupling studies that focus on LAI,
10
crop yield and/or soil moisture fluxes.
This research aims to propose a fully coupled land surface – crop growth model in order to improve representation of vegetation dynamics and simulation of fluxes over croplands. The variations between ET fluxes from an LSM with and without dynamic crop growth are calculated as an indicator of potential uncertainties in the model
esti-15
mates. The new modelling scheme will allow for further examination of the role of land surface properties on atmospheric conditions, including human activities such as irriga-tion practices. The following hypothesis drives the research: “Accounting for dynamic crop growth in an LSM will significantly improve the representation of soil and land– surface processes and will give us insights in the sensitivity of ET fluxes in complex
20
agricultural regions such as the Ganges basin”.
We apply the land surface model JULES (Best et al., 2011; Clark et al., 2011) in order to investigate the impact of inter-seasonal land cover changes in the ET fluxes of the Upper Ganges (UG) river basin in India. However, JULES in its current version does not simulate crop growth. Instead C3 grass is typically used as proxy for annual
25
HESSD
11, 6843–6880, 2014Coupling an LSM with a crop model to
improve ET estimations
G. M. Tsarouchi et al.
Title Page
Abstract Introduction
Conclusions References
Tables Figures
◭ ◮
◭ ◮
Back Close
Full Screen / Esc
Printer-friendly Version Interactive Discussion
Discussion
P
a
per
|
Discus
sion
P
a
per
|
Discussion
P
a
per
|
Discussion
P
a
per
|
properties of the land surface and the bio-geochemical cycles, causing feedbacks to the climate (den Hoof et al., 2011). Given that the larger part (60 %) of the UG basin is occupied by agriculture, such simplification (C3grass as a proxy for annual crops) is
expected to lead to errors in the model’s results.
In order to overcome this problem, JULES was coupled with the crop growth model
5
InfoCrop (Aggarwal et al., 2006). This coupled system will allow the consistent varia-tion of variables during the simulavaria-tion period. The model was parameterised for the two main crops of the UG basin (wheat and rice) to capture well the inter-annual variations in land surface processes with subroutines that represent crop growth using a daily time step from sowing to maturity. A crop calendar based on available data was developed
10
and added to the coupled system, informing it for the crop type, sowing and harvest dates and fallow land periods, allowing for 2 cropping seasons per year. The sensitivity of JULES with regard to the dynamics of the vegetation cover is tested. The discrep-ancy between the original and the coupled modelling schemes gives an approximation of the uncertainty in the ET results derived by an LSM with no dynamic vegetation.
15
This study attempts to quantify the potential error in surface flux estimations of global land–surface models because of not taking into account dynamic crop development. The dynamic coupling of an LSM with a crop growth model is expected to improve the modelling of ET fluxes, whilst having a direct impact on climate factors. This will facilitate the understanding of land–atmosphere interactions and essentially lead to
20
improved weather and climate predictions as well as a more adequate interpretation of their impacts on water resources.
2 Study area and data description
In recent decades the Indian subcontinent has undergone substantial environmental change. Agricultural land areas expanded to meet the demands of a rapidly increasing
25
HESSD
11, 6843–6880, 2014Coupling an LSM with a crop model to
improve ET estimations
G. M. Tsarouchi et al.
Title Page
Abstract Introduction
Conclusions References
Tables Figures
◭ ◮
◭ ◮
Back Close
Full Screen / Esc
Printer-friendly Version Interactive Discussion
Discussion
P
a
per
|
Discus
sion
P
a
per
|
Discussion
P
a
per
|
Discussion
P
a
per
|
the most densely populated and intensively cultivated areas in the world. More than 400 million people depend on monsoon rainfall for their livelihood.
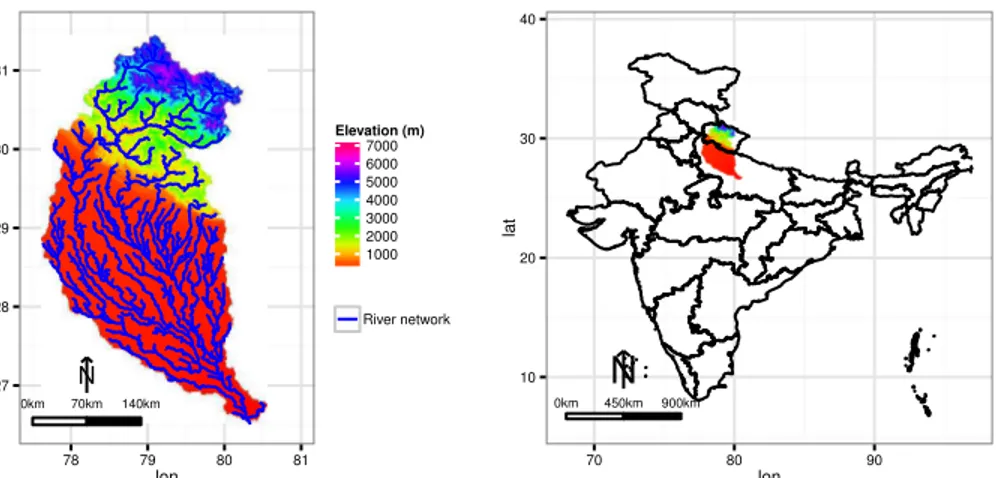
The study area, located in Northern India, is part of the UG basin, which corre-sponds to the upper main branch of the river Ganges and covers an area of 87 000 km2 (Fig. 1). The river Ganges originates in the Himalayas and when it reaches the plains,
5
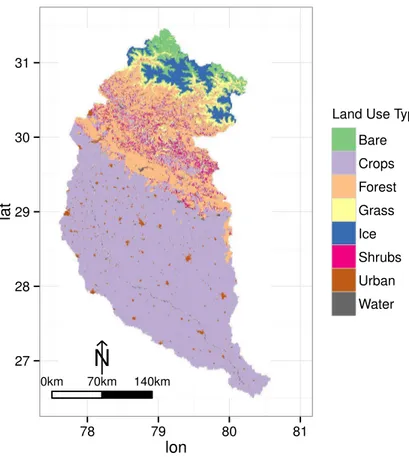
it becomes subject to a vast irrigation demand as 60 % of the basin is occupied by agri-culture (Tsarouchi et al., 2014). As the focus of our study is on improving crop growth simulation, we decided to apply our model only in the areas occupied by agriculture. Hence, from now on as study area we refer to the crop covered areas of the UG basin, as shown in Fig. 2. The two main crops grown in that region are wheat and rice. In
10
Uttar Pradesh (i.e the district the study area belongs to), rice is predominantly rain fed and depends largely on the monsoon season rains from June to September (USDA-I, 2013). However, the intensive wheat/rice crop rotation in the area is responsible for soil degradation which causes drops in the water table levels in some areas and water logging in others (USDA-I, 2013).
15
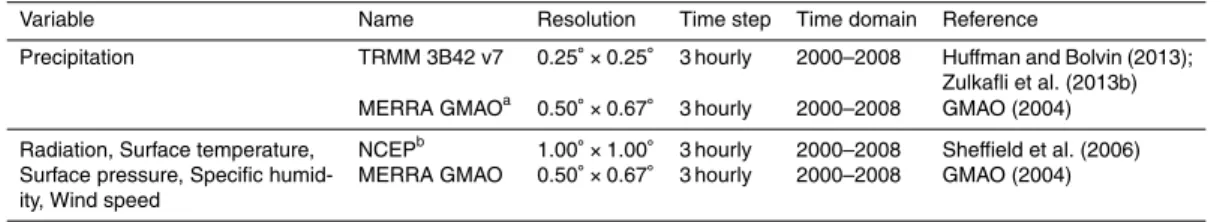
Meteorological data required for the modelling experiments include precipitation, in-coming short-wave and long-wave radiation, surface pressure, temperature, specific humidity and wind speed. The different meteorological datasets used to drive the mod-els are summarized in Table 2. All datasets were further rescaled to the spatial scale of the JULES implementation, i.e. 0.1◦
×0.1◦.
20
The land cover representation is based on high-resolution land cover maps for north-ern India, developed by the authors (Tsarouchi et al., 2014) and based on Landsat satellite imagery.
Soil parameters were created using the pedotransfer functions developed by Cosby et al. (1984). The functions use clay, silt and sand fractions in the soil, which are
avail-25
HESSD
11, 6843–6880, 2014Coupling an LSM with a crop model to
improve ET estimations
G. M. Tsarouchi et al.
Title Page
Abstract Introduction
Conclusions References
Tables Figures
◭ ◮
◭ ◮
Back Close
Full Screen / Esc
Printer-friendly Version Interactive Discussion
Discussion
P
a
per
|
Discus
sion
P
a
per
|
Discussion
P
a
per
|
Discussion
P
a
per
|
developed as part of the NASA/EOS project to estimate global terrestrial ET by us-ing satellite remote sensus-ing data. The dataset covers the time period 2000–2010 in a spatial resolution of 1 km. It was developed using Mu et al. (2011) improved ET algo-rithm over a previous Mu et al. (2007) paper. The algoalgo-rithm is based on the Penman– Monteith (Penman, 1948) approach. The input data used to develop the MODIS ET
5
product include: MODIS land cover type (MOD12Q1) (Friedl et al., 2002); MODIS FPAR/LAI (MOD15A2) (Myneni et al., 2002); MODIS albedo (Lucht et al., 2000; Jin et al., 2003); and NASA’s MERRA GMAO (GEOS-5) daily meteorological reanalysis data from 2000 to 2010. In order to make the comparison of our models’ outputs with the MODIS product as meaningful as possible: (a) we made sure that our study area
10
corresponds to 100 % agricultural area in the MODIS land cover maps and (b) we ran a set of simulations with the same meteorological reanalysis dataset that was used for the development of MODIS ET. In the original JULES, LAI remained constant within the entire simulation whereas in the coupled model, LAI was calculated on a daily ba-sis from the crop model and passed into JULES (more details regarding the coupling
15
process are available in the following Sect. 3.3).
The LandFlux-EVAL dataset was generated as part of the LandFlux-EVAL initiative of the GEWEX Data and Assessment Panel (GDAP). Mueller et al. (2013) evaluated and compared existing land ET products and generated global merged benchmark products based on the analysis of the already existing datasets. The product covers the periods
20
of 1989–1995 and 1989–2005, at a monthly time-scale and a 1◦resolution. In this study
we used the 1989–2005 period dataset which is based on a total of 14 datasets. In the individual datasets, ET is derived from satellite and/or in situ observations or calculated via LSMs driven with observations-based forcing or output from atmospheric reanalysis models (Mueller et al., 2013).
25
HESSD
11, 6843–6880, 2014Coupling an LSM with a crop model to
improve ET estimations
G. M. Tsarouchi et al.
Title Page
Abstract Introduction
Conclusions References
Tables Figures
◭ ◮
◭ ◮
Back Close
Full Screen / Esc
Printer-friendly Version Interactive Discussion
Discussion
P
a
per
|
Discus
sion
P
a
per
|
Discussion
P
a
per
|
Discussion
P
a
per
|
3 Model description
3.1 JULES land surface model
JULES, the Joint UK Land Environment Simulator, (Best et al., 2011; Clark et al., 2011) is a physics-based model which is used as the land surface scheme of the UK Met Office’s Unified Modelling system.
5
The model partitions precipitation into canopy interception and throughfall. In the default runoffscheme, surface runoffis generated based on Hortonian Infiltration and saturation excess mechanisms. Surface heterogeneity within JULES is represented by the tile approach (Essery et al., 2003). The surface of each grid-box comprises fractions of 9 different surface types; five vegetated Plant Functional Types (PFTs): broad-leaf
10
trees, needle-leaf trees, C3 grasses, C4 grasses and shrubs and four non-vegetated:
urban, water, bare soil and ice. For each surface type of the grid-box, a separate sur-face energy balance is solved, and a weighted average is calculated from the individual surface fluxes for each grid-box. In the subsurface, the soil column is divided into 4 lay-ers, which have a thickness of 0.1, 0.25, 0.65, and 2 m respectively, going from the
15
top to the bottom. The Darcy–Richards equation (Richards, 1931) is solved using finite difference approximation, to calculate water movement through the soil. Subsurface runoffis represented as free drainage from the deepest soil layer. The soil water re-tention characteristics follow the relationships of van Genuchten (1980). A structural limitation of the current JULES version is that there is no subsurface grid heterogeneity
20
such as the surface grid heterogeneity.
The input meteorological data requirements are time-series of incoming shortwave and longwave radiation, precipitation, temperature, specific humidity, wind speed, and surface pressure. They are used in a full energy balance equation that consists of radiation, sensible heat, latent heat, canopy heat, and ground surface heat components
25
(Zulkafli et al., 2013a).
HESSD
11, 6843–6880, 2014Coupling an LSM with a crop model to
improve ET estimations
G. M. Tsarouchi et al.
Title Page
Abstract Introduction
Conclusions References
Tables Figures
◭ ◮
◭ ◮
Back Close
Full Screen / Esc
Printer-friendly Version Interactive Discussion
Discussion
P
a
per
|
Discus
sion
P
a
per
|
Discussion
P
a
per
|
Discussion
P
a
per
|
exchange processes through an integrated coupling. The Penman–Monteith (Penman, 1948) approach is used to estimate potential evaporation. Canopy evaporation (inter-ception storage) is assumed to occur at the potential rate, while plant transpiration from root water uptake from all 4 soil layers (vegetated areas) and bare soil evaporation from the top soil layer are restricted by stomatal resistance and the soil moisture state,
re-5
spectively (Zulkafli et al., 2013a). The stomatal resistance is also responsible for the regulation of CO2exchange between plants and the atmosphere (Cox et al., 1998).
Because the model does not simulate crop growth, crop areas are treated as natural grass (den Hoof et al., 2011). Vegetation parameters such us Leaf Area Index (LAI), root depth and canopy height are obtained off-line and they either remain constant
10
throughout the entire simulation period or can vary temporally and/or spatially (apart from the root depth which cannot vary spatially) depending on data availability prior to the simulation. Root depth and density determine the ability of vegetation to access moisture at each level in the soil (Best et al., 2011). LAI, which illustrates the density of the leaves, is an important parameter as it contributes to the latent heat flux
calcula-15
tion by determining the relative fractions of ET and bare soil evaporation in vegetative surfaces (Best et al., 2011). Canopy coverage, which is a function of LAI, influences the albedo calculation. In addition, for vegetated surfaces, the maximum amount of water that can be held by the canopy is a linear function of LAI. Thus, a simplified approach that does not allow for constant evolving of those parameters is expected to
20
have a negative impact in the model’s performance. In JULES, canopy capacityCmis computed as:
Cm=0.5+0.05LAI (1)
Where 0.5 kg m−2is the minimum water interception due to puddling of water on the soil
25
HESSD
11, 6843–6880, 2014Coupling an LSM with a crop model to
improve ET estimations
G. M. Tsarouchi et al.
Title Page
Abstract Introduction
Conclusions References
Tables Figures
◭ ◮
◭ ◮
Back Close
Full Screen / Esc
Printer-friendly Version Interactive Discussion
Discussion
P
a
per
|
Discus
sion
P
a
per
|
Discussion
P
a
per
|
Discussion
P
a
per
|
(as has also been suggested by den Hoof et al., 2013). For a more detailed description of the model see Best et al. (2011).
3.2 Crop growth model
The functions used to calculate crop development, crop growth, LAI and root depth are based on InfoCrop (Aggarwal et al., 2006), a crop growth model which has been
5
parametrised for Indian soils and crop systems. The model simulates crop develop-ment, photosynthesis, dry matter production and its partitioning, leaf area growth, ET etc. in response to the effects of weather, soil properties, sowing dates and crop phys-iology. Similarly to JULES, the Penman–Monteith (Penman, 1948) approach is used to calculate potential ET. In the subsurface, the soil column is divided into 3 layers and
10
a tipping bucket approach is followed for the soil water balance. Transpiration is
cal-culated as a function of the water availability in the soil, represented by water stress factors for each soil layer. The values of water stress factors range between 0 and 1. The water contents at wilting point, critical point and saturation as well as the water content in each soil layer are required to calculate the water stress factors. Total water
15
uptake is calculated based on the water stress factors of individual soil layers. Photo-synthesis is highly sensitive to water stress. Under insufficient water supply conditions, CO2assimilation rate (photosynthesis) and stomatal conductance decrease rapidly be-low the potential rates.
The major photosynthesising organs are leafs. The calculation of the
photosyntheti-20
cally active radiation absorbed by the surface area of green leafs is highly dependent on the LAI. This highlights that for optimized crop growth modelling, the most essen-tial requirement is a correct simulation of the time course of LAI. After crop emer-gence, the main parameters affecting leaf area expansion are temperature and light intensity. In the early stage of juvenile growth, the increase of leaf area over time is
25
HESSD
11, 6843–6880, 2014Coupling an LSM with a crop model to
improve ET estimations
G. M. Tsarouchi et al.
Title Page
Abstract Introduction
Conclusions References
Tables Figures
◭ ◮
◭ ◮
Back Close
Full Screen / Esc
Printer-friendly Version Interactive Discussion
Discussion
P
a
per
|
Discus
sion
P
a
per
|
Discussion
P
a
per
|
Discussion
P
a
per
|
of leaves in InfoCrop is also dependent on ageing, nitrogen mobilization, temperature, water stress and death due to pests and diseases (Aggarwal et al., 2006).
In InfoCrop, canopy interception is assumed to be equivalent to 25 % of the value of LAI at any given time (Penning de Vries et al., 1989).
Root depth extension rate is affected by soil water stress, soil bulk density, potential
5
maximum rooting depth and temperature (low temperatures reduce growth). The max-imum rooting depth varies as a function of thermal time to anthesis; the longer the crop duration the deeper the roots would go in the soil. If the roots reach a soil layer with moisture content at or below wilting point, root growth is interrupted. Moisture content near wilting point causes a very low water uptake rate and that leads to insufficient
en-10
ergy production for maintenance respiration by photosynthesis. In such case the crop dies. Otherwise, root growth continues until a crop-specific development stage.
The model separates between 3 development stages: (a) seedling emergence, (b) anthesis and (c) maturity. Under temperate climate conditions, the development rate is mainly affected by temperature.
15
For a more detailed description of the model see Aggarwal et al. (2006).
3.3 Model coupling
The distributed version of JULES was run with a resolution of 0.1◦ and an hourly time
step while InfoCrop was run at a daily time step. To ensure agreement in calculations, the same meteorological and soil datasets were used for both models.
20
In the coupled version, the full energy balance scheme of JULES was used to cal-culate water exchange between soil layers, land–atmosphere heat flux exchange, ET etc. in each time step. Every 24 time steps of JULES (i.e. 1 day), the following val-ues (daily averaged) were passed to the crop model: moisture content, ET, volumetric water content at critical point, at saturation and at wilting point, (of each soil layer).
25
HESSD
11, 6843–6880, 2014Coupling an LSM with a crop model to
improve ET estimations
G. M. Tsarouchi et al.
Title Page
Abstract Introduction
Conclusions References
Tables Figures
◭ ◮
◭ ◮
Back Close
Full Screen / Esc
Printer-friendly Version Interactive Discussion
Discussion
P
a
per
|
Discus
sion
P
a
per
|
Discussion
P
a
per
|
Discussion
P
a
per
|
day of the simulation (see Fig. 3 for a flow chart of the coupled system). The coupled JULES-InfoCrop model will be hereafter referred to as JULES-Info and the original JULES model will be hereafter referred to as JULES-base.
Based on a crop calendar review (Agropedia, 2013; NFSM, 2013; USDA-I, 2013; FAO, 2013; ICAR, 2013) we concluded that the main crops grown in our study area
5
(district of Uttar Pradesh) are rice during the summer months (July–October) and wheat during the winter months (October–March). Therefore, the JULES-Info model was parametrized for those crops under a two-crop rotation system and a crop calen-dar was added to the coupled model. Table 1 shows the different parameters used by JULES-Info for rice and wheat.
10
Canopy height is calculated based on Eq. (61) in Clark et al. (2011), whereW is the carbon content of the stems, calculated by the crop model.
In JULES-base, the C3 photosynthesis model (Collatz et al., 1991) is a function of
the maximum rate of carboxylation of Rubisco, Vm (see Cox, 2001, Eqs. 43, 45 and 51).Vmis a function of the potential maximum carboxylation rate at 25◦C,V
max. For C3,
15
in JULES-base,Vmax=0.0008×nl, wherenl is the leaf nitrogen concentration. In the
JULES-Info model we made the following adaptation:
Vmax=
(
0.0008×nl, wheat
0.00036×nl, rice
(2)
sinceVmaxof Rubisco in rice is 45 % lower than that of wheat (Sheehy et al., 2000).
20
In JULES-base, the surface infiltration rateK is equal toβs×Ks; WhereKsis the soil saturated hydrological conductivity andβs an enhancement factor (Best et al., 2011). The default value of βs for C3 grass in JULES-base is 2. For the other PFTs, βs is
4 for trees and 2 for C4 grass and shrubs. However, and as also suggested by den Hoof et al. (2013), no justification can be found for differentβsvalues between different
25
HESSD
11, 6843–6880, 2014Coupling an LSM with a crop model to
improve ET estimations
G. M. Tsarouchi et al.
Title Page
Abstract Introduction
Conclusions References
Tables Figures
◭ ◮
◭ ◮
Back Close
Full Screen / Esc
Printer-friendly Version Interactive Discussion
Discussion
P
a
per
|
Discus
sion
P
a
per
|
Discussion
P
a
per
|
Discussion
P
a
per
|
In JULES-Info, canopy capacity is calculated through an adaptation of the formulae used in JULES-base and InfoCrop, as follows:
Cm=0.05+0.25LAI (3)
This adapted formulation is more in line with the equation suggested by den Hoof et al.
5
(2013), after taking into account what is used in other LSMs and review papers. The new formula is expected to increase canopy capacity dependence to LAI (den Hoof et al., 2013).
Irrigation in the coupled model has not been included yet and possible impacts of this simplification are discussed in the Results section.
10
3.4 Model experiments
The simulations were performed over the study area for a period of 9 years between 2000 and 2008 to coincide with the periods of available data from NCEP, TRMM, GMAO and MODIS.
Four different model simulations were performed: (A) JULES-base driven with the
15
GMAO meteorological dataset; (B) JULES-base driven with TRMM precipitation data and the post-processed NCEP dataset for the rest meteorological variables; (C) JULES-Info driven with the GMAO meteorological dataset; (D) JULES-Info driven with TRMM precipitation data and the post-processed NCEP dataset for the rest meteoro-logical variables.
20
The JULES-base simulations were run with C3 crop parameterisation, where the
vegetation parameters were adapted to crops and have been used as a reference. The JULES-Info simulations were run with dynamic crop growth parameterisation, where its interactions with the environment were simulated.
To quantify the uncertainty in the ET results derived by an LSM with no dynamic
25
HESSD
11, 6843–6880, 2014Coupling an LSM with a crop model to
improve ET estimations
G. M. Tsarouchi et al.
Title Page
Abstract Introduction
Conclusions References
Tables Figures
◭ ◮
◭ ◮
Back Close
Full Screen / Esc
Printer-friendly Version Interactive Discussion
Discussion
P
a
per
|
Discus
sion
P
a
per
|
Discussion
P
a
per
|
Discussion
P
a
per
|
scores tested include the correlation coefficient (r), the coefficient of determination (R2), the Root Mean Squared Error (RMSE) and the Mean Error.
4 Results
The sensitivity of the land surface model JULES was evaluated with respect to the daily and seasonal dynamics of the vegetation cover in the study area. When the model runs
5
without a dynamic vegetation growth scheme, it assumes 100 % agricultural coverage throughout the entire simulation period. There is no information about seedling, emer-gence or harvesting dates, nor about the duration of fallow land periods between diff er-ent cropping seasons. In addition it is assumed that the cultivated crop is a generic C3
grass. However, when the model runs coupled with the crop growth model (and hence
10
dynamic vegetation growth is included), the seedling, emergence and harvesting dates are defined, fallow land periods are included in the simulation and a two crop rotation scheme (wheat vs. rice) is introduced, with different parameterisation for each crop (Table 1).
The MODIS LAI is compared with the JULES-Info (forced by the two different
meteo-15
rological datasets) modelled LAI as shown in Fig. 4 (top). JULES-base was run with its default LAI value set to 2 for crops. The results show that the modelled LAI matches the observed MODIS LAI well. The correlation coefficients for TRMM and GMAO forcing datasets arer =0.87 andr =0.66 respectively and the RMSE values are RMSE=0.17 and RMSE=0.28 respectively (Fig. 4, bottom). The two peaks per year represent the
20
two cropping seasons as specified by the crop calendar. The reduced LAI values as calculated by the JULES-Info model in comparison to the steady value of LAI=2 used by the JULES-base model are reducing the canopy storage which is directly translated into a reduced canopy interception. This is expected to cause a decrease in the total ET estimation.
25
HESSD
11, 6843–6880, 2014Coupling an LSM with a crop model to
improve ET estimations
G. M. Tsarouchi et al.
Title Page
Abstract Introduction
Conclusions References
Tables Figures
◭ ◮
◭ ◮
Back Close
Full Screen / Esc
Printer-friendly Version Interactive Discussion
Discussion
P
a
per
|
Discus
sion
P
a
per
|
Discussion
P
a
per
|
Discussion
P
a
per
|
comparison to the JULES-Info version results (Fig. 5). There is a significant difference especially when the dry and the fallow land periods are simulated. JULES-base is over-estimating ET as it simulates a false land cover with 100 % agriculture that indeed evap-orates more than the bare soil does. Figure 5 shows that JULES-base, after the wet season peak in ET, reproduces a second lower peak in month October of years 2003–
5
2005. However, JULES-Info in agreement with MODIS and LandFlux-EVAL (Fig. 10) does not reproduce that 2nd peak. This behaviour of JULES-base is possibly related to a combination of precipitation and temperature patterns as well as the fact that it operates under a constant LAI of 2. Whereas for JULES-Info, October is a month with very low LAI values (near 0.5), as it is the transition period between rice harvesting
10
and wheat planting according to our crop calendar (Fig. 4, top). In addition, JULES-Info matches better the MODIS and LandFlux-EVAL fluctuation and timing of the peak values. In both plots, the modelled by JULES-base ET is higher than the MODIS ET. JULES-base tends to overestimate ET mainly during the dry period because then the difference between the default LAI value of 2 and the actual LAI value of the growing
15
crop (wheat) is larger. This is also clearly illustrated on the right-hand plots of Fig. 5 which show the mean seasonal cycle of ET(mm m−1) and give an approximation of the
mean bias per month for each of the models. Similar trends have been observed by Blyth et al. (2010), who used surface energy flux measurements from 10 FLUXNET sites around the world that represented a range of climate conditions and biome types,
20
and found that the JULES-base evaporation is higher than that observed; The same results were also found by den Hoof et al. (2011), who found that the JULES-base latent heat flux is overestimated over cropland in Europe. One possibility for this bias is an overestimation of canopy interception. Blyth et al. (2011), who applied a set of benchmark tests in order to quantify the performance of JULES, found indeed that the
25
HESSD
11, 6843–6880, 2014Coupling an LSM with a crop model to
improve ET estimations
G. M. Tsarouchi et al.
Title Page
Abstract Introduction
Conclusions References
Tables Figures
◭ ◮
◭ ◮
Back Close
Full Screen / Esc
Printer-friendly Version Interactive Discussion
Discussion
P
a
per
|
Discus
sion
P
a
per
|
Discussion
P
a
per
|
Discussion
P
a
per
|
offers improved accuracy. The coupled model captures better the seasonal variabil-ity of ET. An overall decrease in the modelled ET (Fig. 5) compared to MODIS ET is observed. R2 values are significantly improved compared to the JULES-base equiv-alent values and RMSE values are reduced (Fig. 6):R2 increased from 0.77 to 0.87 under GMAO forcing data and from 0.71 to 0.84 under TRMM/NCEP data. RMSE
de-5
creased from 16.27 to 12.98 under GMAO forcing data and from 14.78 to 12.67 under TRMM/NCEP data.
Looking at the mean annual ET in the study area (Fig. 7), JULES-Info is matching quite well the equivalent MODIS annual ET, whereas JULES-base constantly appears to give higher values. The mean difference in annual ET between JULES-base and
10
JULES-Info is 145 mm yr−1 under TRMM precipitation and 158 mm yr−1 under GMAO
precipitation. The mean difference in annual ET between JULES-base and MODIS is 180 mm yr−1under TRMM precipitation, whereas the equivalent value between
JULES-Info and MODIS is 35 mm yr−1. The same figures under GMAO precipitation, show
the same magnitude of difference (233 mm yr−1 di
fference between JULES-base and
15
MODIS and 75 mm yr−1 di
fference between JULES-Info and MODIS). Those results indicate a high sensitivity of the model with respect to vegetation dynamics.
In Figs. 8 and 9 we partition the results into wet (June–September) and dry (October– May) periods.R2 and RMSE values are significantly improved during the wet period (Fig. 8), when the highest ET rates are being noticed in the study area. However, as
20
shown in Fig. 9, which illustrates the magnitude of the Mean Error for both the wet and dry seasons, the main improvement caused by JULES-Info occurs during the dry period, as the model is no longer constantly overestimating ET. In all cases JULES-Info achieves lower Mean Error values than JULES-base does.
Figure 10 shows the comparison of the modelled ET with the LandFlux-EVAL
prod-25
LandFlux-HESSD
11, 6843–6880, 2014Coupling an LSM with a crop model to
improve ET estimations
G. M. Tsarouchi et al.
Title Page
Abstract Introduction
Conclusions References
Tables Figures
◭ ◮
◭ ◮
Back Close
Full Screen / Esc
Printer-friendly Version Interactive Discussion
Discussion
P
a
per
|
Discus
sion
P
a
per
|
Discussion
P
a
per
|
Discussion
P
a
per
|
EVAL product. A possible explanation for this could be the fact that we do not account for irrigation. Different land cover maps, or forcing meteorology used by the LSMs that contributed in the calculation of LandFlux-EVAL ET could be related as well. However, looking at the wet period’s ET, JULES-Info provides significantly improved results com-pared to JULES-base (R2increased from 0.59 to 0.73).
5
As shown in Fig. 11 (source: USDA-II, 2013) most of the wheat that grows in our study area is rain-fed. In addition, according to USDA-I (2013), rice in the district of Uttar Pradesh (which is the district our study area belongs to) is predominantly rain fed and depends largely on the monsoon season rains from June to September. Therefore, the simplification of not accounting for irrigation is not expected to affect significantly
10
the results during the dry period. Furthermore, in JULES transpiration only occurs from the dry fraction of the canopy, which during and after a rain event is a very small part of the canopy. That means that transpiration during the wet season is not expected to change significantly even if irrigation was applied, since the dry portion of the canopy that transpires will remain the same. Nevertheless, it is possible that incorporation of
15
irrigation in the coupled model will increase soil evaporation. The application of irriga-tion in the wet (dry) season could also have an impact in the dry (wet) season ET, as the soil moisture stores could be higher.
5 Conclusions
The objective of our study is to quantify the potential error in ET flux estimations of an
20
LSM without dynamic vegetation. For this reason, the full energy balance scheme of JULES (which describes the exchange between atmosphere–surface–subsurface wa-ter fluxes) has been coupled to the crop growth model InfoCrop, which represents the crop development and other physiological processes. The model has been parameter-ized for wheat and rice, the two main crops of the study area, in a two crop rotating
25
HESSD
11, 6843–6880, 2014Coupling an LSM with a crop model to
improve ET estimations
G. M. Tsarouchi et al.
Title Page
Abstract Introduction
Conclusions References
Tables Figures
◭ ◮
◭ ◮
Back Close
Full Screen / Esc
Printer-friendly Version Interactive Discussion
Discussion
P
a
per
|
Discus
sion
P
a
per
|
Discussion
P
a
per
|
Discussion
P
a
per
|
The results show that JULES is sensitive to the changes applied and the incorpora-tion of crop dynamics in the model significantly alters the ET fluxes. An overall reduc-tion is observed in the simulated ET fluxes of the JULES-Info model compared to the original JULES-base model. The seasonal patterns of ET as simulated by JULES-Info match better the MODIS and LandFlux-EVAL ET products than JULES-base does. The
5
difference in mean annual ET between JULES-base and JULES-Info is approximately 150 mm yr−1 and can be considered as an indication of the potential error in surface
flux estimations of land–surface models that do not include vegetation dynamics. Improving the estimation of energy and water fluxes over croplands through a more accurate description of vegetation dynamics is crucial for projecting potential changes
10
in the hydrological cycle under different climate change scenarios. Increased accuracy of ET estimations is an important step towards a better understanding of the temporal dynamics of climate-surface-groundwater fluxes as a function of agricultural production and inter-seasonal land cover change; while at the same time is vital for advanced irrigation practices under a water limited environment.
15
Acknowledgements. GMT is financially supported by the Grantham Institute for Climate Change. W. Buytaert and A. Mijic are supported by the NERC Changing Water Cycle (South
Asia) projectHydrometeorological feedbacks and changes in water storage and fluxes in
North-ern India(grant number NE/I022558/1). The authors would like to thank Prof. P. K. Aggarwal and Dr. S. Naresh Kumar for sharing with them the InfoCrop model code.
20
References
Aggarwal, P., Kalra, N., Chander, S., and Pathak, H.: InfoCrop: a dynamic simulation model for the assessment of crop yields, losses due to pests, and environmental impact of agro-ecosystems in tropical environments. I. Model description, Agr. Syst., 89, 1–25, doi:10.1016/j.agsy.2005.08.003, 2006. 6848, 6853, 6854
25
HESSD
11, 6843–6880, 2014Coupling an LSM with a crop model to
improve ET estimations
G. M. Tsarouchi et al.
Title Page
Abstract Introduction
Conclusions References
Tables Figures
◭ ◮
◭ ◮
Back Close
Full Screen / Esc
Printer-friendly Version Interactive Discussion
Discussion
P
a
per
|
Discus
sion
P
a
per
|
Discussion
P
a
per
|
Discussion
P
a
per
|
Best, M. J., Pryor, M., Clark, D. B., Rooney, G. G., Essery, R .L. H., Ménard, C. B., Ed-wards, J. M., Hendry, M. A., Porson, A., Gedney, N., Mercado, L. M., Sitch, S., Blyth, E., Boucher, O., Cox, P. M., Grimmond, C. S. B., and Harding, R. J.: The Joint UK Land Envi-ronment Simulator (JULES), model description – Part 1: Energy and water fluxes, Geosci. Model Dev., 4, 677–699, doi:10.5194/gmd-4-677-2011, 2011. 6847, 6851, 6852, 6853, 6855
5
Bharati, L. and Jayakody, P.: Hydrology of the Upper Ganga river, International Water Manage-ment Institute, Colombo, Sri Lanka, 2010.
Blyth, E., Gash, J., Lloyd, A., Pryor, M., Weedon, G. P., and Shuttleworth, J.: Evaluating the JULES land surface model energy fluxes using FLUXNET Data, J. Hydrometeorol., 11, 509– 519, 2010. 6858
10
Blyth, E., Clark, D. B., Ellis, R., Huntingford, C., Los, S., Pryor, M., Best, M., and Sitch, S.: A comprehensive set of benchmark tests for a land surface model of simultaneous fluxes of water and carbon at both the global and seasonal scale, Geosci. Model Dev., 4, 255–269, doi:10.5194/gmd-4-255-2011, 2011. 6858
Boegh, E., Thorsen, M., Butts, M., Hansen, S., Christiansen, J., Abrahamsen, P., Hasager, C.,
15
Jensen, N., van der Keur, P., Refsgaard, J., Schelde, K., Soegaard, H., and Thomsen, A.: In-corporating remote sensing data in physically based distributed agro-hydrological modelling, J. Hydrol., 287, 279–299, doi:10.1016/j.jhydrol.2003.10.018, 2004. 6846
Calvet, J.-C., and Soussana, J.-F.: Modelling CO2-enrichment effects using an interactive
veg-etation SVAT scheme, Agr. Forest Meteorol., 108, 129–152, 2001. 6846
20
Calvet, J.-C., Noilhanm, J., Roujean, J.-L., Bessemoulin, P., Cabelguenne, M., Olioso, A., and Wigneron, J.-P.: An interactive vegetation SVAT-model tested against data from six contrast-ing sites, Agr. Forest Meteorol., 92, 73–95, 1998. 6846
Clark, D. B., Mercado, L. M., Sitch, S., Jones, C. D., Gedney, N., Best, M. J., Pryor, M., Rooney, G. G., Essery, R. L. H., Blyth, E., Boucher, O., Harding, R. J., Huntingford, C., and
25
Cox, P. M.: The Joint UK Land Environment Simulator (JULES), model description – Part 2: Carbon fluxes and vegetation dynamics, Geosci. Model Dev., 4, 701–722, doi:10.5194/gmd-4-701-2011, 2011. 6847, 6851, 6855
Collatz, G. J., Ball, J. T., Grivet, C., and Berry, J. A.: Physiological and environmental regulation of stomatal conductance, photosynthesis and transpiration: a model that includes a laminar
30
HESSD
11, 6843–6880, 2014Coupling an LSM with a crop model to
improve ET estimations
G. M. Tsarouchi et al.
Title Page
Abstract Introduction
Conclusions References
Tables Figures
◭ ◮
◭ ◮
Back Close
Full Screen / Esc
Printer-friendly Version Interactive Discussion
Discussion
P
a
per
|
Discus
sion
P
a
per
|
Discussion
P
a
per
|
Discussion
P
a
per
|
Cosby, B. J., Hornberger, G. M., Clapp, R. B., and Ginn, T. R.: A statistical exploration of the relationships of soil moisture characteristics to the physical properties of soils, Water Resour. Res., 20, 682–690, doi:10.1029/WR020i006p00682, 1984. 6849
Cox, P. M.: Description of the “TRIFFID” Dynamic Global Vegetation Model, Hadley Center
Technical Note 24, Hadley Centre, Met Office., London Road, Bracknell, Berks, RG122SY,
5
UK, 2001. 6855
Cox, P. M., Huntingford, C., and Harding, R. J.: A canopy conductance and photosynthesis model for use in a GCM land surface scheme, J. Hydrol., 212, 79–94, 1998. 6852
Cox, P. M., Betts, R. A., Jones, C. D., Spall, S. A., and Totterdell, I. J.: Acceleration of global warming due to carbon-cycle feedbacks in a coupled climate model, Nature, 408, 184–187,
10
2000. 6846
Dai, Y., Zeng, X., Dickinson, R. E., Baker, I., Bonan, G., Bosilovich, M., Denning, S., Dirmeyer, P., Houser, P., Niu, G., Oleson, K., Schlosser, A., and Yang, Z.-L.: The common land model (CLM), B. Am. Meteorol. Soc., 84, 1013–1023, doi:10.1175/BAMS-84-8-1013, 2003. 6846 den Hoof, C. V., Hanert, E., and Vidale, P. L.: Simulatind dynamic crop growth with an adapted
15
land surface model JULES-SUCROS: model development and validation, Agr. Forest Mete-orol., 151, 137–153, doi:10.1016/j.agrformet.2010.09.011, 2011. 6846, 6848, 6852, 6858 den Hoof, C. V., Vidale, P. L., Verhoef, A., and Vincke, C.: Improved evaporative flux
par-titioning and carbon flux in the land surface model JULES: impact on the simulation of land surface processes in temperate Europe, Agr. Forest Meteorol., 181, 108–124,
20
doi:10.1016/j.agrformet.2013.07.011, 2013. 6853, 6855, 6856
Essery, R., Best, M., Betts, R., and Taylor, C.: Explicit representation of subgrid heterogeneity in a GCM land surface scheme, J. Hydrometeorol., 4, 530–543, 2003. 6851
FAO: AQUASTAT. Information System on Water and Agriculture, available at: http://www. fao.org/nr/water/aquastat/water_use_agr/CC_PDF/CC_IND.pdf (last access: 19 September
25
2013), 2013. 6855
FAO: FAO/IIASA/ISRIC/ISSCAS/JRC. Harmonized World Soil Database (version 1.1), FAO, Rome, Italy and IIASA, Laxenburg, Austria., available at: http://webarchive.iiasa.ac.at/ Research/LUC/External-World-soil-database/HTML/ (last access: 24 January 2013), 2009. 6849
30
HESSD
11, 6843–6880, 2014Coupling an LSM with a crop model to
improve ET estimations
G. M. Tsarouchi et al.
Title Page
Abstract Introduction
Conclusions References
Tables Figures
◭ ◮
◭ ◮
Back Close
Full Screen / Esc
Printer-friendly Version Interactive Discussion
Discussion
P
a
per
|
Discus
sion
P
a
per
|
Discussion
P
a
per
|
Discussion
P
a
per
|
Guo, Z., Dirmeyer, P. A., Koster, R. D., Sud, Y. C., Bonan, G., Oleson, K. W., Chan, E., Verseghy, D., Cox, P., Gordon, C. T., McGregor, J. L., Kanae, S., Kowalczyk, E., Lawrence, D., Liu, P., Mocko, D., Lu, C.-H., Mitchell, K., Malyshev, S., McAvaney, B., Oki, T., Yamada, T., Pitman, A., Taylor, C. M., Vasic, R., and Xue, Y.: GLACE: The Global Land–Atmosphere Coupling Experiment. Part II: Analysis, J. Hydrometeorol., 7, 611–625, 2006. 6846
5
Huffman, G. J. and Bolvin, D. T.: Trmm and other data precipitation data set documentation,
available at: ftp://precip.gsfc.nasa.gov/pub/trmmdocs/3B42_3B43_doc.pdf (last access: 16 December 2013), 2013. 6869
Huffman, G. J., Bolvin, D. T., Nelkin, E. J., Wolff, D. B., Adler, R. F., Gu, G., Hong, Y.,
Bow-man, K. P., and Stocker, E. F.: The TRMM Multisatellite Precipitation Analysis (TMPA):
quasi-10
global, multiyear, combined-sensor precipitation estimates at fine scales, J. Hydrometeorol., 8, 38–55, 2007.
ICAR: Crop Calendar of Major Crops, available at: http://www.icar.org.in/en/crop-science.htm (last access: 18 September 2013), 2013. 6855
Jin, Y., Schaaf, C. B., Woodcock, C. E., Gao, F., Li, X., Strahler, A. H., Lucht, W., and Liang,
15
S.: Consistency of MODIS surface bidirectional reflectance distribution function and albedo retrievals: 2. Validation, J. Geophys. Res., 108, 4159, doi:10.1029/2002JD002804, 2003. 6850
Kalnay, E., Kanamitsu, M., Kistler, R., Collins, W., Deaven, D., Gandin, L., Iredell, M., Saha, S., White, G., Woollen, J., Zhu, Y., Leetmaa, A., Reynolds, R., Chelliah, M., Ebisuzaki, W.,
20
Higgins, W., Janowiak, J., Mo, K., Ropelewski, C., Wang, J., Jenne, R., and Joseph, D.: The NCEP/NCAR 40-Year Reanalysis Project, B. Am. Meteorol. Soc., 77, 437–471, 1996. 6869 Koster, R., Dirmeyer, P., Guo, Z., and Bonan, G.: Regions of strong coupling between soil
moisture and precipitation, Science, 305, 1138–1140, 2004. 6846
Koster, R. D., Sud, Y. C., Guo, Z., Dirmeyer, P. A., Bonan, G., Oleson, K. W., Chan, E.,
25
Verseghy, D., Cox, P., Davies, H., Kowalczyk, E., Gordon, C. T., Kanae, S., Lawrence, D., Liu, P., Mocko, D., Lu, C.-H., Mitchell, K., Malyshev, S., McAvaney, B., Oki, T., Yamada, T., Pitman, A., Taylor, C. M., Vasic, R., and Xue, Y.: GLACE: the Global Land–Atmosphere Cou-pling Experiment. Part I: Overview, J. Hydrometeorol., 7, 590–610, 2006. 6846
Krishna Kumar, K., Rupa Kumar, K., Ashrit, R. G., Deshpande, N. R., and Hansen, J. W.:
30
Climate impacts on Indian agriculture, Int. J. Climatol., 24, 1375–1393, 2004. 6846
HESSD
11, 6843–6880, 2014Coupling an LSM with a crop model to
improve ET estimations
G. M. Tsarouchi et al.
Title Page
Abstract Introduction
Conclusions References
Tables Figures
◭ ◮
◭ ◮
Back Close
Full Screen / Esc
Printer-friendly Version Interactive Discussion
Discussion
P
a
per
|
Discus
sion
P
a
per
|
Discussion
P
a
per
|
Discussion
P
a
per
|
Lei, H., Yang, D., Lokupitiya, E., and Shen, Y.: Coupling land surface and crop growth models for predicting evapotranspiration and carbon exchange in wheat-maize rotation croplands, Biogeosciences, 7, 3363–3375, doi:10.5194/bg-7-3363-2010, 2010. 6846
Li, Y., Kinzelbach, W., Zhou, J., Cheng, G. D., and Li, X.: Modelling irrigated maize with a combination of coupled-model simulation and uncertainty analysis, in the northwest of China,
5
Hydrol. Earth Syst. Sci., 16, 1465–1480, doi:10.5194/hess-16-1465-2012, 2012. 6846 Li, Y., Zhou, J., Kinzelbach, W., Cheng, G., Li, X., and Zhao, W.: Coupling a SVAT heat and
water flow model, a stomatal-photosynthesis model and a crop growth model to simulate energy, water and carbon fluxes in an irrigated maize ecosystem, Agr. Forest Meteorol., 176, 10–24, 2013. 6846
10
Lucht, W., Schaaf, C., and Strahler, A.: An algorithm for the retrieval of albedo from space using semiempirical BRDF models, IEEE T. Geosci. Remote, 38, 977–998, 2000. 6850
Maruyama, A. and Kuwagata, T.: Coupling land surface and crop growth models to estimate the
effects of changes in the growing season on energy balance and water use of rice paddies,
Agr. Forest Meteorol., 150, 919–930, 2010. 6846
15
Meehl, G. A.: Influence of the land surface in the Asian Summer Monsoon: external conditions versus internal feedbacks, J. Climate, 7, 1033–1049, 1994. 6846
GMAO: Global Modeling and Assimilation Office. File Specification for GEOS-DAS Gridded
Output Version 5.3. Document No. GMAO-1001v5.3, Tech. rep., Maryland, USA, 2004. 6869 Mo, X., Liu, S., Lin, Z., Xu, Y., Xiang, Y., and McVicar, T.: Prediction of crop yield, water
con-20
sumption and water use efficiency with a SVAT-crop growth model using remotely sensed
data on the North China plain, Ecol. Model., 183, 301–322, 2005. 6846
Mu, Q., Heinsch, F. A., Zhao, M., and Running, S. W.: Development of a global evapotranspira-tion algorithm based on MODIS and global meteorology data, Remote Sens. Environ., 111, 519–536, doi:10.1016/j.rse.2007.04.015, 2007. 6849, 6850
25
Mu, Q., Zhao, M., and Running, S. W.: Improvements to a MODIS global terrestrial evapotran-spiration algorithm, Remote Sens. Environ., 115, 1781–1800, doi:10.1016/j.rse.2011.02.019, 2011. 6849, 6850, 6869
Mueller, B., Hirschi, M., Jimenez, C., Ciais, P., Dirmeyer, P. A., Dolman, A. J., Fisher, J. B.,
Jung, M., Ludwig, F., Maignan, F., Miralles, D. G., McCabe, M. F., Reichstein, M., Sheffield, J.,
30
HESSD
11, 6843–6880, 2014Coupling an LSM with a crop model to
improve ET estimations
G. M. Tsarouchi et al.
Title Page
Abstract Introduction
Conclusions References
Tables Figures
◭ ◮
◭ ◮
Back Close
Full Screen / Esc
Printer-friendly Version Interactive Discussion
Discussion
P
a
per
|
Discus
sion
P
a
per
|
Discussion
P
a
per
|
Discussion
P
a
per
|
Myneni, R. B., Hoffman, S., Knyazikhin, Y., Privette, J. L., Glassy, J., Tian, Y., Wang, Y., Song, X.,
Zhang, Y., Smith, G. R., Lotsch, A., Friedl, M., Morisette, J. T., Votava, P., Nemani, R. R., and Running, S. W.: Global Products Of Vegetation Leaf Area And Fraction Absorbed PAR From Year One Of MODIS Data, Remote Sens. Environ., 83, 214–231, 2002. 6850
NFSM: Crop Calendar Report, available at: http://nfsm.gov.in/nfsmmis/RPT/CalenderReport.
5
aspx (last access: 19 September 2013), 2013. 6855
Osborne, T. M., Lawrence, D. M., Challinor, A. J., Slingo, J. M., and Wheeler, T. R.: Develop-ment and assessDevelop-ment of a coupled crop–climate model, Glob. Change Biol., 13, 169–183, doi:10.1111/j.1365-2486.2006.01274.x, 2007. 6846
Osborne, T., Slingo, J., Lawrence, D., and Wheeler, T.: Examining the interaction of growing
10
crops with local climate using a coupled crop-climate model, J. Climate, 22, 1393–1411, 2009. 6846
Pauwels, V. R. N., Verhoest, N. E. C., De Lannoy, G. J. M., Guissard, V., Lucau, C., and De-fourny, P.: Optimization of a coupled hydrology – crop growth model through the assimilation of observed soil moisture and leaf area index values using an ensemble Kalman filter, Water
15
Resour. Res., 43, 4, doi:10.1029/2006WR004942, 2007. 6846
Penman, H. L.: Natural evaporation from open water, bare soil and grass, P. Roy. Soc. Lond. A Mat., 193, 120–145, 1948. 6850, 6852, 6853
Penning de Vries, F., Jansen, D., ten Berge, H., and Bakema, A.: Simulation of Ecophysiological Processes of Growth in Several Annual Crops, Simulation Monograph PUDOC, Wageningen,
20
the Netherlands, 1989. 6854
Richards, L. A.: Capillary conduction of liquids through porous mediums, J. Appl. Phys., 1, 318–333, doi:10.1063/1.1745010, 1931. 6851
Sellers, P.: Canopy reflectance, photosynthesis and transpiration, Int. J. Remote Sens., 6, 1335–1372, 1985.
25
Seneviratne, S. I., Koster, R. D., Guo, Z., Dirmeyer, P. A., Kowalczyk, E., Lawrence, D., Liu, P., Mocko, D., Lu, C.-H., Oleson, K. W., and Verseghy, D.: Soil moisture memory in AGCM sim-ulations: analysis of Global Land Atmosphere Coupling Experiment (GLACE), J. Hydrome-teorol., 7, 1090–1112, 2006. 6846
Sheehy, J. E., Mitchell, P. L., and Hardy, B.: Redesigning Rice Photosynthesis to Increase Yield,
30
HESSD
11, 6843–6880, 2014Coupling an LSM with a crop model to
improve ET estimations
G. M. Tsarouchi et al.
Title Page
Abstract Introduction
Conclusions References
Tables Figures
◭ ◮
◭ ◮
Back Close
Full Screen / Esc
Printer-friendly Version Interactive Discussion
Discussion
P
a
per
|
Discus
sion
P
a
per
|
Discussion
P
a
per
|
Discussion
P
a
per
|
Sheffield, J., Goteti, G., and Wood, E.: Development of a 50-year high-resolution global
dataset of meteorological forcings for land surface modeling, J. Climate, 19, 3088–3111, doi:10.1175/JCLI3790.1, 2006. 6869
Taylor, C. M. and Ellis, R. J.: Satellite detection of soil moisture impacts on convection at the mesoscale, Geophys. Res. Lett., 33, 3, doi:10.1029/2005GL025252, 2006. 6846
5
Tsarouchi, G., Mijic, A., Moulds, S., and Buytaert, W.: Historical and future land-cover changes in the upper ganges basin of india, Int. J. Remote Sens., 35, 3150–3176, 2014. 6848, 6849, 6871
Tsvetsinskaya, E. A., Mearns, L. O., and Easterling, W. E.: Investigating the effect of seasonal
plant growth and development in three-dimensional atmospheric simulations. Part I:
Simula-10
tion of surface fluxes over the growing season, J. Climate, 14, 692–709, 2001.
Turner, A. G. and Annamalai, H.: Climate change and the South Asian summer monsoon, Nature Clim. Change, 2, 587–595, 2012. 6846
USDA-I: Crop Information – Crop Descriptions, available at:
http://www.fas.usda.gov/remote/aus_sas/crop_information/Crop_descriptions/in_crops.htm
15
#in_winter_rice (last access: 10 November 2013), 2013. 6849, 6855, 6860 USDA-II: Irrigated and rainfed wheat – India, 2013. 6860, 6880
USDA-II: PECAD-FAS (Production Estimates and Crop Assessment Division of USDA’s For-eign Agricultural Service), 2013.
van Genuchten, M. T.: a closed-form equation for predicting the hydraulic conductivity of
unsat-20
urated soils, Soil Sci. Soc. Am. J., 44, 892–898, 1980. 6851
Van Laar, H., Goudrian, J., and van Keulen, H.: Crop Growth Simulation Model “SUCROS97”: Simulation of Crop Growth for Potential and Water-Limited Production Situations as Applied to Spring Wheat. Tech. Rep. AB-DLO, Wageningen, The Netherlands, 1988.
Zulkafli, Z., Buytaert, W., Onof, C., Lavado, W., and Guyot, J. L.: A critical assessment of the
25
JULES land surface model hydrology for humid tropical environments, Hydrol. Earth Syst. Sci., 17, 1113–1132, doi:10.5194/hess-17-1113-2013, 2013a. 6851, 6852
Zulkafli, Z., Buytaert, W., Onof, C., Manz, B., Tarnavsky, E., Lavado, W., and Guyot, J.-L.: A com-parative performance analysis of TRMM 3B42 (TMPA) versions 6 and 7 for hydrological ap-plications over Andean-Amazon river basins, J. Hydrometeorol., 15, 581–592, 2013b. 6869
HESSD
11, 6843–6880, 2014Coupling an LSM with a crop model to
improve ET estimations
G. M. Tsarouchi et al.
Title Page
Abstract Introduction
Conclusions References
Tables Figures
◭ ◮
◭ ◮
Back Close
Full Screen / Esc
Printer-friendly Version Interactive Discussion
Discussion
P
a
per
|
Discus
sion
P
a
per
|
Discussion
P
a
per
|
Discussion
P
a
per
|
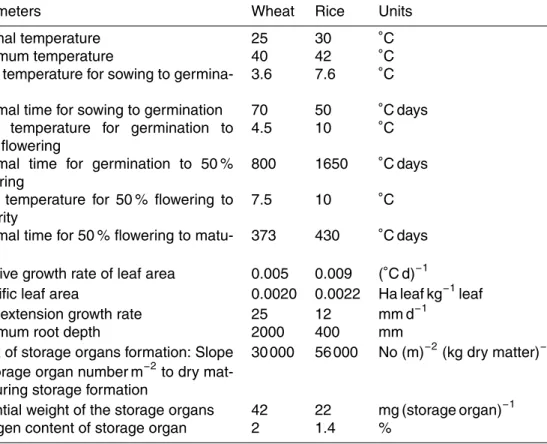
Table 1.JULES-Info parameters for wheat and rice.
Parameters Wheat Rice Units
Optimal temperature 25 30 ◦C
Maximum temperature 40 42 ◦C
Base temperature for sowing to germina-tion
3.6 7.6 ◦C
Thermal time for sowing to germination 70 50 ◦C days
Base temperature for germination to 50 % flowering
4.5 10 ◦C
Thermal time for germination to 50 % flowering
800 1650 ◦C days
Base temperature for 50 % flowering to maturity
7.5 10 ◦C
Thermal time for 50 % flowering to matu-rity
373 430 ◦C days
Relative growth rate of leaf area 0.005 0.009 (◦C d)−1
Specific leaf area 0.0020 0.0022 Ha leaf kg−1leaf
Root extension growth rate 25 12 mm d−1
Maximum root depth 2000 400 mm
Index of storage organs formation: Slope
of storage organ number m−2to dry
mat-ter during storage formation
30 000 56 000 No (m)−2
(kg dry matter)−1
Potential weight of the storage organs 42 22 mg (storage organ)−1
HESSD
11, 6843–6880, 2014Coupling an LSM with a crop model to
improve ET estimations
G. M. Tsarouchi et al.
Title Page
Abstract Introduction
Conclusions References
Tables Figures
◭ ◮
◭ ◮
Back Close
Full Screen / Esc
Printer-friendly Version Interactive Discussion
Discussion
P
a
per
|
Discus
sion
P
a
per
|
Discussion
P
a
per
|
Discussion
P
a
per
|
Table 2.Meteorological data used to drive the models.
Variable Name Resolution Time step Time domain Reference
Precipitation TRMM 3B42 v7 0.25◦
×0.25◦ 3 hourly 2000–2008 Huffman and Bolvin (2013);
Zulkafli et al. (2013b) MERRA GMAOa 0.50◦
×0.67◦ 3 hourly 2000–2008 GMAO (2004) Radiation, Surface temperature, NCEPb 1.00◦
×1.00◦ 3 hourly 2000–2008 Sheffield et al. (2006)
Surface pressure, Specific humid-ity, Wind speed
MERRA GMAO 0.50◦
×0.67◦ 3 hourly 2000–2008 GMAO (2004)
aThe reanalysis data from NASA’s Global Modeling and Assimilation Office (MERRA GMAO, GEOS-5)was used for the development of the MODIS ET dataset
(Mu et al., 2011) and was chosen in our study to facilitate ET comparison between our models and the MODIS ET product.
b
HESSD
11, 6843–6880, 2014Coupling an LSM with a crop model to
improve ET estimations
G. M. Tsarouchi et al.
Title Page
Abstract Introduction
Conclusions References
Tables Figures
◭ ◮
◭ ◮
Back Close
Full Screen / Esc
Printer-friendly Version Interactive Discussion
Discussion
P
a
per
|
Discus
sion
P
a
per
|
Discussion
P
a
per
|
Discussion
P
a
per
|
0km 70km 140km
N 27 28 29 30 31
78 79 80 81
lon
lat
1000 2000 3000 4000 5000 6000 7000 Elevation (m)
River network
0km 450km 900km
N
10 20 30 40
70 80 90
lon
lat