HESSD
10, 9057–9103, 2013Assimilation of surface soil moisture
and leaf area index
A. L. Barbu et al.
Title Page
Abstract Introduction
Conclusions References
Tables Figures
◭ ◮
◭ ◮
Back Close
Full Screen / Esc
Printer-friendly Version Interactive Discussion
Discussion
P
a
per
|
Dis
cussion
P
a
per
|
Discussion
P
a
per
|
Discussio
n
P
a
per
|
Hydrol. Earth Syst. Sci. Discuss., 10, 9057–9103, 2013 www.hydrol-earth-syst-sci-discuss.net/10/9057/2013/ doi:10.5194/hessd-10-9057-2013
© Author(s) 2013. CC Attribution 3.0 License.
Geoscientiic Geoscientiic
Geoscientiic Geoscientiic
Hydrology and Earth System
Sciences
Open Access
Discussions
This discussion paper is/has been under review for the journal Hydrology and Earth System Sciences (HESS). Please refer to the corresponding final paper in HESS if available.
Integrating ASCAT surface soil moisture
and GEOV1 leaf area index into the
SURFEX modelling platform: a land data
assimilation application over France
A. L. Barbu, J.-C. Calvet, J.-F. Mahfouf, and S. Lafont
CNRM-GAME, UMR3589, M ´et ´eo France, CNRS, Toulouse, France
Received: 21 May 2013 – Accepted: 26 June 2013 – Published: 11 July 2013
Correspondence to: J.-C. Calvet ([email protected])
HESSD
10, 9057–9103, 2013Assimilation of surface soil moisture
and leaf area index
A. L. Barbu et al.
Title Page
Abstract Introduction
Conclusions References
Tables Figures
◭ ◮
◭ ◮
Back Close
Full Screen / Esc
Printer-friendly Version Interactive Discussion
Discussion
P
a
per
|
Dis
cussion
P
a
per
|
Discussion
P
a
per
|
Discussio
n
P
a
per
|
Abstract
The land monitoring service of the European Copernicus programme has developed a set of satellite-based biogeophysical products, including surface soil moisture (SSM) and leaf area index (LAI). This study investigates the impact of joint assimilation of remotely sensed SSM derived from ASCAT backscatter data and the GEOV1
satellite-5
based LAI into the ISBA-A-gs land surface model within the SURFEX modelling plat-form of Meteo-France. The ASCAT data were bias corrected with respect to the model climatology by using a seasonal-based CDF (Cumulative Distribution Function) match-ing technique. A multivariate multi-scale land data assimilation system (LDAS) based on the Extended Kalman Filter (EKF) is used for monitoring the soil moisture, terrestrial
10
vegetation, surface carbon and energy fluxes across the France domain at a spatial resolution of 8 km. Each model grid box is divided in a number of land covers, each having its own set of prognostic variables. The filter algorithm is designed to provide a distinct analysis for each land cover while using one observation per grid box. The updated values are aggregated by computing a weighted average.
15
In this study, it is demonstrated that the assimilation scheme works effectively within the ISBA-A-gs model over a four-year period (2008–2011). The EKF is able to extract useful information from the data signal at the grid scale and to distribute the root-zone soil moisture and LAI increments among the mosaic structure of the model. The im-pact of the assimilation on the vegetation phenology and on the water and carbon
20
HESSD
10, 9057–9103, 2013Assimilation of surface soil moisture
and leaf area index
A. L. Barbu et al.
Title Page
Abstract Introduction
Conclusions References
Tables Figures
◭ ◮
◭ ◮
Back Close
Full Screen / Esc
Printer-friendly Version Interactive Discussion
Discussion
P
a
per
|
Dis
cussion
P
a
per
|
Discussion
P
a
per
|
Discussio
n
P
a
per
|
1 Introduction
Monitoring the seasonal and interannual variability of the water and carbon cycles over land is needed for many applications, including hydrological and climate studies. The possibility of improving the performance of land surface models (LSM) using remotely sensed observations is a field of active research. The mechanism of integrating
obser-5
vations, in a statistically optimal way, into a numerical model is called data assimilation. The latter permits improving the representation of the dynamical behavior of a bio-geophysical system. Land data assimilation systems (LDAS) are needed to integrate satellite data providing information about land state variables such as the surface soil moisture (SSM) and leaf area index (LAI) into LSM.
10
Soil moisture is a key factor controlling both the water and energy cycles (through its impact on the fluxes partitioning at the surface). In addition, it is linked to the carbon cycle through the coupling between plant transpiration and photosynthesis. A number of studies have discussed the importance of soil moisture in the description of the carbon cycle whose connexions with the hydrological cycle are largely unknown (van
15
der Molen et al., 2011). Moreover, in the context of the global warming trend, the soil water availability may play a role on ecosystem carbon fluxes far more important than considered until now (Reichstein et al., 2007). Assimilating remotely sensed SSM data into a LSM has been proved to be effective in estimating deeper soil moisture in a large number of papers in various contexts, as hydrology (Houser et al., 1998; Reichle et al.,
20
2002; Draper et al., 2011), numerical weather prediction (NWP) (Mahfouf et al., 2010; Dharssi et al., 2011; De Rosnay et al., 2012) or agricultural studies (Bolten and Crow, 2012).
Also, LAI impacts the exchanges of water vapour and CO2 between the vegetation
canopy and the atmosphere. A number of studies (Jarlan et al., 2008; Gu et al., 2006;
25
HESSD
10, 9057–9103, 2013Assimilation of surface soil moisture
and leaf area index
A. L. Barbu et al.
Title Page
Abstract Introduction
Conclusions References
Tables Figures
◭ ◮
◭ ◮
Back Close
Full Screen / Esc
Printer-friendly Version Interactive Discussion
Discussion
P
a
per
|
Dis
cussion
P
a
per
|
Discussion
P
a
per
|
Discussio
n
P
a
per
|
Recognizing the importance of better exploiting the close link between soil moisture and vegetation variables, efforts were made to implement data assimilation schemes into complex models such as coupled hydrological and crop models or physiologically-based LSM. The possibility of combining these two data streams within such models has been explored in several data assimilation applications either by setting observing
5
system simulation experiments (Pauwels et al., 2007; Nearing et al., 2012) or in real environments (Sabater et al., 2008; Barbu et al., 2011). The complementary nature of different types of data has been highlighted also in Kaminski et al. (2012) and Kato et al. (2013) by considering various pairs of observations (fraction of absorbed pho-tosynthetically active radiation fAPAR and atmospheric CO2 or fAPAR and latent heat 10
fluxes, respectively). They pointed out the necessity of considering the assimilation of multiple data streams as a more appropriate approach to the complexity of physical phenomena and more robust for the identification of model and data biases.
This study is placed in the context of multivariate multi-scale data assimilation (MVMS DA) within an externalized surface (SURFEX) modelling platform of
Meteo-15
France, after a nomenclature used in Montzka et al. (2012). Several types of data at various spatial scales may be incorporated into a LSM using the Extended Kalman Filter (EKF) (Mahfouf et al., 2009). Different versions of the EKF technique were used in various studies in order to assimilate either soil moisture (Draper et al., 2009), LAI (Jarlan et al., 2008), or both LAI and soil moisture (Sabater et al., 2008; Barbu et al.,
20
2011).
This study is an extension of a previous work by Barbu et al. (2011) where the joint assimilation of ground-based soil moisture and LAI observations has been in-vestigated at a local scale. While in situ data are limited by their spatial coverage, EO satellite observations represent a significant source of information providing
con-25
HESSD
10, 9057–9103, 2013Assimilation of surface soil moisture
and leaf area index
A. L. Barbu et al.
Title Page
Abstract Introduction
Conclusions References
Tables Figures
◭ ◮
◭ ◮
Back Close
Full Screen / Esc
Printer-friendly Version Interactive Discussion
Discussion
P
a
per
|
Dis
cussion
P
a
per
|
Discussion
P
a
per
|
Discussio
n
P
a
per
|
variables describing the terrestrial vegetation and the water and energy budgets. This work evaluates at the France scale the use of two satellite-based products provided by the Copernicus Global Land Service, namely SSM product retrieved from the scat-terometer ASCAT together with GEOV1 LAI data in the vegetation growth version of the Interactions between Soil Biosphere Atmosphere model (ISBA-A-gs) (Calvet et al.,
5
1998). The period under investigation extends over four years from 2008 to 2011 in-cluding various climatic conditions. In particular, the spring drought of 2011 is analyzed. The main objectives of this study are to assess to what extent the LDAS is able to: (1) simultaneously ingest EO satellite data providing mixed signals at a grid-scale into the mosaic structure of ISBA-A-gs; (2) propagate information from the surface into the
10
root-zone soil layer; (3) consistently impact the water and carbon fluxes; (4) improve the short-term vegetation response to drought conditions.
The ISBA-A-gs LSM, the observational data sets and the data assimilation scheme are described in Sect. 2. The LDAS configuration is presented in Sect. 3. In Sect. 4 the results are presented at the country scale, as well as over specific grid cells. The
15
impact of the assimilation on LAI, soil moisture, water and carbon fluxes is presented in Sect. 4.3. Section 5.1 describes the impact of the assimilation on the monitoring of the drought of spring 2011. The verification of the assimilation impact on the root-zone soil moisture is performed using ground-based observations in Sect. 5.2. Finally, Sect. 6 summarizes the main conclusions of the study.
20
2 The LDAS
In this study, the LDAS is defined as an off-line sequential data assimilation system based on a LSM uncoupled with the atmosphere. The LDAS is able to integrate simul-taneously available SSM and LAI observations at a given time step into the ISBA-A-gs LSM aiming at adjusting the model trajectory at that time. The experiments were
con-25
grass-HESSD
10, 9057–9103, 2013Assimilation of surface soil moisture
and leaf area index
A. L. Barbu et al.
Title Page
Abstract Introduction
Conclusions References
Tables Figures
◭ ◮
◭ ◮
Back Close
Full Screen / Esc
Printer-friendly Version Interactive Discussion
Discussion
P
a
per
|
Dis
cussion
P
a
per
|
Discussion
P
a
per
|
Discussio
n
P
a
per
|
lands, coniferous forests, broadleaf forests) by using a mosaic approach (Koster and Suarez, 1992). The model is driven by observation-based atmospheric forcing data which are derived from the SAFRAN (Syst `eme d’Analyse Fournissant des Renseigne-ments Atmosph ´eriques `a la Neige) mesoscale analysis system at 8-km spatial resolu-tion and hourly temporal sampling (Quintana-Segui et al., 2008). Atmospheric variables
5
include precipitation, 2 m air temperature, 2 m specific humidity, wind speed, surface pressure, incoming solar radiation, and incoming long-wave radiation.
The three main components of the LDAS (land surface model, remote sensing data and analysis scheme) are detailed hereafter.
2.1 The ISBA-A-gs LSM 10
In the SURFEX platform (http://www.cnrm.meteo.fr/surfex/), the ISBA LSM (Noilhan and Mahfouf, 1996) describes the exchanges between soil, vegetation and atmo-sphere. In this study, version 7.2 of SURFEX is used.
The force-restore three-layer version of the soil model in ISBA is used in this study (Boone et al., 1999). The soil texture parameters (clay and sand proportions) are taken
15
from the soil geographical database (BDGSF) of the French National Institute of Agro-nomic Research available at http://www.gissol.fr/programme/bdgsf/. For each model grid cell, the modelled soil moisture is partitioned into three variables: the simulated SSM (representative of the first soil centimetre), the volumetric root-zone soil moisture WG2 (defined for rooting depths depending on the vegetation type, with a maximum
20
thickness of 2.5 m) and a volumetric soil moisture value WG3 in the recharge zone be-low the plant roots (with a maximum thickness of 1 m). Hereafter, the simulated SSM will be referred to as SSMmod. In the model, the propagation of surface information to root-zone layer relies on the force-restore dynamics of the model: SSMmod is forced by precipitation and evaporation and restored toward WG2.
25
HESSD
10, 9057–9103, 2013Assimilation of surface soil moisture
and leaf area index
A. L. Barbu et al.
Title Page
Abstract Introduction
Conclusions References
Tables Figures
◭ ◮
◭ ◮
Back Close
Full Screen / Esc
Printer-friendly Version Interactive Discussion
Discussion
P
a
per
|
Dis
cussion
P
a
per
|
Discussion
P
a
per
|
Discussio
n
P
a
per
|
per unit ground horizontal surface area) is expressed as:
Ba=β·LAI, (1)
whereβ may depend upon vegetation type, nitrogen supply and climate. The vegeta-tion biomass and LAI variables are governed by photosynthesis and evolve dynamically in response to weather and climate conditions. Namely, during the growing phase the
5
net assimilation of CO2 photosynthesis leads to plant growth from a minimum thresh-old set to either 1 m2m−2for coniferous forest or 0.3 m2m−2for other vegetation types. A deficit of photosynthesis sets offleaf biomass mortality that exceeds net assimilation. Consequently LAI drops down to its minimum value.
The photosynthetic activity depends on the vegetation types. The input soil and
veg-10
etation parameters are provided by the ECOCLIMAP-II global database (Faroux et al., 2013) which describes ecosystem classes and assigns them in twelve elementary land cover types (patches) at 1 km spatial resolution. Three of them represent patches with-out vegetation (bare soil, permanent snow and rocks). Over the France domain, the dominant ecosystems are grasslands (31 %), C3 croplands (24 %), deciduous forest
15
(20 %), coniferous forests (11 %) and C4 croplands (4 %). Bare soil represents 8 % of the area. The mean root depths are of 1.5 m for herbaceous vegetation and 2 m for forests.
The water and energy budgets are calculated separately for each patch. ISBA-A-gs simulates the aggregation of carbon, water, and energy fluxes from the different
20
patches. The modelled LAI at 8 km resolution is an average value of vegetation types (up to 9 in the current configuration) weighted with their cover fraction.
The ISBA A-gs model simulates the interaction between water and carbon cycles. The evapo-transpiration flux (ET) represents the sum of the evaporation of liquid wa-ter from the soil surface and from the vegetation, and the sublimation from the snow
25
and soil ice. The net ecosystem CO2 exchange (NEE) is given by the difference
HESSD
10, 9057–9103, 2013Assimilation of surface soil moisture
and leaf area index
A. L. Barbu et al.
Title Page
Abstract Introduction
Conclusions References
Tables Figures
◭ ◮
◭ ◮
Back Close
Full Screen / Esc
Printer-friendly Version Interactive Discussion
Discussion
P
a
per
|
Dis
cussion
P
a
per
|
Discussion
P
a
per
|
Discussio
n
P
a
per
|
a basal rate as a function of soil temperature and soil moisture (Albergel et al., 2010). Following Lafont et al. (2012) the respiration basal rate was calibrated by assuming an equilibrium between the ecosystem respiration and the vegetation carbon uptake over the whole 4 yr period of the simulations.
Also, the A-gs module features two different types of the plant response to drought,
5
for both herbaceous vegetation (Calvet, 2000) and forests (Calvet et al., 2004). In the strategy called defensive or drought-avoiding, the plant increases the water use effi -ciency (WUE) in response to soil water stress, while in the offensive strategy or drought-tolerant, the WUE is stable or even decreases. While C3 crops and coniferous trees are associated to a drought-avoiding behaviour, C4 crops, grasslands and broadleaf
10
trees are associated to a drought-tolerant behaviour (Calvet et al., 2012, 2004).
2.2 Remote sensing data sets
2.2.1 Satellite-derived SSM
The Advanced Scatterometer (ASCAT) is an active C-band microwave sensor on board the European METOP polar-orbiting satellite. The soil moisture information is
15
derived from ASCAT radar backscatter coefficients delivered at 25 km resolution us-ing a methodology developed at the Vienna University of Technology (TU-Wien). This method is based on a change detection approach originally developed for the active mi-crowave instrument flown on-board the European satellites ERS-1 and ERS-2 (Wagner et al., 1999; Bartalis et al., 2007). An exponential filter in its recursive formulation
(Al-20
bergel et al., 2008) is applied to this SSM product to estimate the soil water index (SWI) using a time scale parameter T that may vary between 1 day and 100 days. The result for the top soil moisture content (<5 cm) range between 0 (dry) and 1 (saturated). Hereafter, this quantity will be referred to as SSMsat. In this study, SSMsat consists of Geoland2 soil water index values with a characteristic time length of one day, denoted
25
HESSD
10, 9057–9103, 2013Assimilation of surface soil moisture
and leaf area index
A. L. Barbu et al.
Title Page
Abstract Introduction
Conclusions References
Tables Figures
◭ ◮
◭ ◮
Back Close
Full Screen / Esc
Printer-friendly Version Interactive Discussion
Discussion
P
a
per
|
Dis
cussion
P
a
per
|
Discussion
P
a
per
|
Discussio
n
P
a
per
|
A surface state flag which identifies either frozen conditions, presence of snow cover or temporary melting/water on the surface is provided. The product includes also a quality flag indicating the availability of SSMsat measurements with an acceptable quality.
After screening, the remaining data were projected onto the 8 km model grid
reso-5
lution by assigning each observations to all SAFRAN grid cells within 0.15◦ and then considering the average of data assigned to each model grid. The model time series were compared with soil moisture data to determine their capability to represent the temporal dynamics at a grid scale. A good agreement between the SSMsat and the modelled SSM was found, despite anomalously low values of SSMsat produced in
10
frozen surface conditions. These erroneous values are not adequately identified by the flags. This suggests that an additional frozen surface mask depending on model fore-casts of frozen conditions has to be applied to the SSMsat data before being used in a data assimilation application. Similar to Draper et al. (2011), the screening procedure was extended to the use of two additional static masks in order to discard data in urban
15
regions with a urban fraction greater than 15 %, and to remove data with a topographic flag representing mountainous regions with an altitude greater than 1500 m.
2.2.2 Satellite-derived LAI product
The GEOV1 LAI product developed within the Geoland2 project is derived from the SPOT-VGT satellite observations. Hereafter, this quantity will be referred to as LAIsat.
20
The LAIsat values are produced by a statistical algorithm, namely a neural network trained using two pre-existing products: the SPOT-VGT CYCLOPES V3.1 product (Baret et al., 2007) and the TERRA/ AQUA MODIS collection 5 product (Myneni et al., 2002). The product is provided globally at a spatial resolution of 1 km and a 10 day sampling time in a Plate Carr ´ee projection. The LAIsat is close to the true LAI since
25
HESSD
10, 9057–9103, 2013Assimilation of surface soil moisture
and leaf area index
A. L. Barbu et al.
Title Page
Abstract Introduction
Conclusions References
Tables Figures
◭ ◮
◭ ◮
Back Close
Full Screen / Esc
Printer-friendly Version Interactive Discussion
Discussion
P
a
per
|
Dis
cussion
P
a
per
|
Discussion
P
a
per
|
Discussio
n
P
a
per
|
The retrieval methodology and detailed information about the product are described by Baret et al. (2013).
Camacho et al. (2013) performed a validation study by comparing the GEOV1 prod-uct with ground measurements and other reference satellite prodprod-ucts. They concluded that the GEOV1 is a reliable product and has an important added-value regarding its
5
two precursor products.
A quality check was performed using a number of quality flags provided with the LAIsat. The data are kept only if all the quality flags are set to 0. The 1 km data are aggregated at the model grid at 8 km resolution if at least 32 grid points are present (more than half the maximum amount).
10
2.3 Data assimilation
In the simplified version of the EKF used in this study, namely SEKF, the background covariance matrixB does not evolve with time. The SEKF calculation of the analysis increment (∆x) at time when an observation is available is given by:
∆x=Kyo−H(x), (2)
15
where x is the state vector, and yo is the observation vector. K that represents the Kalman gain is calculated as in the following expression:
K=BH⊤
HBH⊤
+R−1
. (3)
20
HereHis the Jacobian matrix of the linearised observation operatorH and H⊤ repre-sents its transpose. The covariance matrices of the background (B) and observation (R) errors are assumed diagonal.
As mentioned before, for the multi-patch version of the model, each model grid cell is split in a number of twelve patches each having their own prognostic variables. The
25
HESSD
10, 9057–9103, 2013Assimilation of surface soil moisture
and leaf area index
A. L. Barbu et al.
Title Page
Abstract Introduction
Conclusions References
Tables Figures
◭ ◮
◭ ◮
Back Close
Full Screen / Esc
Printer-friendly Version Interactive Discussion
Discussion
P
a
per
|
Dis
cussion
P
a
per
|
Discussion
P
a
per
|
Discussio
n
P
a
per
|
y=H(x) is assumed to be the average of the corresponding predicted observation for each patchyp=H(xp) weighted with the fractionαpoccupied by each patchp:
y=XαpH(xp), (4)
Since the patches are considered as independent and, then, the simulated observation
5
over the patch only depends upon the state vector over the same patch, the elements of the Jacobian matrixHpfor each patchpare:
Hpmn=∂y m
∂xnp =αp ∂ypm
∂xpn, (5)
where themandnindices hold formth andnth components of observation and state
10
vector, respectively. The elements of Hp are estimated using a finite difference ap-proximation by perturbing individually each analyzed variable with a small perturbation δxpn:
Hpmn=αp "
ypm(x+δxpn)−y p
m (x) δxpn
#
. (6)
15
Following a previous study (Barbu et al., 2011), the size of perturbations was set at 10−4
×(w
fc−wwilt) for WG2 and at 10 −3
for LAI as they were proved to lead to an acceptable linearisation of the Jacobian. wfc and wwilt represent the volumetric field capacity and the wilting point, respectively.
The Kalman gain is computed for each patch according to Eq. (3). A new value
20
that represents the analysis for each patchp, denoted by xpa is obtained by adding the analysis increment obtained as in Eq. (2) to the background. Finally, the updated variablexa is aggregated from the weighted contribution of each patch over the grid as:
xa= X
αpxpa. (7)
HESSD
10, 9057–9103, 2013Assimilation of surface soil moisture
and leaf area index
A. L. Barbu et al.
Title Page
Abstract Introduction
Conclusions References
Tables Figures
◭ ◮
◭ ◮
Back Close
Full Screen / Esc
Printer-friendly Version Interactive Discussion
Discussion
P
a
per
|
Dis
cussion
P
a
per
|
Discussion
P
a
per
|
Discussio
n
P
a
per
|
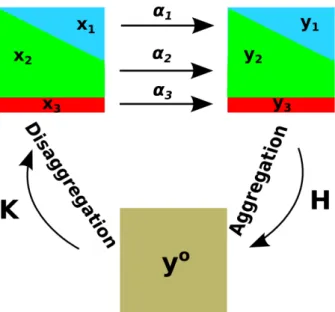
Figure 1 illustrates an example of the multi-patch data assimilation scheme for a grid cell split into three patches. The aggregation and disaggregation arrows correspond to the calculation of the model counterparts of a grid-scale observationyo and to the extraction of the data information distributed among the patches.
3 Description of the experimental design 5
A number of steps are necessary before assimilating the remote sensing data: pro-jection of satellite data onto the 8 km model grid, bias correction using a Cumulative Distribution Function (CDF) matching technique applied to the ASCAT data and speci-fications of model and observation errors.
3.1 State vector and resolution 10
The root-zone soil moisture is of the great relevance to this study, as it governs the plant response to drought. Also, following a recommendation of Draper et al. (2009), the SSM variable was not analyzed and was excluded from the control vector in order to reduce the number of linearisation of the Jacobian. Indeed, due to the small size of its reservoir and its short memory, the SSM is less critical to analyse. Therefore, in
15
this study, the control state vector for the analysis consists of two prognostic variables, root-zone soil moisture and LAI, each of them containing 12 values that correspond to the twelve patches. The vector of observations includes two elements: SSMsat and LAIsat at each grid cell.
The model simulations without data assimilation (prior) start in January 2007. The
20
year 2007 is considered as a spin-up period for the model run in order to obtain an equilibrium state. Then, the assimilation experiment starts on 1 January 2008 and lasts until 31 December 2011. The SEKF assimilates available observations every 24 h at 09:00 UTC, by analysing the initial state via the information provided by an observation at the end of the assimilation window. The SSMsat observations are converted into
HESSD
10, 9057–9103, 2013Assimilation of surface soil moisture
and leaf area index
A. L. Barbu et al.
Title Page
Abstract Introduction
Conclusions References
Tables Figures
◭ ◮
◭ ◮
Back Close
Full Screen / Esc
Printer-friendly Version Interactive Discussion
Discussion
P
a
per
|
Dis
cussion
P
a
per
|
Discussion
P
a
per
|
Discussio
n
P
a
per
|
volumetric water content (see Sect. 3.2) and assumed to be the observation equivalent of the SSMmod. Possible mismatch between observed and modelled quantities are accounted for in a bias correction scheme described in the next section. Concerning LAI, the satellite-derived product is considered to be the observation equivalent of the simulated LAI. The LAIsat is assimilated at the provided temporal resolution of 10 days.
5
The LDAS products (LAI, root-zone soil moisture, water, carbon and energy fluxes) are provided across the France domain split into 8602 grid cells, each of them of 8 km resolution (Habets et al., 2008) at the temporal resolution of one day for the state variables LAI and soil moisture and as cumulated daily outputs for the fluxes. Hereafter, the analyzed variables will be referred to as posterior, in opposition to the modelled
10
variables referred to as prior.
3.2 Rescaling and bias correction
Prior to assimilation, the SSMsat product has to be transformed into model equivalent volumetric SSM. The discrepancies between the model simulations and the satellite observations are addressed as part of the data assimilation system. The SSMsat data
15
are rescaled by matching its CDF to that of SSMmod. The approach described in Scipal et al. (2008) permits correcting for the differences in the first two moments (mean and variance) of the distribution and can be viewed as a linear transformation. The two parameters of the linear relationship, the interceptaand the slopebvary spatially, but are constant in time:
20
a=θ¯m−b×θ¯o, (8)
b=σm
σo, (9)
where ¯θmand ¯θohold for the means of model and observation, respectively, whileσm and σo represent the standard deviation errors for model and observations,
respec-25
HESSD
10, 9057–9103, 2013Assimilation of surface soil moisture
and leaf area index
A. L. Barbu et al.
Title Page
Abstract Introduction
Conclusions References
Tables Figures
◭ ◮
◭ ◮
Back Close
Full Screen / Esc
Printer-friendly Version Interactive Discussion
Discussion
P
a
per
|
Dis
cussion
P
a
per
|
Discussion
P
a
per
|
Discussio
n
P
a
per
|
bias free observations (with respect to the model) for the entire considered period, but systematic differences related to seasonal or inter-annual variations in bias may remain uncorrected. The importance of accounting for seasonal corrections in the CDF match-ing was discussed for the AMSR-E (Advanced Microwave Scannmatch-ing Radiometer) SSM data and the SSM provided by the NWP system ALADIN of Meteo-France by Draper
5
et al. (2009).
Therefore, we have derived thea and b CDF matching parameters on a seasonal basis by using a three-month moving window from 2008 to 2011. The CDF match-ing moments are computed based on (1) screened observations with the quality flag provided with the SSMsat and additional aforementioned masks for altitude and urban
10
fractions, and (2) SSMmod values for simulated soil temperature above 0◦
C.
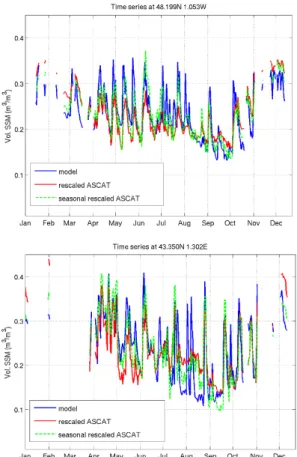
The model simulations were compared with the two CDF rescaled ASCAT time series to determine their capability for representing the temporal dynamics at two locations in North-East (48.199◦
N, 1.053◦
W) and in South-West (43.350◦
N, 1.302◦
E) of France (Fig. 2). For both locations, the CDF matching with seasonal correction improves the
15
temporal correlations between the data and the model when compared with the ap-proach without seasonal corrections from 0.72 to 0.79 (location in the North-East) and from 0.70 to 0.79 (location in the South-West). In addition, the seasonal bias correction reduces the standard deviation of the bias by 0.01 m3m−3for both locations.
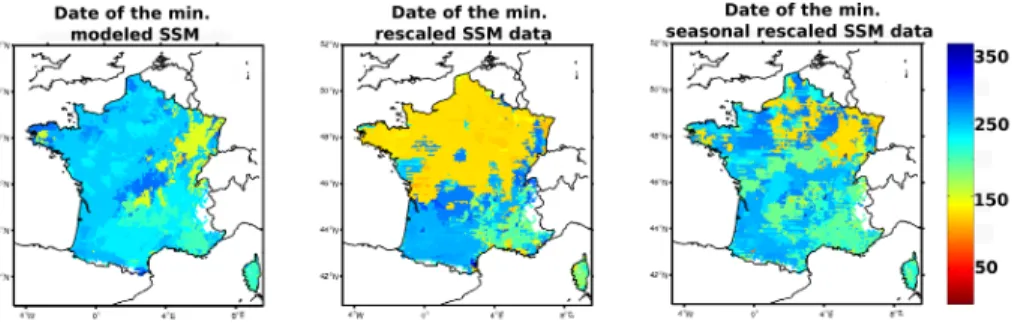
One can notice low SSMsat values in May, especially in northern France as
illus-20
trated in Fig. 2 at local scale. Figure 3 shows that this characteristic is widespread in northern France. In the latter figure, the date of the annual minimum of SSMmod and of SSMsat as rescaled with the two CDF matching approaches are illustrated for the year 2009. The model simulates a minimum occurring in the summer period (after Day of Year (DOY) 200) across almost the full domain with few exceptions in the eastern
25
HESSD
10, 9057–9103, 2013Assimilation of surface soil moisture
and leaf area index
A. L. Barbu et al.
Title Page
Abstract Introduction
Conclusions References
Tables Figures
◭ ◮
◭ ◮
Back Close
Full Screen / Esc
Printer-friendly Version Interactive Discussion
Discussion
P
a
per
|
Dis
cussion
P
a
per
|
Discussion
P
a
per
|
Discussio
n
P
a
per
|
4 yr period. Using a seasonal CDF matching approach helps adjusting the date of the minimum SSMsat to that of SSMmod as is illustrated in the right panel of Fig. 3.
3.3 Background and observation errors
For simulated root-zone soil moisture, a mean volumetric standard deviation (std) error of 0.02 m3m−3
was chosen as suggested by several authors (Mahfouf et al., 2009;
5
Draper et al., 2011; Barbu et al., 2011). In this experiment, the observational error is set to 0.05 m3m−3according to the median value of SSMsat ASCAT data error estimates. This value is consistent with errors typically expected for remotely sensed soil moisture (de Jeu et al., 2008; Draper et al., 2011).
Similar to Mahfouf et al. (2010) and Dharssi et al. (2011), a background quality
con-10
trol is performed in order to reject SSMsat converted to volumetric soil moisture that are too far from the model first-guess. By assuming that the observation error is equal to SSMmod error, the data are discarded if the innovations (differences between obser-vations and background) are larger than 0.21 m3m−3 (i.e. three times the square root of the sum of the observation and background variances).
15
Concerning LAI, in a previous study, Barbu et al. (2011) estimated in situ LAI ob-servation errors for grassland. Their results are difficult to extend to satellite-based LAI uncertainties at the France scale. In a recent study, Fang et al. (2013) estimated the average of the theoretical uncertainties of the GEOV1 product at the global scale. The theoretical uncertainties are related to the input data and retrieval processes and
re-20
semble random errors. They reported a std error value of 0.24 m2m−2
. In this study, the std errors of LAIsat is increased up to 0.3 in order to account for the additional uncertainties related to the aggregation procedure from 1 to 8 km resolution.
Generally, the start and the end of the growing season are considered being better represented by the satellite products (Jarlan et al., 2008; Brut et al., 2009; Szczypta
25
HESSD
10, 9057–9103, 2013Assimilation of surface soil moisture
and leaf area index
A. L. Barbu et al.
Title Page
Abstract Introduction
Conclusions References
Tables Figures
◭ ◮
◭ ◮
Back Close
Full Screen / Esc
Printer-friendly Version Interactive Discussion
Discussion
P
a
per
|
Dis
cussion
P
a
per
|
Discussion
P
a
per
|
Discussio
n
P
a
per
|
the std errors of LAImod is set to 0.6 m2m−2. It has been checked that the observation and model error specifications are consistent with innovation statistics.
4 Results
4.1 Jacobian terms
The Jacobian of the observation operator (H) described in Sect. 2.3 is required to
calcu-5
late the Kalman gain (Eq. 3). The histograms of Jacobian values corresponding to the ∂LAI(t)
∂LAI(t0) Jacobian term for vegetated patches were computed (not shown). As already
noted by R ¨udiger et al. (2010), three types of Jacobian values can be identified for ∂LAI(t)
∂LAI(t0) with ISBA-A-gs, each one corresponding to a distinct mode of the histograms:
(1) identical to zero, (2) close to a maximal value equal to the fraction occupied by
10
the plant functional type, and (3) a fraction of maximal value decreasing during the growing phase of the vegetation. This behaviour is common to all patches. The zero Jacobian value occurs when the LAI declines down to its minimal value in winter due to environmental conditions and also during drought periods. This non-informative Jaco-bian value has a larger frequency of occurrence in drought periods for the herbaceous
15
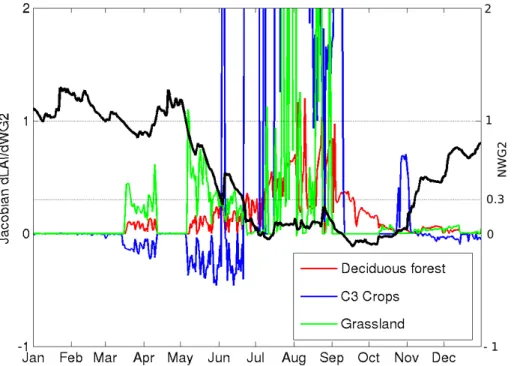
vegetation types, as they are more sensitive than forests to the water stress. Time series of daily Jacobian term ∂∂WG2(LAI(tt)
0) for the year 2009 at one location (43.35◦
N, 1.30◦
E) in south-western France are illustrated in Fig. 4. The three main vegetated patches are present in the grid cell: C3 crops (48 %) depicted in blue, grass-land (19 %) in green, and deciduous forest (9 %) in red. Bare soil represents 14 %. The
20
black curve represents the normalized soil moisture NWG2 corresponding to the C3 crop patch. The NWG2 is defined as:
NWG2=WG2 −wwilt
HESSD
10, 9057–9103, 2013Assimilation of surface soil moisture
and leaf area index
A. L. Barbu et al.
Title Page
Abstract Introduction
Conclusions References
Tables Figures
◭ ◮
◭ ◮
Back Close
Full Screen / Esc
Printer-friendly Version Interactive Discussion
Discussion
P
a
per
|
Dis
cussion
P
a
per
|
Discussion
P
a
per
|
Discussio
n
P
a
per
|
The dimensionless values of NWG2 are larger than 1 when the soil moisture content exceeds the volumetric field capacity and negative when the soil moisture content is below the wilting point meaning that the root water uptake stops. In a previous study, Barbu et al. (2011) analyzed the sensitivity of LAI to water perturbations in the rooting layer for grassland. They noted that, generally, the Jacobian term had positive values
5
since an increase in water content directly impacted photosynthesis and plant growth. In this study, a noticeable feature concerns the existence of negative Jacobian values for the C3 crop patch. For normalized soil moisture values ranging between a given critical limit of 0.3 and 1, a moderate water stress is defined. In these conditions, a drought-avoiding strategy takes place. A decrease in soil moisture is characterized
10
by an increase in the water use efficiency, which enhances photosynthesis. Therefore, between these limits, negative water perturbations can lead to an increase of the pho-tosynthesis.
Large Jacobian values correspond to advanced stages of water stress. When the normalized soil moisture approaches zero, small increases in WG2 cause large
in-15
creases in biomass production which reveals a specific non-linear behaviour of the ISBA-A-gs scheme. This behaviour is common to all patches. Null Jacobian values, indicating no sensitivity of LAI to soil moisture, occur when the water content is below the wilting point or above the volumetric field capacity.
4.2 Impact of assimilation on LAI and WG2 at patch level 20
Figure 5 shows for the year 2009 the prior and posterior LAI and WG2 daily evolutions per patch (top panels) and aggregated at pixel level (bottom panels) at the same loca-tion (43.35◦N, 1.30◦E) in south-western France. The root-zone soil moisture starts to decline in May and reaches a minimum in September (Fig. 5d), whereas LAI increases from March through May and remains high until July (Fig. 5c).
25
HESSD
10, 9057–9103, 2013Assimilation of surface soil moisture
and leaf area index
A. L. Barbu et al.
Title Page
Abstract Introduction
Conclusions References
Tables Figures
◭ ◮
◭ ◮
Back Close
Full Screen / Esc
Printer-friendly Version Interactive Discussion
Discussion
P
a
per
|
Dis
cussion
P
a
per
|
Discussion
P
a
per
|
Discussio
n
P
a
per
|
In spring, the positive increments are larger for C3 crops since they represent the main vegetation type within the grid cell. In summer, the temporal evolution of LAI per patch shows a more complex picture due to the combined effect of LAI and soil mois-ture analysis, and also, due to possible conflicting data information to be assimilated. Barbu et al. (2011) investigated the latter issue for grasslands. In a local experiment
5
conducted over a semi-arid woodland Kato et al. (2013) also discusses the case of assimilating conflicting data streams (latent heat fluxes and FAPAR, in their case).
The impact of soil moisture changes on plant water availability is illustrated in Fig. 5a and b during the senescence phase. On one hand, the reduction in soil moisture con-tent in June due to the assimilation contributes to a more rapid decrease of LAI. Then
10
simultaneously assimilating the two data streams converges to a bias reduction in LAI. On the other hand, after this period, the slightly larger WG2 allows a vegetation re-growth both for cropland and grassland (a and b panels) not confirmed by observations. The assimilation of LAI draws back the model trajectory towards the lower observed LAI values by balancing between these two opposing tendencies in the data streams
15
as it is clearly depicted in Fig. 5c at the grid scale.
The WG2 value shows a consistent seasonality among the patches, presenting a higher dynamic range for vegetated areas than for bare soil, in relation to the wa-ter uptake by the plants. At winwa-tertime and early springtime, there are no significant differences between the vegetated patches and bare soil.
20
Finally, despite the spatial heterogeneity of a 8 km grid cell and the complex be-haviour of each vegetation type at sub-pixel level, the assimilation is able to success-fully exploit a mixed information and to come up with improved updated values aggre-gated at the grid scale.
4.3 Impact of assimilation on LAI, WG2 and fluxes at grid level 25
HESSD
10, 9057–9103, 2013Assimilation of surface soil moisture
and leaf area index
A. L. Barbu et al.
Title Page
Abstract Introduction
Conclusions References
Tables Figures
◭ ◮
◭ ◮
Back Close
Full Screen / Esc
Printer-friendly Version Interactive Discussion
Discussion
P
a
per
|
Dis
cussion
P
a
per
|
Discussion
P
a
per
|
Discussio
n
P
a
per
|
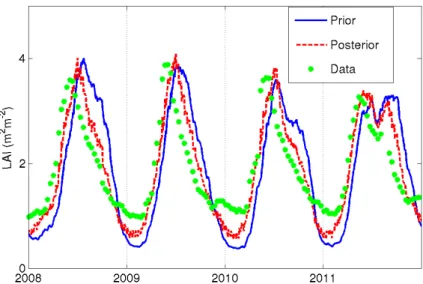
The annual cycles are rather different from one year to another. In 2008 the model has the longest cycle and the highest LAI maximum, while the satellite data show the largest LAI maximum in 2009. In 2011 LAI has a different seasonal cycle. Unusually high temperatures and low amount of precipitation characterized the 2011 spring in France. In relation to these conditions, both LAIprior and LAIsat maximums are lower.
5
A vegetation regrowth occurs in August 2011 after rainfall events.
In a previous study, Lafont et al. (2012) noted systematic differences between the maximum LAI simulated by ISBA-A-gs and the LAI derived from two remote sensing products, namely CYCLOPES and MODIS over France, as well as in the timing of the phenological cycle. In this study, comparison between LAIprior and LAIsat reveals
10
a good agreement in terms of amplitude and in terms of inter-annual variability. In con-trast, the model simulations show a shifted phenology compared to the one observed by the satellite. Among causes that determine the mismatch between the model and the data, one can mention the differences in LAI values at the beginning of the grow-ing cycle, LAIsat havgrow-ing larger values in winter (up to 1 m2m−2) than LAIprior (around
15
0.5 m2m−2). As a result, the start of the growing season tends to occur one month later in the model than in the observations. Similarly, the summertime senescence phase is delayed. The updated LAI shows a much better fit to the data over all the period. In-deed, the averaged correlation coefficient between LAIsat and the simulated LAI values increases from 0.58 for the prior LAI to 0.88 for the posterior LAI.
20
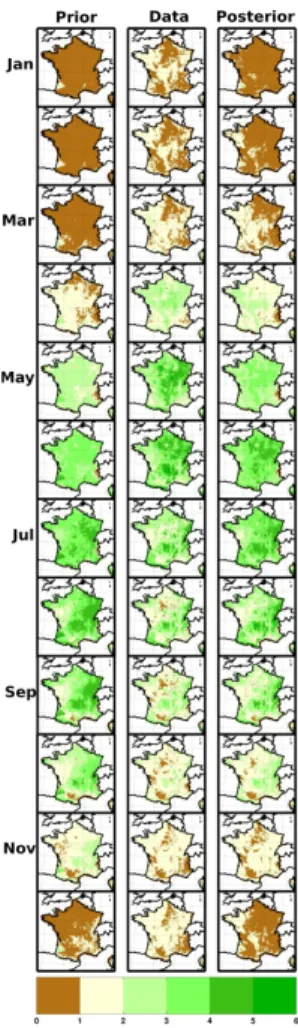
Figure 7 illustrates the maps of monthly averaged prior LAI, LAIsat and posterior LAI over France. At wintertime and in the early spring, the low LAI values already noticed reveal a bias between the model and the data. The spatial maps of satellite observa-tions show higher LAI over many regions (Bretagne, Massif Central) from December to March. The assimilation is able to maintain higher LAI values over these regions,
25
HESSD
10, 9057–9103, 2013Assimilation of surface soil moisture
and leaf area index
A. L. Barbu et al.
Title Page
Abstract Introduction
Conclusions References
Tables Figures
◭ ◮
◭ ◮
Back Close
Full Screen / Esc
Printer-friendly Version Interactive Discussion
Discussion
P
a
per
|
Dis
cussion
P
a
per
|
Discussion
P
a
per
|
Discussio
n
P
a
per
|
acute. In the model, the senescence occurs later following the same regional patterns as observed by satellite, but with a tendency to maintain high values until October. The lack of a detailed representation of the farming practices in the model (e.g. crop rotation and winter vs. summer crops) is then compensated by the assimilation. The simulated seasonal LAI cycle across crop regions is shifted towards the LAIsat cycle.
5
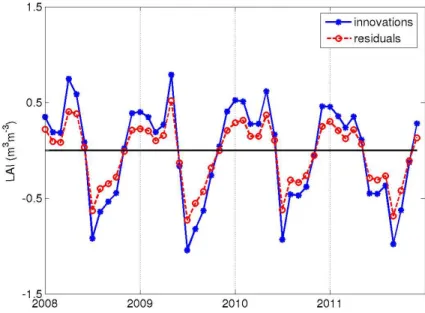
To evaluate the performance of the assimilation system, the innovations (differences between observations and background) and the residuals (differences between obser-vations and analysis) were examined. Figure 8 illustrates the LAI monthly averages of innovations and residuals. One noticeable feature is the sign of the differences between LAIsat and LAIprior. In winter and spring, the simulated values are underestimated,
10
while in rest of the period, corresponding to the senescence, they are overestimated. The assimilation tends to smooth out these differences, resulting in a less marked contrast between these two periods of the annual cycle with positive and negative in-crements of about the same magnitude. As expected, the residuals are smaller than innovations.
15
The changes operated in the seasonal LAI and WG2 cycles by the LDAS impact the seasonal and annual simulations of carbon and water fluxes. Figure 9 shows the average annual cycle over France of the relative differences (in units of %) between posterior and prior simulations with respect to prior simulations for LAI, WG2, evap-otranspiration and GPP. The largest assimilation impact on LAI is obtained in early
20
spring and ranges between+42.50 % and+89.8 %. Less marked LAI differences (be-tween−20.6 % and−32.70 %) are noticed at the end of vegetation cycle. These relative differences in LAI are translated in terms of GPP relative differences with similar magni-tude and seasonal behaviour. The impact of LAI updates on carbon fluxes is illustrated by the increased photosynthetic activity related to higher LAI values in the growing
sea-25
son (April) due to data assimilation corrections. In the same manner, the decrease in the CO2 uptake during the senescence phase (August–September), when compared
dif-HESSD
10, 9057–9103, 2013Assimilation of surface soil moisture
and leaf area index
A. L. Barbu et al.
Title Page
Abstract Introduction
Conclusions References
Tables Figures
◭ ◮
◭ ◮
Back Close
Full Screen / Esc
Printer-friendly Version Interactive Discussion
Discussion
P
a
per
|
Dis
cussion
P
a
per
|
Discussion
P
a
per
|
Discussio
n
P
a
per
|
ferences occur in May for all years. Positive relative differences are obtained in the end of the summer and during autumn. The impact of the assimilation on evapotranspira-tion is less marked (the relative difference ranges between+20.4 % and−10.3 %). In March and April the acceleration of the vegetation growth by data assimilation tends to increase plant transpiration, for example up to 17.2 % in March 2011 and 20.4 % in
5
April 2010. In the latter case, the augmentation of ET corresponds to an increased LAI of 61.3 %.
The LAI is an important driving variable for carbon and water fluxes, but the soil mois-ture has also a critical influence on the fluxes. Figure 10 shows the average monthly maps of LAI and WG2 increments and of the differences between the posterior and
10
prior water fluxes (evapotranspiration and drainage). At wintertime, from December to February, the increments in WG2 present low values due to the reduced sensitivity of the Jacobian values during the widespread rainy episodes in this period. As the updated WG2 exceeds a maximum threshold (field capacity), the excess of water is drained out. In these conditions, small variations in WG2 may lead to large variations
15
in total runoff. This impacts the drainage in winter within around 10 %. In the same period, the positive LAI increments help the model to adjust its minimum values to those of LAIsat. Due to the limited energy regime and the low vegetation activity the evapotranspiration is not sensitive to soil moisture and LAI changes.
In November, positive increments in WG2 are accumulated across the northern and
20
central parts of France. The analysis increments are translated into drainage rather than in other components of the water budget as already noticed by Draper et al. (2011). This results in an important drainage flux in December. The process is am-plified by the lower evapotranspiration rate due to lower incoming energy, as well as by the advanced phase of the senescence.
25
correc-HESSD
10, 9057–9103, 2013Assimilation of surface soil moisture
and leaf area index
A. L. Barbu et al.
Title Page
Abstract Introduction
Conclusions References
Tables Figures
◭ ◮
◭ ◮
Back Close
Full Screen / Esc
Printer-friendly Version Interactive Discussion
Discussion
P
a
per
|
Dis
cussion
P
a
per
|
Discussion
P
a
per
|
Discussio
n
P
a
per
|
tions (by 73 % on average) and tends to reduce WG2. In addition, the assimilation of LAI data into the model increases the vegetation biomass via increased LAI values and, consequently, the plant transpiration.
In June the assimilation starts to impact negatively on the LAI values, but shows a large increase in soil moisture content. As a consequence, the vegetation is less
5
stressed and a positive rate of transpiration is maintained with few exceptions in Bre-tagne and in the Mediterranean region. In July and August the maps of evapotranspi-ration fluxes show more heterogeneous patterns. One can notice a tendency for re-duced ET fluxes over the large agricultural area in northern France. In August, positive soil moisture increments across the western part of France are sufficient to maintain
10
a higher rate of evapotranspiration.
Under dry conditions, evaporation is highly sensitive to soil moisture, but with lim-ited values and variations (Seneviratne et al., 2010). This regime is relevant over the Mediterranean area in summer. The negative soil moisture increments show a de-crease in soil moisture content that stresses vegetation, and evapotranspiration is thus
15
reduced.
5 Discussion
5.1 Impact of assimilation on vegetation response to drought
Drought monitoring is a research field of major interest. The importance of the complex ecological and hydrological responses of ecosystems to drought has been highlighted
20
in a number of studies (van der Molen et al., 2011; Hirschi et al., 2011; Ciais et al., 2005). Our interest is on the short-term responses of vegetation to agricultural drought, and to their impact on the deficit of soil moisture.
As mentioned before, the spring 2011 was characterised by the most severe drought recorded in the last 50 yr in France. According to Meteo-France (http://climat.
25
HESSD
10, 9057–9103, 2013Assimilation of surface soil moisture
and leaf area index
A. L. Barbu et al.
Title Page
Abstract Introduction
Conclusions References
Tables Figures
◭ ◮
◭ ◮
Back Close
Full Screen / Esc
Printer-friendly Version Interactive Discussion
Discussion
P
a
per
|
Dis
cussion
P
a
per
|
Discussion
P
a
per
|
Discussio
n
P
a
per
|
mean were associated with temperatures up to 2.5◦
C above normal, more than in 2007 (+2.1◦C) and in 2003 (+1.8◦C). The deficit of precipitation was generally more marked on the north-western two-thirds of the country. The average soil moisture level recorded in May was similar to what could normally be found in July or August. Drought conditions were reduced in July, where precipitation was 30 % above normal.
5
In contrast to the drought of 2003 that occurred in the beginning of the senescence phase of vegetation, the drought in spring 2011 had an important impact on the vegeta-tion development in the peak of its growing phase with a diminuvegeta-tion of crop productivity (Sepulcre et al., 2012). As a result, low maximum LAI values are simulated by the model, as well as observed by satellite. While the two sources of information agree on
10
the maximum and mean values of LAI (Fig. 6), they disagree on the timing of the effects caused by the drought. The remote sensing observations show an earlier response to the occurrence of the drought.
Figure 11 shows the change rate of LAI calculated over 10 day-periods and highlights the changes in the strength and duration in the vegetation development. Unusually low
15
LAIsat values are detected in April over the western part of France, while the model does not detect the negative changes before the end of May.
On one hand, the most severe decreases in LAIsat values are observed in the middle and the end of June over large regions, while in the first 20 day period in July the evo-lution of LAI is much steadier. On the other hand, the model shows similar pronounced
20
negatives changes, but during the first 20 days of July, with a steadier evolution in the last 10 days of July.
In the LDAS configuration, the analysis is able to produce an earlier decline in LAI values. The temporal shift in the vegetation response to the severe water stress is about 20 days earlier in the western part of France and about 10 days earlier in the
25
HESSD
10, 9057–9103, 2013Assimilation of surface soil moisture
and leaf area index
A. L. Barbu et al.
Title Page
Abstract Introduction
Conclusions References
Tables Figures
◭ ◮
◭ ◮
Back Close
Full Screen / Esc
Printer-friendly Version Interactive Discussion
Discussion
P
a
per
|
Dis
cussion
P
a
per
|
Discussion
P
a
per
|
Discussio
n
P
a
per
|
the second period of July is enhanced by the assimilation allowing a faster regrowth of the vegetation.
A significant reduction of modelled photosynthesis and CO2fluxes is experienced in
June and July 2011. For example, in June, the mean reduction in GPP and NEE is of 31 and 45 % respectively, compared to the flux values averaged over the same month
5
from 2008 to 2010. This period coincides also with a decline of evapotranspiration in response to a pronounced water deficit. Despite a temperature increase above average that tends to enhance the photosynthetic activity, the water stress has an adverse effect on GPP.
On the contrary, on an annual basis, the GPP and NEE fluxes at the France scale
10
show a slight increase of 2.5 and 2 %, respectively, compared to the annual averages calculated for the period 2008–2010. This can be explained by an acceleration of the vegetation development at the beginning of the growing phase due to warmer-than-normal temperatures, as well as by an enlarged season of active biomass production after summer rainfalls. Actually, every month in 2011 was warmer-than-normal, with
15
one noticeable exception in July. Then, the large reduction of the GPP fluxes in June and July is compensated by the positive impact of higher-than-average monthly tem-peratures in early spring and in autumn and a wetter-than-average summer. The LDAS does not change this tendency.
Figure 12 illustrates the change rate in the photosynthesis fluxes from one 10 day
20
period to the next one. One can notice similar positive changes in the GPP fluxes in March and the first 10 days of April corresponding to the positive changes in LAI. In the last two-thirds of April, negative changes appear in the south-eastern regions and extend to the western and the central parts of France after assimilation, despite positive changes detected in LAI. From May to July the changes in GPP induced by analysis
25
HESSD
10, 9057–9103, 2013Assimilation of surface soil moisture
and leaf area index
A. L. Barbu et al.
Title Page
Abstract Introduction
Conclusions References
Tables Figures
◭ ◮
◭ ◮
Back Close
Full Screen / Esc
Printer-friendly Version Interactive Discussion
Discussion
P
a
per
|
Dis
cussion
P
a
per
|
Discussion
P
a
per
|
Discussio
n
P
a
per
|
5.2 Verification using SMOSMANIA database
The scarcity of soil moisture and LAI in situ data limits the possibility of an independent validation of the assimilation results. In addition, point measurements are not neces-sarily representative of a coarser pixel scale, and thus, are difficult to interpret when compared to model results.
5
Despite the above limitation, the results of the assimilation were evaluated against the 12 SMOSMANIA (Soil Moisture Observing System-Meteorological Automatic Net-work Integrated Application) sites of Meteo-France located in the South West of France (Calvet et al., 2007). All of the stations are located in natural fallow.
The volumetric soil moisture values are derived from capacitance probes ThetaProbe
10
ML2X of Delta-T Devices. Soil moisture observations are gathered at depths of 5, 10, 20, 30 cm, every 12 min. For this verification only measurements made at 30 cm were used.
Since the observations are representative only of the first 30 cm of soil, the impact of the analysis on WG2 is investigated by computing the absolute correlation and anomaly
15
correlation between the simulated and observed soil moisture. The statistics are cal-culated at each station over the entire period. The measurements are compared to the simulated WG2 corresponding to the grassland patch. The anomaly time series are calculated by using a 30 day moving window as described in Draper et al. (2011). The significance level of correlations (p values<0.01) was obtained for all stations. Soil
20
moisture is in a good agreement with in situ measurements at the SMOSMANIA sta-tions, with correlations higher than 0.7 which indicates that the model captures already well the soil moisture variability. Moreover, for two stations, the correlation coefficient is greater than 0.9. Generally, the correlations values do not vary significantly showing a low impact of the analysis. However, for all stations, the mean correlation is 0.82
with-25
HESSD
10, 9057–9103, 2013Assimilation of surface soil moisture
and leaf area index
A. L. Barbu et al.
Title Page
Abstract Introduction
Conclusions References
Tables Figures
◭ ◮
◭ ◮
Back Close
Full Screen / Esc
Printer-friendly Version Interactive Discussion
Discussion
P
a
per
|
Dis
cussion
P
a
per
|
Discussion
P
a
per
|
Discussio
n
P
a
per
|
6 Conclusions
In the present study, a first attempt to use the multi-patch ISBA-A-gs land surface model in a multi-variate and multi-scale EO data assimilation experiment at a regional scale was made. The France domain encompasses a wide variety of soil and vegetation ecosystems. At 8 km pixel scale, there is a high degree of heterogeneity that should
5
be taken into account. Each grid cell is represented as a mosaic of 12 land covers or patches. The ISBA-A-gs LSM provides a detailed computation of the surface fluxes of energy, water and carbon at the sub-grid (patch) level and allows aggregating the information from different ecosystem types. Following this approach, a land data as-similation system was designed to produce the updated variables for each land cover
10
by using one grid-scale observation. It was demonstrated that useful information can be extracted from the data signal at the grid level and distributed among the patch structure of the model.
The assimilation was performed over the France domain for a period of 4 yr from 2008 to 2011 using an extended Kalman filter in order to incorporate the SSM
prod-15
uct derived from ASCAT together with the GEOV1 LAI satellite product. An important motivation for combining two sources of information within a land surface model is the expectation that they will contribute in a more coherent manner to reduce model uncer-tainties. At the same time, the use of different types of data at different resolutions may generate new challenges in the construction of an appropriate observation operator.
20
However, it has been shown in this study that, even using a rather simple CDF match-ing procedure, meanmatch-ingful information can be captured from the data and integrated in the model.
The model performance prior to assimilation was discussed in comparison with ob-servations. Differences between observed and simulated LAI values were noticed at
25
HESSD
10, 9057–9103, 2013Assimilation of surface soil moisture
and leaf area index
A. L. Barbu et al.
Title Page
Abstract Introduction
Conclusions References
Tables Figures
◭ ◮
◭ ◮
Back Close
Full Screen / Esc
Printer-friendly Version Interactive Discussion
Discussion
P
a
per
|
Dis
cussion
P
a
per
|
Discussion
P
a
per
|
Discussio
n
P
a
per
|
aforementioned differences. These discrepancies were identified as being partially re-sponsible for a one-month delay in the LAI seasonal cycle. The assimilation is able to significantly reduce this delay and, consequently, to increase the correlation between the model and the data by more than 30 %.
Errors affecting model simulations may be related to the distribution of bare soil and
5
vegetation and may depend on the vegetation type. For example, croplands present more heterogeneities than grasslands and many processes of anthropogenic nature are not described for crops in the model. In this study, model errors were set to a sin-gle value for all patches. However, even under this simple assumption, the assimilation compensates for the lack of description of managed ecosystems, by reducing the
dura-10
tion of the crop phenological cycle that tends to be too long in the model. The choice of model error may be refined by assigning different error statistics to different ecosystems and make use of observed LAI at a finer resolution.
The assimilation results depend also to a large extent upon the quality of the data to be assimilated. On one hand, the data used in this study show potential within the land
15
data assimilation. On the other hand, the remotely sensed SSM data exhibit a number of non-realistic low values associated with large uncertainties over densely vegetated areas (Kidd et al., 2011). This may be detrimental to analysis by causing too large soil moisture depletion. Nevertheless, this effect has been minimized thanks to the seasonal bias removal performed before the assimilation.
20
Many studies indicate the presence of systematic biases between the observations and the model outputs for soil moisture (Walker et al., 2003; De Lanoy et al., 2007) and LAI (Jarlan et al., 2008; Lafont et al., 2012). These biases have multiple origins related to model inputs, model physics or data retrieval procedures. Correcting only for the existing bias in observations without properly accounting for model uncertainties leads
25
HESSD
10, 9057–9103, 2013Assimilation of surface soil moisture
and leaf area index
A. L. Barbu et al.
Title Page
Abstract Introduction
Conclusions References
Tables Figures
◭ ◮
◭ ◮
Back Close
Full Screen / Esc
Printer-friendly Version Interactive Discussion
Discussion
P
a
per
|
Dis
cussion
P
a
per
|
Discussion
P
a
per
|
Discussio
n
P
a
per
|
The impact of the assimilation upon carbon and water fluxes was also studied. It was shown that changes in LAI and soil moisture influence consistently the CO2 and water balances. The changes on the GPP fluxes produce smaller differences in their seasonal cycle than for the LAI, but they follow the same tendency with increased values in early spring and decreased values in autumn. The impact of the assimilation
5
on evapotranspiration produces changes between 10 and 20 %. A noticeable fact is the reduction of the ET fluxes over large agricultural areas. In November and December, the assimilation provides positive soil moisture increments in the root-zone reservoir that causes a supply of water to be drained out. The increased drainage fluxes by assimilation together with the fact that the surface scheme ISBA has an excessive
10
drainage rate (Decharme et al., 2011) indicate that the assimilation leads to important river discharge changes. A comparison against in situ observations of soil moisture shows a positive impact of the assimilation on the root-zone soil moisture.
A lagged response of vegetation to the soil moisture deficit in the root zone was pointed out. A single, thick root-zone soil layer represents the soil hydrology in the
15
model version used in this study. Such description increases the time to deplete soil moisture causing this slow response to dry conditions. Also, the propagation of surface soil moisture information within deeper layers may be affected by the lack of vertical resolution of the model. In that respect, a multi-layer version of the soil hydrology is expected to improve the overall performance of the system. Increasing the number of
20
soil layers will allow an explicit representation of a vertical distribution of the root profile in the soil and then, a more realistic vegetation response to water stress. Moreover, the short-term effects of the severe drought of 2011 on the vegetation development were analysed. It was shown that the assimilation helped the model to better respond to the drought conditions and also to react more efficiently to rainfall events after the
25