Cancer Cohort Reveals a MSI-Specific Profile and
Chromosome X Amplification in Male Patients
Hassan Brim1*, Edward Lee1, Mones S. Abu-Asab2, Mohamed Chaouchi3, Hadi Razjouyan1, Hassanzadeh Namin1, Ajay Goel4, Alejandro A. Scha¨ffer5, Hassan Ashktorab1*
1Department of Medicine and Cancer Center, College of Medicine, Department of Pathology, Howard University, Washington, D.C., United States of America,2National Cancer Institute, National Institutes of Health (NIH), Department of Health and Human Services (DHHS), Bethesda, Maryland, United States of America,3Department of Physiology and Biophysics, Georgetown University School of Medicine, Washington, D.C., United States of America,4Baylor Research Institute and Sammons Cancer Center, Baylor University Medical Center, Dallas, Texas, United States of America,5National Center for Biotechnology Information, National Institutes of Health (NIH), Department of Health and Human Services (DHHS), Bethesda, Maryland, United States of America
Abstract
Objective:DNA aberrations that cause colorectal cancer (CRC) occur in multiple steps that involve microsatellite instability (MSI) and chromosomal instability (CIN). Herein, we studied CRCs from AA patients for their CIN and MSI status.
Experimental Design:Array CGH was performed on 30 AA colon tumors. The MSI status was established. The CGH data from AA were compared to published lists of 41 TSG and oncogenes in Caucasians and 68 cancer genes, proposed via systematic sequencing for somatic mutations in colon and breast tumors. The patient-by-patient CGH profiles were organized into a maximum parsimony cladogram to give insights into the tumors’ aberrations lineage.
Results:The CGH analysis revealed that CIN was independent of age, gender, stage or location. However, both the number and nature of aberrations seem to depend on the MSI status. MSI-H tumors clustered together in the cladogram. The chromosomes with the highest rates of CGH aberrations were 3, 5, 7, 8, 20 and X. Chromosome X was primarily amplified in male patients. A comparison with Caucasians revealed an overall similar aberration profile with few exceptions for the following genes; THRB, RAF1, LPL, DCC, XIST, PCNT, STS and genes on the 20q12-q13 cytoband. Among the 68 CAN genes, all showed some level of alteration in our cohort.
Conclusion: Chromosome X amplification in male patients with CRC merits follow-up. The observed CIN may play a distinctive role in CRC in AAs. The clustering of MSI-H tumors in global CGH data analysis suggests that chromosomal aberrations are not random.
Citation:Brim H, Lee E, Abu-Asab MS, Chaouchi M, Razjouyan H, et al. (2012) Genomic Aberrations in an African American Colorectal Cancer Cohort Reveals a MSI-Specific Profile and Chromosome X Amplification in Male Patients. PLoS ONE 7(8): e40392. doi:10.1371/journal.pone.0040392
Editor:Daniela Aust, University Hospital Carl Gustav Carus, Germany
ReceivedFebruary 15, 2012;AcceptedJune 6, 2012;PublishedAugust 6, 2012
Copyright:ß2012 Brim et al. This is an open-access article distributed under the terms of the Creative Commons Attribution License, which permits unrestricted use, distribution, and reproduction in any medium, provided the original author and source are credited.
Funding:This work was supported by Grant#CA102681, funded by the National Cancer Institute (NCI), National Institutes of Health, by the Intramural Research Program of the National Institutes of Health, National Cancer Institute and National Library of Medicine, and by Research Centers in Minority Institutions (RCMI). The funders had no role in study design, data collection and analysis, decision to publish, or preparation of the manuscript.
Competing Interests:The authors have declared that no competing interests exist.
* E-mail: [email protected] (HA); [email protected] (HB)
Introduction
Numerous studies have investigated the mechanisms of DNA changes leading to colorectal cancer (CRC), which is the third most common cancer in the US [1]. CRC incidence is high in African-Americans (AAs), among whom it causes a higher proportion of deaths than in other populations (1). Most CRC arise from adenomas, in a process described as adenoma-carcinoma sequence [2]. The initiation and progression of CRC is associated with alterations in the function of oncogenes and tumor suppressor genes.
Three major mechanisms of genomic instability in CRC have been described: microsatellite instability (MSI), chromosomal instability (CIN), and more recently CpG island methylation phenotype (CIMP). Excessive promoter methylation of hundreds
of genes results in the CIMP is part of the epigenetic instability in CRC. More than one mechanism may occur in the same tumor. In MSI, which occurs in about 15% of CRC, DNA mismatch repair genes are either mutated or methylated leading to tumors with a microsatellite instability phenotype (denoted MSI-High, MSI-H, or MIN) [3].
context of a subcategory of CRC called hereditary non-polyposis colorectal cancer or Lynch syndrome, in which patients have heterozygous gremlin mutations of genes such as MLH1 and
MSH3[6]. The acquisition of recurrent chromosomal gains and losses during the progression from high-grade adenomas to invasive carcinomas has been repeatedly found in CIN CRC tumors [7]. CIN results from specific mutations or gene rearrangement and that could manifest as structural defects involving centromeres or centrosomes, microtubule dysfunction, telomere erosion, chromosome breakage and failure of cell cycle checkpoints (5). One of the earliest acquired genetic abnormal-ities during CRC progression involves chromosome 7 copy number gains which are observed in some colon adenomas as well [8]. At later stages of tumor progression, other specific chromosomal aberrations become more common, such as gains on chromosomes 8q, 20q [9], 7, 13 [10,11] and copy number losses on chromosomes 8p, 17p, 18q [10,12] 15q and 20q [13]. For some years, CIN and MSI tumors were considered as mutually exclusive, and it was thought that MSI tumors generally have stable, diploid karyotypes [14,15]. However, recent studies have found that MSI and CIN can occur in the same tumor [16,17]. Trautmann et al. found that at least 50% of MSI-H tumors have some degree of simultaneous chromosomal alter-ations [18]. Although evidence for some degree of CIN could be observed in the majority of MSI-H tumors, the pattern of specific gains and losses between MSI-H and MSS tumors is still poorly understood. MSI-H tumors tend to harbor gains of chromosomes 8, 12 and 13 and losses of 15q and 18q, while MSS tumors have a high degree and variable range of chromosomal aberrations [13,18]. Chromosomal aberrations, like homozygous and hetero-zygous deletions or amplifications, alter the DNA copy number of large genomic regions or even whole chromosomal arms, leading to the inactivation of tumor suppressor genes or to the activation of oncogenes. Lassmann et al. studied 287 target sequences in Caucasian colorectal tumor cell DNA and found aberrations in specific regions of chromosomes 7, 8, 13, 17 and 20 [19].
Studies that explore differentially expressed genes that cause tumorigenesis or tumor development may lead to discovering specific targets for cancer therapy and increase our understanding of the process of tumorigenesis. We have previously published results from a genome wide analysis of 15 AA CRC tumors [20] that microduplications are mainly present in chromosomes 20q, 8q, and 7q while microdeletions occur in 18q, 8p and Xp in AAs. The most frequently amplified region was 20q12-13 that includes the genes: TNFSF6B, PTPN1, PRPF6 and NCOA3. The most frequently deleted genes wereLPL(33%),HIC1(33%), andBCL2
(27%) on chromosomes 8p22, 17p13.3 and 18q21.3, respectively. Our study indicated that there are recurrent aberrations in CRC involving chromosomes 20, 18, 17, 8, and 7 shared with Caucasian CRC patients. In addition, aberrations at chromosomes 11, 17p and X may be prominent in AAs.
Based upon these findings, we hypothesized that chromosomal aberrations in CRCs from AA patients, if validated in a larger cohort, could be useful for studying the racial differences and the disease disparity statistics in the AA population. Therefore, we investigated the CIN and status in a larger cohort of additional AA CRC patients and compared our results with the findings in Caucasians [19] as well as with a list of colon cancer genes established by Sjo¨blom et al. based on their sequencing of 13,023 genes in 11 colon tumors [21]. We also performed a parsimony phylogenetic analysis of all recorded genomic aberrations to identify genomic signatures that might associate with clinical and pathological characteristics of the analyzed CRCs. The general
aim of this study was to identify the chromosomal aberrations in African-American CRCs to delineate the specific genomic events of CIN in this high risk population.
Materials and Methods
Ethics Statement
This study was approved by the Howard University Institutional Review Board, and written, informed consent was obtained from all participants.
Patient selection
Fresh frozen archived samples were used. Colonic biopsies (n = 30) were obtained from African-American patients undergo-ing colonoscopy at Howard University Hospital. This study was approved by the Howard University Institutional Review Board. Clinical data collected on each patient included race, gender, associated past medical history, medication use, and family history of colorectal cancer. Patients were deemed eligible if colonoscopy resulted in a first diagnosis of colon cancer, confirmed by histopathology. From the medical records, clinical information was collected and recorded based on the American Joint Committee on Cancer (AJCC) staging system. All patients in this study were African Americans by self-report.
Sample selection and DNA extraction for array comparative genomic hybridization (aCGH)
Fresh tumor blocks were cut into 5-mm thick sections on Superfrost slides (Fisher Scientific, Pittsburgh, PA). The tumor and normal areas were delineated by a pathologist using the matched hematoxylin and eosin (H&E) slide were microdissected from which DNA was extracted using Puregene kit according to the manufacturer’s instructions (Qiagen, Germantown, MD). The goal of the microdissection was to minimize the cross-contamina-tion of normal and tumor tissues, which could impact the outcome of the experiment.
MSI analysis
DNA from the analyzed tumors was used as a template in PCR reactions with five primer pairs, corresponding to the standard panel for MSI detection in colon cancer samples (BAT25, BAT26, NR21, NR22 and NR27), as described previously [22,23,24]. Samples that showed at least two PCR fragments with sizes different from the wild type were labeled microsatellite instability high (MSI-H), those with only one instability marker were labeled microsatellite instability low (MSI-L) while those with all PCR fragments with the expected size were labeled as microsatellite stable (MSS) [22,23,24].
(1.5mg; Promega) were labeled by random priming with Cy5-dUTP and Cy3-Cy5-dUTP, respectively, using the Agilent Genomic DNA Labeling Kit Plus. Following the labeling reaction, the individually labeled test and reference samples were concentrated using Microcon YM-30 filters (Millipore, Billerica, MA) and then combined. Following probe denaturation and pre-annealing with
Cot-1DNA, hybridization was performed at 65uC with rotation for 40 hours at 20 rpm. Four steps were done with Agilent Oligo CGH washes: wash buffer 1 at room temperature for 5 min, wash buffer 2 at 37uC for 1 min, an acetonitrile rinse at room temperature for 1 min and a 30 sec wash at room temperature in Agilent’s Stabilization and Drying Solution. All slides were scanned on an Agilent DNA microarray scanner. Data including Copy Number Variations were obtained by Agilent Feature Extraction software 9 and analyzed with Agilent Genomic Workbench 5.0 software, using the statistical algorithms z score and ADM-2 according to sensitivity threshold respectively at 2.5 and 6.0 and a moving average window of 0.2 Mb. Mapping data were analyzed on the human genome sequence using the NCBI database build 35 also known as hg17 (http://www.ncbi.nlm.nih. gov).
Computational analysis of genes targeted by copy number aberrations
To determine whether specific genes were gained or lost in each tumor sample, we compared the genomic locations of those genes with the gained and lost intervals in the ‘‘IntervalBasedReport’’ produced (ADM-2) for each case by the array CGH software. To do this comparison, we developed UNIX scripts and programs in C and Perl. Part of the IntervalBasedReport is the magnitude of each gain or loss, which enabled us to filter the resultant results by order of their magnitude and keep only those events that were above the threshold of 1.2-fold for gains and below the threshold 0.8-fold for losses.
Parsimony Phylogenetic Analysis of CGH Microarray Data Microarray data analysis generally focused on specific genes of known relevance to the pathology at hand. Here, we have taken all chromosomal aberrations into consideration to conduct a parsimony phylogenetic analysis. Briefly, to find out the distribution of aberrations for each specimen in relation to the total aberrations of all specimens the following procedure was carried out: all aberrations of all the cancer specimens were
Table 1.Clinico-pathological characteristics of the patients analyzed in this study.
Patient Specimen# Age Sex Stage Location Differentiation MSI #Aberrations
268 07-2378 94 F 1 R Moderately S 30
283 07-5430 54 M 1 R well diff S 35
308 09-1574 48 M 2 L Moderately S 10
270 07-3920 51 M 2 L Moderately S 99
269 07-3698 53 M 2 L Moderately S 65
267 07-1361 66 M 2 R Moderately H 63
272 07-4027 65 F 3 L Moderately S 30
277 07-5330 72 F 3 R Moderately S 31
275 07-4855 87 F 3 R Moderately S 26
285 08-2842 52 F 4 R Moderately S 13
287 08-3072 73 M 4 R Moderately S 8
2 05-3518 65 M 1 R Moderately S 2
1 05-3429 65 F 2 L Moderately S 13
5 05-4671 71 M 2 L Moderately S 29
14 06-4708 65 M 3 L well diff S 27
282 08-2321 55 F 3 R Poorly S 36
7 05-5288 73 F 3 R Moderately S 8
273 07-4527 71 M 3 R Moderately S 37
13 06-4383 53 M 3 R Moderately S 5
8 05-5581 61 M 3 R Moderately S 10
4 05-4211 57 M 3 R Moderately S 5
12 06-2689 53 F 4 R Moderately S 88
11 06-0477 51 F 2 L Moderately L 33
10 05-5770 69 F 2 L Moderately L 13
307 09-1637 53 F 3 R Moderately L 10
279 07-5443 60 M 3 R Moderately L 6
9 05-5659 54 F 2 R Moderately H 4
6 05-5026 83 F 3 R Moderately H 14
3 05-4203 68 F 3 R Moderately H 9
15 06-5215 64 M 3 R Moderately H 5
summed up and the duplicates removed; each specimen’s aberrations list was compared to the total list of aberrations and each aberration scored as present (1) or absent (0), this polarity assessment produced a new data matrix of CGH data. The new data matrix was processed for maximum parsimony with MIX algorithm (of the PHYLIP analytical package to produce the cladograms.
Statistical analysis
Numerical data was expressed as mean6standard deviation (SD). Student’s t-test or one-way analysis of variance (ANOVA) were used for comparison of means. Categorical variables were compared using the chi-square test. P-values less than 0.05 were considered significant. Statistical analysis was performed using the SPSS 19.0 software package (IBM Corp., Somers, NY, USA).
Results
Characteristics of the analyzed samples
Our study cohort was comprised of 30 colon cancers from AA patients. Males and females were equally represented in this group. The mean age was 63.5 [SD = 1.1]. The tumors were left-sided in 9 patients (5 males and 4 females) and right-left-sided in 21 patients (10 males and 11 females). Most tumors (n = 27) were moderately differentiated, one was poorly differentiated while two were well differentiated. Half the tumors (n = 15) were of stage 3, nine tumors were stage 2, three were stage 4, and three were stage 1 (Table 1).
MSI analysis
MSI results were obtained for all patients in this study. Of these 30 samples, 21 were microsatellite stable, 4 were microsatellite instable-low (MSI-L) and 5 were MSI-H. All MSI-H tumors were proximal while the MSI-L tumors were equally distributed throughout the colon. No associations were found with other clinical and demographic data. (Table 2).
Genomic alterations in various chromosomes
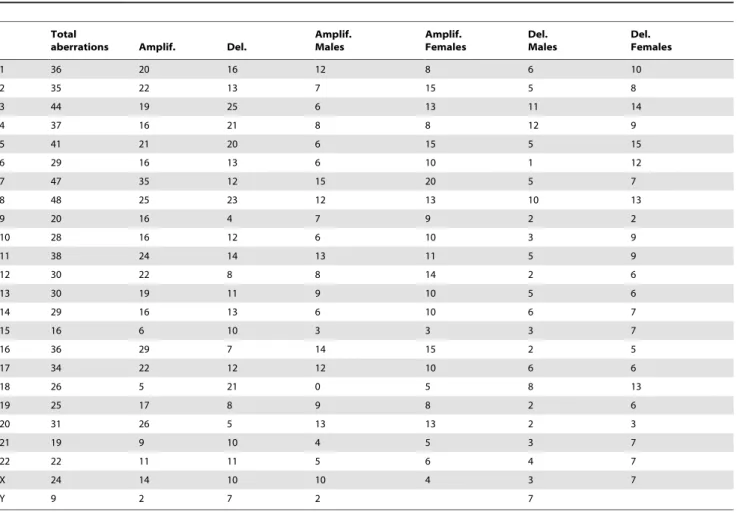
All chromosomes were harbored a spectrum of alterations in multiple tumors. The chromosomes that had the fewest aberra-tions were chromosomes 15 and 21, with 16 and 19 aberraaberra-tions
respectively; chromosome 8 had the most aberrations (n = 48). Other chromosomes with high aberration counts were chromo-somes 3, 5 and 7 with 44, 41 and 47 aberrations respectively. Male and female patients showed a similar distribution of alterations except on three chromosomes: 1) chromosome X was primarily amplified in males (10/15 males vs. 4/15 females), 2) chromosome 20 was also primarily altered in male patients, and 3) chromosome 18 had more alterations in females.
Genomic alterations per case
A total of 764 aberrations were reported for all samples (average of 25.46 per tumor). The tumor with the least number of aberrations had 2 while the one with most aberrations had 99. The patient with the highest number of aberrations was 51 year male with a stage 2 tumor, while the one with the least aberrations was a 65 year old male with a stage 1 neoplasm. Overall, the number of chromosomal aberrations did not appear to be either age- or stage–related (Tables 1 & 3). The 15 female patients had a total of 358 aberrations with an average of 23.8 per patient. Male patients had 406 aberrations with an average of 27 per tumor. The statistical analysis revealed that the number of aberrations per sample did not associate with any clinical or demographical parameters (Table 4). An exception to this rule was the MSI-H tumors that showed fewer aberrations when compared to non MSI-H CRC, but there were not enough MSI-H samples to achieve significance (Table 4).
Comparison of the aCGH data with the CRC CAN genes A comparison of the our aCGH data with a list of 68 genes identified through the sequencing of 11 colon cancer tumors revealed that all of these genes, exceptACTL9, are altered in at least one of the 30 tumors analyzed here. The altered genes showed different frequencies and types of aberrations (Table 5). In comparison to Caucasians, the following genes were predomi-nantly amplified in AA population:ADAMST18, CD248, CSMD3, EPHB6, ERGIC3, EXOC4, GALNS, GNAS, KR73. LMO7, MLL3, MMP2, NF1RUNX1T1, SFRS6SLC29A1, SLC44A4TP53, UQCRC2, and ZNF442. These genes were amplified in at least one third of the tested samples. Deletions were less prevalent and the most frequently deleted genes on the candidate list are:
ADAM29, APC, FBXW7, HAPLN1, NF1, SMAD2, SMAD4, and
Table 2.MSI analysis and association with clinical and demographical parameters.
MSI
Stable (n = 21) Low (n = 4) High (n = 5) P value
Median age (25–75% interquartile) 65 (53–71) 56.5 (51.5–66.7) 66.0 (59–75.5) 0.4
Gender, no (%) 0.4
Male 12(57.1) 1(25) 2 (40)
Female 9 (42.9) 3 (75) 3 (60)
Location, no (%) 0.2
Right 14(66.7) 2(50) 5 (100)
Left 7 (33.3) 2 (50) 0
Stage 0.7
One 3 0 0
Two 5 2 2
Three 10 2 3
Four 3 0 0
TP53.SMAD2andSMAD4were deleted in 16 out of 30 samples (Table 5).
Comparative analysis of aCGH data between AAs and Caucasians
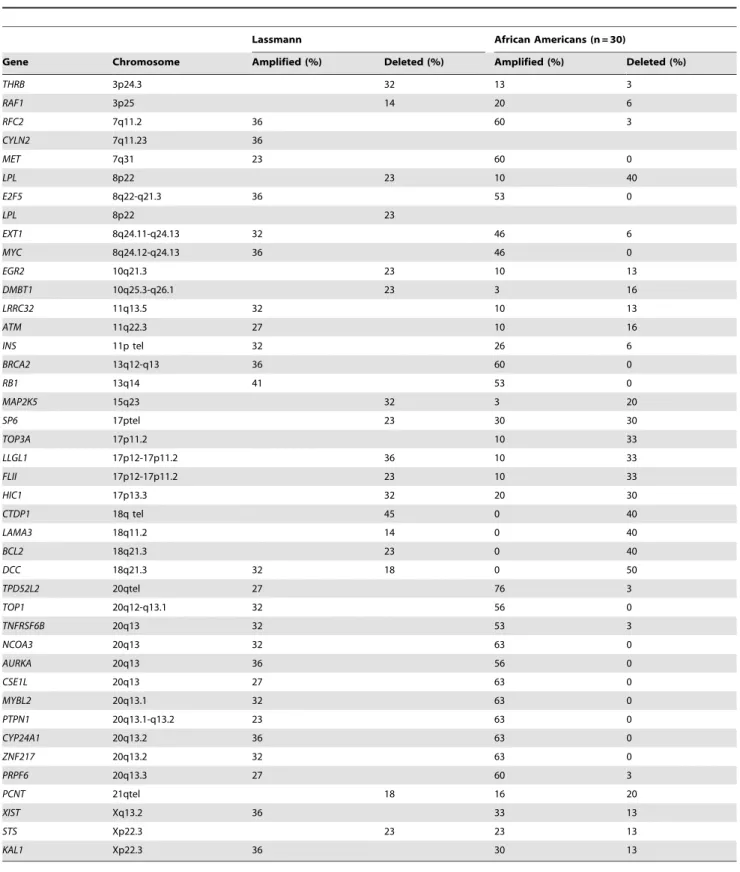
Lassmann et al. examined the aberration status of 41 known oncogenes and tumor suppressor genes in CGH data from 22 Caucasians [19]. We compared the outcome of their analysis with our data from African American patients. Overall, the two populations displayed similar aberration profiles for the genes listed in Table 5. However, some differences were noted for the following genes;THRB, RAF1, LPL, DCC, XIST, PCNT, STS,as well as many genes on the 20q12-q13 cytoband (Table 5, Figure 1).
Phylogenetic analysis of the CRC aCGH data
A maximum parsimony phylogenetic analysis was conducted on the CGH data through MIX algorithm (of the PHYLIP analytical package [25]) to produce the phylogenetic cladogram. The generated cladogram branched into two main clades and the partition and further subdivisions into clusters are summarized schematically in Figure 2. One clade included 22 patients (right-sided CRC: 63%; male: 50%; higher stage [.2]: 59%) that included all MSI-H samples. The other clade included 8 patients (right-sided CRC: 87%; male: 50%; higher stage .2: 71%, all were non-MSI. The first clade of 22 patients was further divided into two smaller groups with 14 (right sided CRC: 57%; male: 43%; higher stage [.2]: 43%) and 8 (right sided CRC: 75%; male:
Table 3.Aberrations patterns in each chromosome in African American CRC tumors.
Total
aberrations Amplif. Del.
Amplif. Males
Amplif. Females
Del. Males
Del. Females
1 36 20 16 12 8 6 10
2 35 22 13 7 15 5 8
3 44 19 25 6 13 11 14
4 37 16 21 8 8 12 9
5 41 21 20 6 15 5 15
6 29 16 13 6 10 1 12
7 47 35 12 15 20 5 7
8 48 25 23 12 13 10 13
9 20 16 4 7 9 2 2
10 28 16 12 6 10 3 9
11 38 24 14 13 11 5 9
12 30 22 8 8 14 2 6
13 30 19 11 9 10 5 6
14 29 16 13 6 10 6 7
15 16 6 10 3 3 3 7
16 36 29 7 14 15 2 5
17 34 22 12 12 10 6 6
18 26 5 21 0 5 8 13
19 25 17 8 9 8 2 6
20 31 26 5 13 13 2 3
21 19 9 10 4 5 3 7
22 22 11 11 5 6 4 7
X 24 14 10 10 4 3 7
Y 9 2 7 2 7
doi:10.1371/journal.pone.0040392.t003
Table 4.Number of aberrations and associations with clinical and demographical data.
Aberration Mean (SD) P value
Gender 0.7
Male 27.0(28.7)
Female 23.8 (20.6)
Location 0.2
Right 21.1 (21.9)
Left 35.4 (28.8)
Stage 0.2
1 22.3(17.7)
2 36.5(32.3)
3 17.2(6–30)
4 36.3 (44.8)
MSI 0.3
Non-MSI-H 26.7(24.8)
MSI-H 19.0 (24.9)
62%; higher stage [.2]: 87%, p = 0.04) patients. It is noteworthy that 80% (4/5) of MSI-H tumors grouped together within the 14 patients’ clade (Figure 2). All of these tumors have a very low number of aberrations (,15). The only MSI-H tumor that did not cluster with the others have a high number of aberrations (63) and
as such, was most likely driven by chromosomal instability rather than by microsatellite instability.
Table 5.Comparison of AA data with those from Caucasian patients.
Lassmann African Americans (n = 30)
Gene Chromosome Amplified (%) Deleted (%) Amplified (%) Deleted (%)
THRB 3p24.3 32 13 3
RAF1 3p25 14 20 6
RFC2 7q11.2 36 60 3
CYLN2 7q11.23 36
MET 7q31 23 60 0
LPL 8p22 23 10 40
E2F5 8q22-q21.3 36 53 0
LPL 8p22 23
EXT1 8q24.11-q24.13 32 46 6
MYC 8q24.12-q24.13 36 46 0
EGR2 10q21.3 23 10 13
DMBT1 10q25.3-q26.1 23 3 16
LRRC32 11q13.5 32 10 13
ATM 11q22.3 27 10 16
INS 11p tel 32 26 6
BRCA2 13q12-q13 36 60 0
RB1 13q14 41 53 0
MAP2K5 15q23 32 3 20
SP6 17ptel 23 30 30
TOP3A 17p11.2 10 33
LLGL1 17p12-17p11.2 36 10 33
FLII 17p12-17p11.2 23 10 33
HIC1 17p13.3 32 20 30
CTDP1 18q tel 45 0 40
LAMA3 18q11.2 14 0 40
BCL2 18q21.3 23 0 40
DCC 18q21.3 32 18 0 50
TPD52L2 20qtel 27 76 3
TOP1 20q12-q13.1 32 56 0
TNFRSF6B 20q13 32 53 3
NCOA3 20q13 32 63 0
AURKA 20q13 36 56 0
CSE1L 20q13 27 63 0
MYBL2 20q13.1 32 63 0
PTPN1 20q13.1-q13.2 23 63 0
CYP24A1 20q13.2 36 63 0
ZNF217 20q13.2 32 63 0
PRPF6 20q13.3 27 60 3
PCNT 21qtel 18 16 20
XIST Xq13.2 36 33 13
STS Xp22.3 23 23 13
KAL1 Xp22.3 36 30 13
Discussion
Genome-wide studies have the potential to reveal genetic markers that may help explain the higher incidence of colorectal cancer in the African American population. We have previously conducted several studies on the role of MSI, methylation of CAN genes and mutations of known genes such as BRAF and KRAS (21–23, 25), as well as an aCGH analysis on a smaller number of CRCs from AA population (19). These studies were instrumental in revealing some of the specific genetic and epigenetic alterations that occur in this population. Herein, we elaborated upon our previous work and conducted a microsatellite instability analysis as well as whole genome analysis of copy number aberrations in CRC from AA patients (n = 30) with the goal of finding overlapping alterations between these two types of DNA variations. More specifically, phylogenetic clustering of the tumors based on copy number data was used to demonstrate that MSI-H tumors cluster together in the background of widespread chromosomal instability, a paradigm that has been poorly understood in the past.
The AA population analyzed in this study was relatively younger (mean age of 63.5 years) reflecting the disproportionate burden of CRC among African Americans [26,27]. Seventy percent of the tumors were proximal confirming an observed population-based trend of tumor location in this population. While 90% of the tumors were moderately differentiated, more than 60% were higher than stage 2. These data suggest that many of these tumors would have dedifferentiated in a short amount of time leading to their invasiveness and metastasis. These data taken together shed some insight into the higher incidence and aggressiveness of CRC in AAs from clinical and pathological standpoints.
The MSI analysis revealed that 5 out of 30 tested tumors were MSI-H (17%). This MSI-H rate remains higher than that reported in the general population [24]. It is also noteworthy that 4 tumors were MSI-L.
There was an average of 25.46 copy number aberrations detected per tumor based upon our aCGH results. The MSI-H tumors alone showed a lower rate of 19.0 aberrations, while the non-MSI-H tumors showed 26.7 per tumor. This quantitative difference is supported by the concept that MSI-L tumors, unlike the MSI-H ones, are generally driven by chromosomal instability [28]. The overall number of aberrations did not seem to be associated with any of the clinico-pathological parameters (Table 4). There were tumors with a higher number of aberrations that seem to have the CIN phenotype, while there were others with fewer aberrations that are most likely an accidental-manifestation of MSI or have the CIMP phenotype. Our CGH analysis of a few colonic adenomas revealed more stable karyotypes with fewer aberrations (data not shown).
Chromosomes 3, 5, 7 and 8 were the most frequently altered in our group of patients. There are several publications reporting that these chromosomes contain cancer genes that are relevant to colon cancer, as well as in other cancers. Chromosome 3 contains
MLH1, a DNA mismatch repair gene that leads to the MSI-H phenotype upon deletion, mutation or its transcription silencing [29].PPM1L,another CRC gene on chromosome 3, was shown to have variable copy number in APC-negative familial adenomatous polyposis CRC [30]. Chromosome 5 displayed 41 aberrations equally distributed among deletions and amplifications [20/21].
APCis an important CRC gene on chromosome 5;APCplays a major role in the early steps on CRC events both in sporadic CRC as well as in hereditary FAP syndrome [31]. Chromosome 7 contains caretaker genes, such asPMS2 [32], a DNA mismatch repair gene, and TSGs, such as PIK3CG [33]. Since TSGs are expected to be deleted, the disproportionate amount of gains [35 amplifications/12 deletions] on chromosome 7 quite intriguing. Chromosome 8 was the one with most aberrations [25 amplifi-cations/23 deletions]. This chromosome is known as the hotspot for CRC tumor progression [34].
Another chromosome with an interesting pattern of aberrations was chromosome X, with 24 aberrations (14 amplifications/20 deletions). This chromosome has been described as the carrier of TSGs. Our previous findings, findings lend further support to our current results that chromosome X was preferentially amplified in male CRC patients [20]. Indeed, 10 out of 15 male patients displayed amplification for chromosome X in comparison to only 4 female patients. A similar finding was observed in Japanese male CRC patients [35]. This amplification might suggest that females with X chromosome allelic imbalance might be more prone to developing cancers.
A comparison of our data with those obtained in Caucasians [19] for 41 known oncogenes and TSGs revealed overall a similar aberration profile in the two populations. One interesting gene showing population-specific patterns is Xist, an RNA gene X whose expression determines the pattern of chromosome X inactivation in females [36].Xistwas amplified in approximately one third of both Caucasian and AA tumors, but was deleted only in AAs (13%). Other X- chromosome-related genes with differences between the populations wereSTS (steroid sulfatase) that was primarily deleted in Caucasians and amplified in AAs and
KAL1,with a pattern similar toXist.STSis known to be involved in female cancers, such as ovarian and breast cancers [37,38], but not much is known about its potential role in CRC. KAL1 was amplified and deleted in different subsets of our AA patients. Jian et al. have shown thatKAL1gene expression is decreased in early stage and increased in later stages of cancers [39]. Their screening of colon, lung and ovarian cancer cDNA panels indicated significant decrease inKAL1expression in comparison to matching noncancerous tissues. This expression increased with the progres-Figure 1. Schematic representation of the chromosome
20q13.0-13.3 and break apart amplified DNA includes genes located in this chromosomal region in sporadic African American colorectal cancer patients.
sion of cancer from earlier (I and II) to later (III and IV) stages of the cancer. These findings might reflect that the chromosomal aberrations observed in our set of samples are stage-specific. Among autosomal genes, DCC (Deleted in Colon Cancer) was deleted in 50% of the cases, unlike in Caucasians where it was more frequently amplified than deleted. Its status in AAs is more in line with its known function as a TSG and loss during colon oncogenic transformation [40]. Two contiguous genes on chro-mosome 3,THRBandRAF1are primarily amplified in AAs while the same genes were deleted in Caucasians. THRB gene was shown to act as an oncogene in thyroid carcinomas [41], but not much is known about its possible role in colon cancer.RAF1 is known to be involved in many cancers (melanoma, gastric and prostate) through gene rearrangements along with other genes of the RAF family [42]. Three genes on chromosome 20 (TPD521.2, TOP1 and TNFRSF6B) showed a much higher frequency of amplification in AAs than in Caucasians. Not much is known
about TPD521.2. TOP1 higher expression was shown to be associated with breast cancer, where it is a predictor of poor prognosis [43], but its role in colon cancer has not been established Antibody neutralization ofTNFRSF6Bin hepatocellular carcino-ma cell lines inhibited proliferation and induced apoptosis [44]. This finding agrees with the higher amplification frequency of this gene in our cohort.
When we compared our data to another gene list established by Sjo¨blom et al. [21], we discovered that most of these genes were also altered in our population (Table 6), with 10 gene being predominantly deleted and 19 preferentially amplified.TP53was equally amplified and deleted in our set of samples (in 10 out of 30). It is well known that p53 (TP53) is a tumor suppressor gene [45] which fits more for its deletion profile rather than its amplification. SMAD2 and SMAD4 were the most frequently deleted genes in this cohort (in 16 out of 30). We have previously reported a different result in our aCGH analysis of 15 AA colon Figure 2. A schematic cladogram from a parsimony phylogenetic analysis of the aCGH data from the 30 CRC tumors.NC: No Changes, C: Changes, N: number of samples in cluster-The other digit within the clusters correspond to node numbers.
tumors [20]. However with more samples (n = 30) and improved analysis software (Genomic Workbench 6.5), our present findings are more in line with the known TSG status in many cancers [46]. Neurofibromin (NF1) that is also lost in many samples of our cohort is known to act a TSG in colon by turning the active form of Ras into an inactive form [47]. FBXW7, a component of the SCF (Skp1/Cullin/F-box protein) E3 ubiquitin ligase complex, acts as a tumor suppressor in several tissues and targets multiple transcriptional activators and proto-oncogenes for ubiquitin-mediated degradation. The geneFBXW7, which is deleted in many of our samples, influences murine intestinal homeostasis and cancer, targeting Notch, Jun, and DEK for degradation [48].
Regarding the amplified genes, CD248 (TEM-1) amplification in 11 samples might be justified by its established role in tumor angiogenesis [49]. While EPHB6 is amplified in our cohort, its function is known to be a metastasis suppressor in non-small cell lung cancer [50], suggesting that it has a different function in colon tissue that needs to be characterized further. Another surprising discrepancy is thatMMP2was amplified in our AA CRC tissues, while the use of MMP1/2 inhibitors has been shown to promote cell invasion of CRC cell lines in vitro [51].GNASwas shown to be activated through amplification primarily in ovarian cancer [52] as well as through activating mutations in colorectal cancer [53]. Our data here confirm that GNAS activation through amplification occurs in colon as well. GNAS was shown to act through the activation of Wnt and ERK1/2 MAPK pathways as was shown in Apc(Min/+) mice [53].LMO7, also amplified in our samples, was shown to mediate cell-specific activation of Rho-MRTF_SRF pathway, where it plays an important role in breast cancer cells
Table 6.Comparison of AA data with CAN genes’ list from Sjoblom et al.
African Americans (n = 30)
Gene Chromosome Amplified (%) Deleted (%)
ABCA1 9q31.1 1(3) 1(3)
ACSL5 10q25 1(3) 5(16)
ADAM29 4q34 0(0) 8(26)
ADAMTS15 11q25 3(10) 3(10)
ADAMTS18 16q23 11(36) 1(3)
ADAMTSL3 15q25.2 1(3) 6(20)
APC 5q22 2(6) 8(26)
C10orf137 10q26.1 1(3) 4(13)
C15orf2 15q11 0(0) 7(23)
CD109 6q13 8(26) 1(3)
CD248 11q13 11(36) 3(10)
CD46(MCP) 1q32 4(13) 3(10)
CHL1 3p26.1 2(6) 1(3)
CNTN4 3p26 4(13) 1(3)
CSMD3 8q23.3 14(46) 2(6)
EPHA3 3p11.2 3(10) 1(3)
EPHB6 7q34 18(60) 0(0)
ERCC6 10q11.2 3(10) 2(6)
ERGIC3(SBDCAG84) 20q12 20(66) 0(0)
EVL 14q32.2 4(13) 5(16)
EXOC4(SEC8L1) 7q31 18(60) 0(0)
EYA4 6q23 4(13) 2(6)
FBXW7 4q31.3 0(0) 8(26)
GALNS 16q24.3 14(46) 1(3)
GNAS 20q13.3 19(63) 0(0)
GUCY1A2 11q22 3(10) 6(20)
HAPLN1 5q14.3 1(3) 9(30)
HIST1H1B 6p22 11(36) 0(0)
KCNQ5 6q14 9(30) 1(3)
KIAA1409 14q32.1 5(16) 2(6)
KRAS 12p12.1 8(26) 1(3)
KRT73(K6IRS3) 12q13.3 11(36) 0(0)
LGR6 1q32.1 4(13) 3(10)
LMO7 13q22.2 17(56) 1(3)
LRP2 2q31 6(20) 2(6)
MAP2 2q34-35 6(20) 2(6)
ACTL9 19p13.2
MKRN3 15q11 0(0) 5(16)
MLL3 7q36.1 16(53) 0(0)
MMP2 16q12-13 15(50) 1(3)
NF1 17q11.2 12 (40) 8(26)
OBSCN 1q42.1 4(13) 3(10)
P2RX7 12q24 8(26) 1(3)
P2RY14 3q25 6(20) 1(3)
PHIP 6q14 8(26) 1(3)
PKHD1 6p12.2 5(16) 1(3)
PKNOX1 21q22.3 7(23) 7(23)
Table 6.Cont.
African Americans (n = 30)
Gene Chromosome Amplified (%) Deleted (%)
PRKD1 14q11 2(6) 6(20)
PTPRD 9p23-24 1(3) 1(3)
PTPRU 1p35 6(20) 6(20)
RET 10q11.2 0 2(6)
RUNX1T1 8q22 14 (46) 2(6)
SCN3B 11q23.3 3(10) 3(10)
SFRS6 20q13.1 19(63) 0
SLC29A1 6p21 11(36) 2(6)
SLC44A4(C6orf29) 6p21.3 11(36) 2(6)
SMAD2 18q21.1 0 16 (53)
SMAD3 15q22.3 1(3) 6(20)
SMAD4 18q21.1 0 16 (53)
SYNE1 6q25 4(13) 2(6)
TBX22 Xq21.1 12 (40) 4(13)
TCF7L2 10q25.3 1(3) 5(16)
TGFBR2 3p22 4(13) 1(3)
TP53 17p13.1 10 (33) 10 (33)
TTLL3 3p25.3 5(16) 2(6)
UHRF2 9p24.1 1(3) 1(3)
UQCRC2 16p12 10 (33) 1(3)
ZNF442 19p13.2 12 (40) 7(23)
migration [54]. While the above discussion centered on genes already known to be oncogenes or TSGs based on prior studies, most of the aberrations that were recorded by CGH affect genes without an annotated role in cancer. We used the occurrence of these unannotated aberrations in a phylogenetic clustering analysis of the tumors based on all recorded aberrations to see how these tumors might relate to one another and whether any clinical, pathological or molecular parameter might drive the nature of the chromosomal aberrations within a given tumor. These analyses revealed that gender, age and tumor location do not have an impact on the nature of the chromosomal aberrations. The expectation would be that poorly differentiated tumors would have had more time to accumulate more chromosomal aberrations in chromosomes of genes involved in cell differentiation character-istics. The most striking finding from our parsimony analysis was the clustering of 80% MSI-H tumors in the generated cladogram, separated from MSI-L and MSS tumors. The only MSI-H CRC that was an exception to this rule had a higher number of aberrations (63 aberrations) and as such should not be primarily defined as an MSI = H tumor but rather as a CIN tumor. The other MSI-H tumors had fewer aberrations (less than 15) than MSI-L and MSS tumors. The parsimony phylogeneticy analysis
implies that this difference is not only quantitative, but also qualitative. This is in agreements with the results of Trautmann et al. (2006) regarding the difference in number and nature of chromosomal alterations between MSI and MSS tumors [18]. CGH array data are very informative. However, because many of the chromosomal aberrations span large genomic areas and affect many genes at once, it is difficult at the present time to assign weight and value to genes within a given aberration. To distinguish between driver genes and passenger genes within an aberration, one would need to complement CGH experiments with expression analysis to establish markers’ whose differential expression associates with the oncogenic transformation. Such an integrative approach along with the inclusion of samples from non AA patients would allow the distinction between driver and passenger genes and would allow the identification of race specific aberrations, if any, in the colon oncogenic transformation [55].
Author Contributions
Conceived and designed the experiments: HB HA MAA MC HR. Performed the experiments: AG HB. Analyzed the data: AAS. Contributed reagents/materials/analysis tools: EL HN. Wrote the paper: HB HA.
References
1. Jemal A, Siegel R, Ward E, Murray T, Xu J, et al. (2007) Cancer statistics, 2007. CA Cancer J Clin 57: 43–66.
2. Fearon ER, Vogelstein B (1990) A genetic model for colorectal tumorigenesis. Cell 61: 759–767.
3. Markowitz S (2000) DNA repair defects inactivate tumor suppressor genes and induce hereditary and sporadic colon cancers. J Clin Oncol 18: 75S–80S. 4. Lengauer C, Kinzler KW, Vogelstein B (1998) Genetic instabilities in human
cancers. Nature 396: 643–649.
5. Wang Z, Cummins JM, Shen D, Cahill DP, Jallepalli PV, et al. (2004) Three classes of genes mutated in colorectal cancers with chromosomal instability. Cancer Res 64: 2998–3001.
6. Boland CR, Goel A (2010) Microsatellite instability in colorectal cancer. Gastroenterology 138: 2073–2087 e2073.
7. Ried T, Knutzen R, Steinbeck R, Blegen H, Schrock E, et al. (1996) Comparative genomic hybridization reveals a specific pattern of chromosomal gains and losses during the genesis of colorectal tumors. Genes Chromosomes Cancer 15: 234–245.
8. Bomme L, Bardi G, Pandis N, Fenger C, Kronborg O, et al. (1994) Clonal karyotypic abnormalities in colorectal adenomas: clues to the early genetic events in the adenoma-carcinoma sequence. Genes Chromosomes Cancer 10: 190–196.
9. He QJ, Zeng WF, Sham JS, Xie D, Yang XW, et al. (2003) Recurrent genetic alterations in 26 colorectal carcinomas and 21 adenomas from Chinese patients. Cancer Genet Cytogenet 144: 112–118.
10. Bardi G, Sukhikh T, Pandis N, Fenger C, Kronborg O, et al. (1995) Karyotypic characterization of colorectal adenocarcinomas. Genes Chromosomes Cancer 12: 97–109.
11. Tsafrir D, Bacolod M, Selvanayagam Z, Tsafrir I, Shia J, et al. (2006) Relationship of gene expression and chromosomal abnormalities in colorectal cancer. Cancer Res 66: 2129–2137.
12. Muleris M, Dutrillaux AM, Olschwang S, Salmon RJ, Dutrillaux B (1995) Predominance of normal karyotype in colorectal tumors from hereditary non-polyposis colorectal cancer patients. Genes Chromosomes Cancer 14: 223–226. 13. Camps J, Armengol G, del Rey J, Lozano JJ, Vauhkonen H, et al. (2006) Genome-wide differences between microsatellite stable and unstable colorectal tumors. Carcinogenesis 27: 419–428.
14. Aaltonen LA, Peltomaki P, Leach FS, Sistonen P, Pylkkanen L, et al. (1993) Clues to the pathogenesis of familial colorectal cancer. Science 260: 812–816. 15. Ionov Y, Peinado MA, Malkhosyan S, Shibata D, Perucho M (1993) Ubiquitous
somatic mutations in simple repeated sequences reveal a new mechanism for colonic carcinogenesis. Nature 363: 558–561.
16. Goel A, Arnold CN, Niedzwiecki D, Chang DK, Ricciardiello L, et al. (2003) Characterization of sporadic colon cancer by patterns of genomic instability. Cancer Res 63: 1608–1614.
17. Tang R, Changchien CR, Wu MC, Fan CW, Liu KW, et al. (2004) Colorectal cancer without high microsatellite instability and chromosomal instability – an alternative genetic pathway to human colorectal cancer. Carcinogenesis 25: 841–846.
18. Trautmann K, Terdiman JP, French AJ, Roydasgupta R, Sein N, et al. (2006) Chromosomal instability in microsatellite-unstable and stable colon cancer. Clin Cancer Res 12: 6379–6385.
19. Lassmann S, Weis R, Makowiec F, Roth J, Danciu M, et al. (2007) Array CGH identifies distinct DNA copy number profiles of oncogenes and tumor suppressor genes in chromosomal- and microsatellite-unstable sporadic colorectal carcino-mas. J Mol Med 85: 289–300.
20. Ashktorab H, Schaffer AA, Daremipouran M, Smoot DT, Lee E, et al. (2010) Distinct genetic alterations in colorectal cancer. PLoS One 5: e8879. 21. Sjoblom T, Jones S, Wood LD, Parsons DW, Lin J, et al. (2006) The consensus
coding sequences of human breast and colorectal cancers. Science 314: 268–274. 22. Ashktorab H, Smoot DT, Carethers JM, Rahmanian M, Kittles R, et al. (2003) High incidence of microsatellite instability in colorectal cancer from African Americans. Clin Cancer Res 9: 1112–1117.
23. Ashktorab H, Smoot DT, Farzanmehr H, Fidelia-Lambert M, Momen B, et al. (2005) Clinicopathological features and microsatellite instability (MSI) in colorectal cancers from African Americans. Int J Cancer 116: 914–919. 24. Brim H, Mokarram P, Naghibalhossaini F, Saberi-Firoozi M, Al-Mandhari M,
et al. (2008) Impact of BRAF, MLH1 on the incidence of microsatellite instability high colorectal cancer in populations based study. Mol Cancer 7: 68. 25. Felsenstein J (1989) Mathematics vs. Evolution: Mathematical Evolutionary
Theory. Science 246: 941–942.
26. Kibreab A, Dowlati E, Nouraie M, Brim H, Lee E, et al. (2009) Colorectal neoplasia in young African Americans, Could race be a risk factor? A 40 years experience in an inner city teaching hospital. Gastereoentrology 136–A337. 27. Kelly KM, Dickinson SL, Degraffinreid CR, Tatum CM, Paskett ED. (2007)
Colorectal cancer screening in 3 racial groups. Am J Health Behav 31: 502–513. 28. Carethers JM (2011) One Colon Lumen but Two Organs. Gastroenterology. 29. Hitchins MP, Lin VA, Buckle A, Cheong K, Halani N, et al. (2007) Epigenetic
inactivation of a cluster of genes flanking MLH1 in microsatellite-unstable colorectal cancer. Cancer Res 67: 9107–9116.
30. Thean LF, Loi C, Ho KS, Koh PK, Eu KW, et al. (2010) Genome-wide scan identifies a copy number variable region at 3q26 that regulates PPM1L in APC mutation-negative familial colorectal cancer patients. Genes Chromosomes Cancer 49: 99–106.
31. Arnold CN, Goel A, Niedzwiecki D, Dowell JM, Wasserman L, et al. (2004) APC promoter hypermethylation contributes to the loss of APC expression in colorectal cancers with allelic loss on 5q. Cancer Biol Ther 3: 960–964. 32. Will O, Carvajal-Carmona LG, Gorman P, Howarth KM, Jones AM, et al.
(2007) Homozygous PMS2 deletion causes a severe colorectal cancer and multiple adenoma phenotype without extraintestinal cancer. Gastroenterology 132: 527–530.
33. Kratz CP, Emerling BM, Bonifas J, Wang W, Green ED, et al. (2002) Genomic structure of the PIK3CG gene on chromosome band 7q22 and evaluation as a candidate myeloid tumor suppressor. Blood 99: 372–374.
34. Hutter CM, Slattery ML, Duggan DJ, Muehling J, Curtin K, et al. (2010) Characterization of the association between 8q24 and colon cancer: gene-environment exploration and meta-analysis. BMC Cancer 10: 670.
35. Unotoro J, Kamiyama H, Ishido Y, Yaginuma Y, Kasamaki S, et al. (2006) Analysis of the relationship between sex and chromosomal aberrations in colorectal cancer by comparative genomic hybridization. J Int Med Res 34: 397–405.
37. Chura JC, Ryu HS, Simard M, Poirier D, Tremblay Y, et al. (2009) Steroid-converting enzymes in human ovarian carcinomas. Mol Cell Endocrinol 301: 51–58.
38. Salhab M, Jiang WG, Newbold RF, Mokbel K (2008) The expression of gene transcripts of telomere-associated genes in human breast cancer: correlation with clinico-pathological parameters and clinical outcome. Breast Cancer Res Treat 109: 35–46.
39. Jian B, Nagineni CN, Meleth S, Grizzle W, Bland K, et al. (2009) Anosmin-1 involved in neuronal cell migration is hypoxia inducible and cancer regulated. Cell Cycle 8: 3770–3776.
40. Shin SK, Nagasaka T, Jung BH, Matsubara N, Kim WH, et al. (2007) Epigenetic and genetic alterations in Netrin-1 receptors UNC5C and DCC in human colon cancer. Gastroenterology 133: 1849–1857.
41. Lu C, Mishra A, Zhu YJ, Meltzer P, Cheng SY (2011) Genomic profiling of genes contributing to metastasis in a mouse model of thyroid follicular carcinoma. Am J Cancer Res 1: 1–13.
42. Palanisamy N, Ateeq B, Kalyana-Sundaram S, Pflueger D, Ramnarayanan K, et al. (2010) Rearrangements of the RAF kinase pathway in prostate cancer, gastric cancer and melanoma. Nat Med 16: 793–798.
43. Zhao C, Yasui K, Lee CJ, Kurioka H, Hosokawa Y, et al. (2003) Elevated expression levels of NCOA3, TOP1, and TFAP2C in breast tumors as predictors of poor prognosis. Cancer 98: 18–23.
44. Chen G, Rong M, Luo D (2010) TNFRSF6B neutralization antibody inhibits proliferation and induces apoptosis in hepatocellular carcinoma cell. Pathol Res Pract 206: 631–641.
45. Copelli SB, Mazzeo C, Gimenez A, Casco C, Meiss R, et al. (2001) Molecular analysis of p53 tumor-suppressor gene and microsatellites in preneoplastic and neoplastic lesions of the colon and esophagus. Oncol Rep 8: 923–929. 46. Maliekal TT, Antony ML, Nair A, Paulmurugan R, Karunagaran D (2003) Loss
of expression, and mutations of Smad 2 and Smad 4 in human cervical cancer. Oncogene 22: 4889–4897.
47. Cacev T, Radosevic S, Spaventi R, Pavelic K, Kapitanovic S (2005) NF1 gene loss of heterozygosity and expression analysis in sporadic colon cancer. Gut 54: 1129–1135.
48. Babaei-Jadidi R, Li N, Saadeddin A, Spencer-Dene B, Jandke A, et al. (2011) FBXW7 influences murine intestinal homeostasis and cancer, targeting Notch, Jun, and DEK for degradation. J Exp Med 208: 295–312.
49. Rmali KA, Puntis MC, Jiang WG (2005) Prognostic values of tumor endothelial markers in patients with colorectal cancer. World J Gastroenterol 11: 1283– 1286.
50. Yu J, Bulk E, Ji P, Hascher A, Tang M, et al. (2010) The EPHB6 receptor tyrosine kinase is a metastasis suppressor that is frequently silenced by promoter DNA hypermethylation in non-small cell lung cancer. Clin Cancer Res 16: 2275–2283.
51. Wong JC, Chan SK, Schaeffer DF, Sagaert X, Lim HJ, et al. (2011) Absence of MMP2 Expression Correlates with Poor Clinical Outcomes in Rectal Cancer, and Is Distinct from MMP1-Related Outcomes in Colon Cancer. Clin Cancer Res 17: 4167–4176.
52. Tominaga E, Tsuda H, Arao T, Nishimura S, Takano M, et al. (2010) Amplification of GNAS may be an independent, qualitative, and reproducible biomarker to predict progression-free survival in epithelial ovarian cancer. Gynecol Oncol 118: 160–166.
53. Wilson CH, McIntyre RE, Arends MJ, Adams DJ (2010) The activating mutation R201C in GNAS promotes intestinal tumourigenesis in Apc(Min/+) mice through activation of Wnt and ERK1/2 MAPK pathways. Oncogene 29: 4567–4575.
54. Hu Q, Guo C, Li Y, Aronow BJ, Zhang J (2011) LMO7 Mediates Cell-Specific Activation of Rho-MRTF-SRF Pathway and Plays an Important Role in Breast Cancer Cell Migration. Mol Cell Biol.