Work in the European Union in
2030
Policy Recommendations for an Automated Future
por
Felisberto Sequeira Pereira
Católica Porto Business School Março de 2019
Work in the European Union in
2030
Policy Recommendations for an Automated Future
Trabalho Final na modalidade de Dissertação apresentado à Universidade Católica Portuguesa
para obtenção do grau de mestre em Gestão
por
Felisberto Sequeira Pereira
sob orientação de
Prof. Doutor Gonçalo Nuno Falcão de Bettencourt Coutinho Marcelo
Católica Porto Business School Março de 2019
Acknowledgements
Firstly, I would very much like to thank my supervisor, Professor Gonçalo Marcelo, for the continuous support, patience, motivation, enthusiasm, and immense knowledge. His guidance and promptitude were essential so I could find my path, overcome the challenges that have arisen during this master’s thesis and, more importantly, further develop my knowledge. It was an utter pleasure working with him.
My second acknowledgement must go to my whole family, but more particularly, to my parents Felisberto Pereira and Vitória Pereira, my sister Rita Pereira, my second parents António Jesus and Amélia Pereira, and also the younger ones, João Pedro, Filipa and Inês. Their support and encouragement were fundamental during all this time.
Besides, I would like to thank to Professor Nuno Borges Carvalho my PhD supervisor, for giving me the chance to reconcile my PhD in Electronic Engineering with this master’s. In the same way, I want to acknowledge my friend and colleague Ricardo Correia for helping me in this process.
To Católica Porto Business School for giving me the chance to complete this master’s, and to all the Professors who throughout these years have shared their knowledge and thus helped me developing the tools that will aid me in my future.
Last but not least, to my friends, thank you for making this journey an unforgettable adventure. It would not be possible without the joy and brotherhood we share.
Resumo
O trabalho é uma atividade humana fundamental cuja distribuição está constantemente a mudar. Foi sempre assim no passado, e de forma mais intensa desde as primeiras revoluções industriais. Hoje, com a quarta revolução industrial e o ritmo da inovação tecnológica, testemunhamos uma reformulação radical da forma como o trabalho será distribuído. Neste contexto, o objetivo principal desta tese é investigar qual vai ser a estrutura do emprego na União Europeia em 2030 e, quais as medidas que devem ser implementadas para preparar esta transição. A tese mostra que nos próximos 10 anos, 15% a 25% dos empregos que hoje existem vão ser perdidos para a automação, sendo que, apenas num cenário otimista existe a hipótese de que os novos empregos consigam na totalidade compensar esta perda. Fica também demonstrado que em 2030 a União Europeia terá uma população mais envelhecida e mais dependente da classe trabalhadora do que aquilo que tem hoje. Por outro lado, o nível de educação na União Europeia é um dos melhores do mundo, o que pode ser crucial, uma vez que todos os indicadores apontam os empregos com mais qualificações como os mais necessários no futuro, sendo este um fator importante para entender quão preparados estamos para enfrentar as mudanças que terão lugar até 2030. Tendo em conta todos estes aspetos, esta tese propõe um conjunto de políticas públicas e de políticas de gestão. São necessárias políticas públicas de modo a garantir que as condições de vida da população melhorem em vez de se degradar. Em termos de políticas publicas, são abordadas medidas que dizem respeito à educação, proteção social, criação de emprego e impostos, tais como a aprendizagem ao longo da vida, o Rendimento Básico Incondicional ou um imposto negativo sobre o rendimento. No que toca às políticas de gestão, a tese argumenta que são precisas medidas que visem a gestão de talento, outsourcing e investimento, para que as empresas possam ser competitivas neste novo contexto. Flexibilização do trabalho, ligação a universidades e estratégias para investimento em automação são algumas das medidas abordadas.
Palavras Chave: Automação; Emprego; Políticas Públicas e Políticas de Gestão; População; Redistribuição do Trabalho.
Abstract
Work is a fundamental human activity which constantly undergoes change in terms of how it is distributed. This was always the case in the past, and with a growing intensity ever since the first industrial revolutions. Today, with the fourth industrial revolution and the pace of technological breakthroughs, we are witnessing a radical reshaping of the way in which work will be distributed. In this context, this thesis’ main aim is to investigate what will be the employment structure in the European Union by 2030, and what measures need to be adopted to prepare this transition. This study shows that in the next 10 years automation will replace between 15% to 25% of existing jobs, and even though some new jobs may appear, only in an optimistic scenario will the number of new be equivalent to the number of jobs lost. It also shows that EU’s population is going to be older and the number of people dependent on the labor force is going to increase. On the other hand, the education level in the European Union is one of the best in the world, which can help in the context of an employment structure that will privilege highly qualified jobs. This is important to understand how prepared we are to face the changes that will be in place by 2030. Bearing in mind all this information, this thesis proposes public and managerial policies. Public policies are needed to ensure that changes leave people better off, not worse. These measures cover education, social protection, job creation and taxation. Lifelong learning, Universal Basic Income and Negative Income Tax are some examples of measures that the thesis assesses. On the side of managerial policies, the thesis contends that measures in the areas of talent management, outsourcing and investment are needed, so that companies can stay competitive in this new landscape. More specifically, we address proposals in the domains of work flexibilization, connection to tertiary schools and strategies to invest in automation.
Keywords: Automation; Employment; Population; Public and managerial policies; Work redistribution.
Index
Acknowledgements ... v
Resumo ... vii
Abstract ... x
List of Figures ... xvi
List of Tables ... xx
List of Abbreviations ... xxii
Introduction ... 24
Chapter 1 ... 29
Methodology ... 29
Chapter 2 ... 32
Literature Review ... 32
2.1 Work and Labor ... 32
2.2 Industrial Revolutions in work distribution ... 33
2.3 Demographics ... 40 2.3.1 Population ... 40 2.3.2 Age Groups ... 44 2.3.3 Labor force ... 51 2.3.4 Education ... 55 2.3.5 Employment ... 61
2.4 The future of jobs... 65
2.5 The case of Portugal... 77
Chapter 3 ... 87
Results and discussion ... 87
3.1 The future of jobs by 2030 ... 87
3.1.2 Scenario 2 – Jobs shortage ... 94
3.2 Public Policies... 96
3.2.1 Education ... 96
3.2.1.1 Lifelong learning ... 96
3.2.1.2 Mandatory training for employees ... 97
3.2.1.3 Incentivize advanced education of the youth ... 98
3.2.2 Social Protection ... 98
3.2.2.1 Unified unemployment scheme ... 99
3.2.2.2 Universal Basic Income or Negative Income Tax ... 100
3.2.3 Job Creation... 102 3.2.3.2 Incentivize entrepreneurship ... 103 3.2.3.3 Exportation ... 103 3.2.4 Taxation... 104 3.2.4.1 Capital taxation... 104 3.3 Managerial Policies ... 105 3.3.1 Talent Management ... 106 3.3.1.1 Constant training ... 106 3.3.1.2 Work flexibilization ... 107 3.3.1.3 Location ... 108 3.3.1.4 Tertiary schools ... 108 3.3.2 Outsourcing ... 108 3.3.3 Investment ... 109
3.3.3.1 Short periods of amortizations ... 109
3.3.3.2 Investments in higher production efficiency ... 109
3.3.3.3 Human resources ... 109
3.3.3.4 New opportunities ... 110
3.4 The Case of Portugal ... 111
Conclusion ... 114
What will be the employment structure in the European Union by 2030? .... 114
What measures need to be adopted to prepare this transition? ... 115
List of Figures
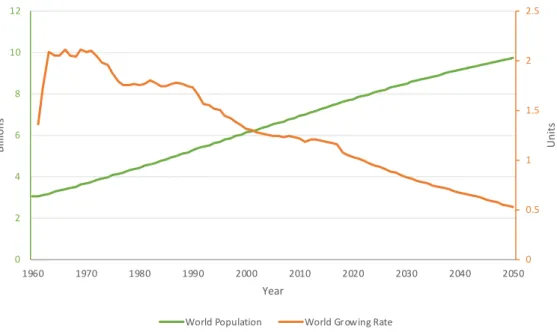
Figure 1 – World population and growing rate. ... 41
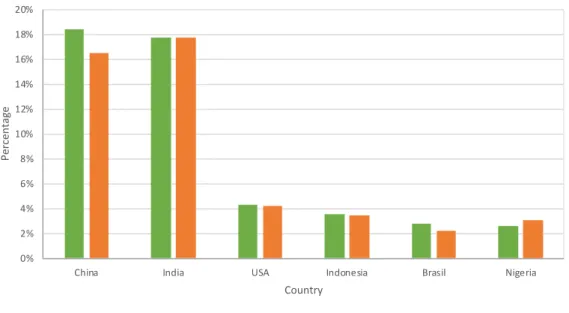
Figure 2 – World’s most populated countries in 2017 and 2030... 42
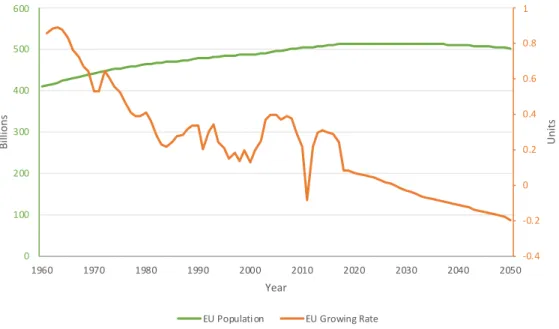
Figure 3 – EU Population and its Growing Rate. ... 43
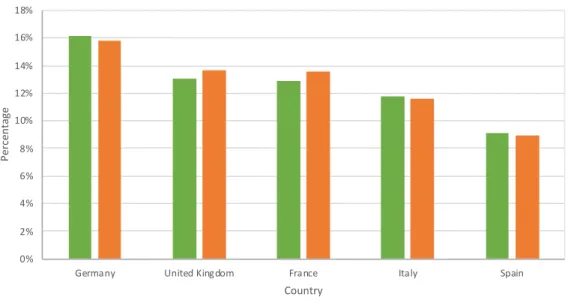
Figure 4 – EU’s most populated countries in 2017 and 2030 ... 44
Figure 5 – World Age group distribution – total population. ... 45
Figure 6 – World Age group distribution – percentage of total population. ... 46
Figure 7 – EU’s Age group distribution – total population. ... 47
Figure 8 – EU’s Age group distribution – percentage of total population. ... 47
Figure 9 – Highest/Lowest fertility rates, global and EU perspective ... 50
Figure 10 – Fertility rate, number of births per woman. ... 50
Figure 11 – Percentage of population in labor force. ... 52
Figure 12 – Indicators with impact in the labor force. ... 53
Figure 13 – Indicators with impact in EU’s labor force ... 54
Figure 14 – Labor force dependency ratio ... 55
Figure 15 – Primary school enrollment ratio ... 56
Figure 16 – Secondary school enrollment ratio ... 57
Figure 18 – World mean years of schooling 2020 ... 59
Figure 19 – World mean years of schooling 2030 ... 59
Figure 20 – EU’s mean years of schooling in 2020 ... 60
Figure 21 – EU’s mean years of schooling in 2030 ... 60
Figure 22 – EU Students enrolled in tertiary education by field of education in 2016 ... 61
Figure 23 – Employment rate ... 62
Figure 24 – Employment distribution by sector ... 63
Figure 25 – EU employment distribution by sector ... 64
Figure 26 – Percentage of all people employed in the non-financial business in EU by 2015 ... 65
Figure 27 – Potential and adoption of automation ... 67
Figure 28 – Potential of automation, currently demonstrated technology ... 69
Figure 29 – Change in the task indices in the EU, 2015 to 2030 ... 70
Figure 30 – Technical potential for automation across sectors varies depending on mix of activity types. ... 72
Figure 31 – Automation-driven labor productivity growth, 2015 vs. 2030 ... 73
Figure 32 – Employment change (% per year) by job-wage quintile, 2015-2030 EU by qualification. ... 75
Figure 33 – Employment change (% per year) by job-wage quintile, 2015-2030 .... 76
Figure 35 – Portugal’s age group distribution. ... 78
Figure 36 – Portugal’s labor force. ... 80
Figure 37 – Portugal’s indicators with impact in the labor force. ... 81
Figure 38 – Portugal’s school enrollment. ... 82
Figure 39 – Portugal students enrolled in tertiary education by field of education in 2018... 83
Figure 40 – Portugal’s employment rate ... 84
Figure 41 – Portugal’s employment by area in 2016 ... 84
Figure 42 – Portugal’s job losses due to automation adoption, intermediate scenario by 2030 ... 85
Figure 43 – Portugal employment change (2016 - 2030) ... 86
List of Tables
Table 1 – Life Expectancy at Birth. ... 48 Table 2 – Portugal and EU life expectancy at birth ... 79
List of Abbreviations
AI Artificial Intelligence
EMU Economic and Monetary Union
EU European Union
EUBS European Unemployment Benefit Scheme
Eurostat European Statistical Office
GDP Gross Domestic Product
ICT Information and Communication Technologies
IoT Internet of Things
IT Information Technology
NIT Negative Income Tax
Introduction
This thesis revolves around the topic of the future of work. More specifically, it tries to anticipate how work will be distributed in 2030 and how this distribution can impact society not only in terms of the job structure but also concerning other social consequences. In the last decades, technological development has brought many innovations that have been changing the way we work, and also the kind of work that we do. However, the next wave of innovation, also known as the fourth industrial revolution, is bringing ideas and technologies even more disruptive, and the pace of this change has been accelerating.
The impact of the fourth industrial revolution is one of the topics that is now being studied by multiple academics (Ford, 2015) and consulting companies (McKinsey Global Institute, 2017a). Many of them share the idea that we are at the starting point of a turning point in the way work is done, and that will consequently influence the kind of jobs we will have in the near future. Therefore, the topic of this thesis could hardly be more timely, and this is one of the main motivations that led us to conduct our research on it. As will be seen throughout the thesis, to anticipate these coming changes is of the utmost importance in order to prepare companies and governments to adopt the right measures.
Moreover, besides the relevance and timeliness of this complex phenomenon, another reason why I decided to address this topic lies in my academic and professional background. I am an electronic engineer pursuing my PhD degree, in the context of which I am researching for new ways to deploy sensors in the most varied environments. In this way, I am working directly with many things that can have a big impact in the way we live today and in the near future. This thesis allowed me to a understand in a broader way how technology can impact society and what can be done to ensure that technology is a tool to improve living conditions and not a threat to the peaceful development of humankind. It provided me with a clearer vision of
the big picture in terms of the future of work for the coming decade and gave me some insights of its consequences.
The topic is thus of the utmost importance for the future of management. But, insofar as this process is so wide-ranging, it also raises several ethical, social, and even philosophical issues, pertaining to the nature of work itself and to the way in which we want to collectively organize ourselves in order to live better. This plurality of different ways of looking at this topic is a constitutive part of this thesis.
These predictions are based in the potential of technologies already in use, but also in technologies that are expected to emerge in the future. Internet of Things (IoT), 3D printing, mobile internet, artificial intelligence (AI) are some examples that are enabling this new wave of innovation that aims to take automation to the next level. In this context, automation should be seen not only as autonomous machinery. Rather, through machine learning and other developments of AI, it might alter the tasks traditionally attributed to humans so as to free us. For instance, if AI software is able to free oneself from answering e-mails, this can also be considered automation.
Automation can be responsible for a significant loss of existing jobs, and some new jobs may also appear. This process of work transformation is not something completely new for humankind, given that structural changes in jobs are an intrinsic part of human history, especially since the first industrial revolution. The way in which societies adapted to past modifications in jobs is explored in higher detail below, in Chapter 2 Literature Review.
However, the fourth industrial revolution has some intrinsic characteristics that are unprecedented. Not only do both information flows and goods travel faster; also, the unprecedented pace of innovations that we have been experiencing in the last years and the increasing pervasiveness of AI and machine learning show us the extent to which these changes might be much more profound than ever before. At the same time, this transition will happen fast. Times of transition have been always difficult for some people, and this time we are having less time to adapt than we had before.
The urgency of this subject is clear when some authors estimate that up to 30% of the jobs existent today can be eradicated within 10 years.
This overarching topic led us, in this thesis, to look at several different aspects. One obvious example is demographics. To understand future changes in the employment structure, one has to start looking at the characteristics of a given population: to assess whether the population is growing, getting older, or more or less literate are all factors that are going to impact its degree of adaptability to the new paradigm. Besides that, it is also important to try to understand who are the individuals with higher potential of risk in this transition.
However, in order to tackle this important topic in a way that could be manageable, we had, like one has to do in every research, make some options. It would be impossible to look into this topic without delimiting a certain geographic space and a specific timeline (2030). That space would have to be large enough to be a reference but also contain a certain degree of homogeneity in order to establish meaningful parallelisms when adopting a comparative perspective. Also, enough data about its population should be available. Taking that into account, we decided to tackle this question within the specific framework of the European Union (EU). Due to the fact of being the country from which this thesis originates, the case of Portugal was also explored, even though to a lesser detail. More information about these choices can be found in Chapter 1 Methodology. Given these options, the main research question which this thesis addresses is the following: What will be the employment structure in the European Union by 2030, and what measures need to be adopted to prepare this transition?
Moreover, in order to further specify the main objectives of this thesis, the main research question is broken down in several sub-questions: Sub-Q1: How will the fourth industrial revolution impact the EU employment structure? Sub-Q2: What public policies should the EU adopt to foster job creation and social protection? Sub-Q3: How can companies adapt to become more competitive within this framework? Sub-Q4: How can the workforce be retrained to acquire the new skills needed within
this framework? Sub-Q5: What are the specific findings and recommendations for Portugal when compared with the EU?
Our thesis is structured according to three main chapters. The first, the methodology, clarifies the methods used to assess data in order to answer the research question. Besides having an extensive data base in its literature review, this work follows a qualitative approach. The data is used as a way to describe characteristics and patterns than can lead to a better understanding of the research topic.
The following chapter, the literature review, which is divided in several subchapters, provides a thorough contextualization of the subjects under scrutiny by analyzing the literature available. In that chapter we go through the differences between labor and work in order to introduce the concepts of work and work distribution (including the employment structure), the historical context of changes in work structures, the demographics and the future of jobs for EU and for Portugal. In this chapter it is possible to find an extensive research of data important to support the findings and conclusions to which we arrived with this work.
The third chapter, the results, is divided in tree distinct parts. In the first part we present the findings stemming from the literature review regarding the EU population demographics and the reality of jobs by 2030. In this section we explore EU’s aging population, its impact in the possible increase in the labor force dependency ratio and how the current state of education and employment can evolve within a 10 years range. This information was compared with the findings on the future of jobs that were based in the multiple reports analyzed in the literature review. The final output of this part is an employment structure scenario that systematizes the previous findings. In the second part of this chapter, we propose policies for private and public sectors to adopt. These measurements attempt to be solutions that ensure a smoother transition between the current and future employment structure. Regarding the private sector, the results try to propose management measurements in order to make sure that companies remain competitive in the new paradigm. For the public sector, the policy recommendations intend to be a critical reflection about which kind of measurements
can be implemented by governments in order to ensure stability to the population. Some policies try to guarantee job stability for population, but as we are going to see further, this may be impossible to accomplish. In this way, other policies that would, as it were, redefine the actual work paradigm are also put forward, such as Universal Basic Income (UBI) or a Negative Income Tax (NIT). Still within the chapter on results, there is a final subchapter analyzing the specific case of Portugal. Here we explore the main differences between Portugal and the EU taken as a whole and some particular recommendations regarding the country are also made.
Even though our means are the modest means of a masters’ thesis, we believe that this work puts forward some valuable insights on this topic. Our recommendations can be seen as the basis to a deeper and critical discussion which future research can carry on.
Chapter 1
Methodology
This thesis adopts a qualitative approach to the topic it proposes to investigate. The topic is itself complex, as it touches on the nature and definition of a fundamental human activity such as work, on the implications of the growing impact of technology on it, and on the fundamental policy and managerial decisions that need to be done in order to prepare the transition for the coming decade.
Given the complexity of the topic at hand, and also the strict time constraints of this research, it would prove impossible to devise a specific quantitative model to collect and analyze primary data. Any such endeavor would always be very limited and exploratory, and it would be impossible, from such data, to generalize our conclusions to try to answer our specific research question and the several dimensions of the sub-questions in which the main research question is divided.
Consequently, the only manageable option was to adopt a qualitative approach. In this approach, what is at stake is grasping the very complexity of the phenomena at hand to make sense of them in a broader picture. Therefore, the research question itself was born from the literature review, and the main objectives of the research, which are pursued in the results, are based in the inferences we draw from the data collected and analyzed in the literature review, and which originates from the several reports, books, scientific articles and databases that we consulted.
In this approach, we were influenced by the hermeneutical approach to social reality, which is used by our supervisor (Marcelo, 2012). This approach, which is proposed, among others, by Michael Walzer (1987) is understood to be a method of interpretation, in which social reality is not “discovered” or “invented” but rather interpreted, also taking into account the fundamental values that should guide our decisions. One of the specificities of the way we are using it comes from the fact that this interpretation is used in a prospective exercise, given that we are trying to draw
scenarios for the future in the medium term, for 2030. But the fact that we are assessing the definition of work and work distribution, and arguing for the implementation of some measures guided by ethical values, is grounded in this hermeneutical and ethical approach to social reality.
Also, using this specific method for this topic also draws on the importance of the discussion of the redistribution of work, which is argued by Gorz (1999) and was also explored in earlier theses around the same topic, such as Gomes (2017). Here, however, our main focus is on the EU, and paying very close attention to data such as demographics, automation potential of different jobs, and education. The choice of the EU for our analysis was not neutral. Even though employment strategies differ from country to country, the EU is a single market and it might be argued that in the future a closer integration between these policies is possible, also taking into account the EU’s positioning as a global player. And even though many reports, such as the ones produced by the World Economic Forum (2016) or the MckInsey Global Institute (2017) focus on the impact of automation and the fourth industrial revolution for the future of jobs, we felt the need to bring that discussion specifically for the EU and Portugal’s levels.
It should be noted that when we mention the EU, we refer to it in its current scenario: 28 member states, including the UK. This can, of course, still change from here to 2030, given the possibility of Brexit and also of an enlargement of membership to other countries. However, at the time this thesis was being finalized, Brexit is still not certain to happen and, as such, we maintained our predictions at the level of EU28. This can, of course, change at any given point in time but we adopted a conservative approach to the current status quo. If Brexit does happen or other countries join the EU, the figures for population, job market and education will of course change, but this would probably not change the main points we emphasize in the results.
Furthermore, the fact that we did not adopt a quantitative model does not mean that there is no use of quantitative data in the thesis. In fact, almost all the literature review and also a part of the results are filled with quantitative data on all the
dimensions we chose to analyze, in order to be as accurate as possible in our assessments and predictions. So that we would have a large enough time span to analyze the evolution, most of the data we use starts in 1990. When this is impossible, due to the absence of data, we use any available data that we can find. For most cases we could also only find data up until 2017, sometimes until 2018, but this does not change fundamentally the estimations being made. As for projections for the future, some of the data we use go as far as 2040 or 2050, in order to provide a sense of the evolution, even though in the results we concentrate on the timescale of roughly a decade, from the present moment to 2030. Whenever deemed useful, we chose to illustrate these data with different figures so that they would be more comprehensible. As a result, the literature review has a very descriptive nature, whereas the interpretive part is more present in the results.
The thesis uses figures from different sources. Some were taken, with due acknowledgement, from public reports, others were produced with data from different sources and a few are of our own making. This information is provided below each figure in its caption: figures referenced just with “source” originate from other documents; the ones referenced with “data source” were made by us with data from that source; those completely originally are tagged “self-elaboration”.
Chapter 2
Literature Review
2.1 Work and Labor
In a thesis dedicated to analyzing the distribution of work in the near future, it makes sense that we start by trying to understand what it is exactly that is understood by this concept, and how it can be seen from different perspectives.
Traditionally work is seen as an activity that involves the use of time and energy on a task for some future social, financial, or psychological reward. Gorz (1999, p. 3) emphasizes that work performs a “socially identified and normalized function in the production and reproduction of the social whole”. This means that the concept of work is determined by the social organization which usually means to have a job or a profession, thus reducing work to paid labor. This definition has some weaknesses especially when what is at stake is distinguishing between different activities – the line between what can, or can not, be considered “work” is sometimes blurred. The most common example is when a professional athlete is compared with an individual doing exercise, both are doing the same activity but one is working (and probably being paid) while the other is playing. Certain activities are financially rewarded and these, as well as practices taking place within a given organization structure are what is usually considered work; however, restricting work to these activities presents a problem to activities that are typical of certain social groups. Students or housewives, for instance, do not get paid or are connected to a structure, however their activities can be seen as work (Andersson, 1992).
In order to clarify the concept of work, some authors have proposed to distinguish it from labor. In the Marxist tradition labor is seen as alienated and exploited work, as
against work that is an anthropological category to the human species (Frayssé, 2014). In this tradition, labor, at least such as it exists in capitalism, is a form of work that is necessarily alienated, because the workers are forced to work in order to survive and they do not own the means of productions, thus being forced to sell their own labor regardless of the dire conditions they might have to face. It goes without saying that other forms of work exist, in which humans own the means and results of production. But, in a nutshell, in this tradition labor is an activity done for someone else in a position of subordination and done for some form of remuneration. Work is a more general concept, it is a process to transform nature, culture and society creating goods and services that satisfy the human needs (Fuchs & Sevignani, 2013; Standing, 2014).
To simplify matters, we assume that labor is thus a form of work, one that assumes the nature of paid work (thus one often speaks of “waged labor” – and here we are not considering other forms of labor, such as forced labor or other forms bordering on slavery). Throughout this thesis, we will thus use “work” as the more encompassing concept and so sometimes we can use it as meaning paid work (even in the form of a wage, as in waged labor) which means that the distinction between work and labor is not always used in a strict manner in the following pages. We proceed so because work being such a broad concept, it encompasses not only traditional employment schemes where work is associated with a career and a stable wage, but also intermittent work schemes, independent work or even unpaid activities. However, we will come back to all these important distinctions in the discussion of the results.
2.2 Industrial Revolutions in work distribution
This thesis revolves around the topic of the employment structure in European Union by 2030, and what measures need to be adopted to prepare the transition. The employment structure or work distribution as it is commonly called, is a subject that has been strongly debated over the years, and that takes its root in the social nature of work itself, and in the division of labor. However, to understand the dynamic nature
of the division of labor, it is important to take a brief glimpse at its history. This history fastens its pace ever since the dawn of the industrial revolutions, which we will analyze in more detail below. Nevertheless, the specialization in given tasks of course preceded these revolutions. Let us see how.
Roles in society have been changing ever since humankind went from hunter and gatherer to food producer. It started as a natural process to satisfy the most basic human needs: food, childcare and shelter. The different proficiency that some individuals showed in particular tasks, such as hunting animals, care skills or gathering skills created the first distribution of work. Age and sex were the main features driving work divisions. The older and the younger in each community lacked strength and so performed more sedentary tasks. The sexual division of work was also based in physical differences, with men taking on tasks such as hunting while women specialized in food gathering, child caring, and cooking (Kranzberg & Hannan, 1999). We find in Wittfogel (1957) a general theory of the development of ancient civilizations in which one of the first complex systems of work distribution unfolded. The development of irrigation projects in Mesopotamia and Egypt led to a hierarchical organization in order to control social roles. Irrigation increased food supply, fostering the creation of people agglomerates in towns and cities; this brought the emergence of weavers, metalworkers, scribes, lawyers, among other occupations. Another important aspect of social stratification in Mesopotamia was the constant strife, as it created the need for military and also, indirectly, for several other occupations, as was the case of horse breeding (Flannery, 1972). A very different example can be found in Maya civilizations, characterized by many as the classic example of a "peaceful" civilization. This aspect combined with a fertile agriculture territory resulted in a society where people developed knowledge in astronomy, medicine and engineering, which is a strong indicator of scientific roles in society (Sharer & Traxler, 2006). Besides all the influence of the surrounding environment in the first complex systems of work, the distribution of tasks was also based in age, sex and skills. However, due to the strong hierarchical organization of these societies, the social position was also a defining element in work distribution.
During many centuries work distribution was based on the same principles, the differences between societies were mainly based on the scarcity of food and on the fact that they were living times of war or peace. The abundance of food would contribute to move people from agriculture to construction, trading or cultural activities, and in times of war the numbers of militarism and metalworkers would increase. In spite of significant differences from culture to culture and throughout history, it seems possible to claim that this was the fundamental division of work in many societies and that the first major shift that really changed the framework of existence for the human species would come about with Modernity and, more specifically, with the industrial revolutions.
The first industrial revolution, which happened in the West from about 1760 to sometime between 1820 and 1840, brought fundamental changes in the way people worked, where they lived and how many people could make a living around the world (Stearns, 2018). The essence of the first industrial revolution were the applications of new sources of power to production processes, such as the motors powered by fossil fuels which replaced humans and animals as power sources.
To understand the social impact of the first industrial revolution it is important to have an overview about the period leading to it. According to Deane (1979) the pre-industrial period was characterized by four aspects: (i) poverty – as it is extremely difficult to measure poverty the author made a simple and quantitative comparison, the level of economic development reached by the countries that were the first to go through the industrial revolution was distinctly higher when compared with countries still in development. This assumption only gives useful information if we consider that in the pre-industrial ages the different countries could be considered at an equivalent economic level; (ii) stagnation – the levels of living and productivity were relatively stagnant; (iii) dependence on agriculture – even though it is impossible to estimate precisely how many people worked in agriculture, some predictions estimate that about 80% of population was working in agriculture; (iv) lack of occupational specialization – in the pre-industrial economy it was normal for a person to be engaged in a variety of occupations and even in a variety of industries.
The first industrial revolution came to drastically change the work distribution given that the manufacturing process replaced agriculture as the main activity, some estimations claiming that at its peak 60% of people were working in manufacturing. The exponential growth in raw cotton, coal and the appearance of railway lines also signaled an economy focused in production. The per capita productivity increased near 90% (Clark, 2001). Industrialization also led to the creation of new jobs, the need for new specialized work resulted in jobs as machine operator or train driver and the complexity of factoring processes resulted in management roles. Besides this work redistribution the first industrial revolution brought huge alterations in social standards, as it improved human health by dramatically reducing infant mortality; yet it worsened, in a significant proportion, the quality of the natural environment. The new tasks needed less strength from people which meant that people started working from early ages, typically at 10 years old (Stearns, 2018).
During the first industrial revolution appeared the first movement against technology, the luddites. The movement, born in England by the hands of textile workers, opposed technology because people were losing their jobs for machinery, and the protest thus involved the destruction of textile machinery. In spite of the growth in the economy, living standards only rose slowly during this period, as population grew at an accelerating rate (O’Rourke, Rahman, & Taylor, 2013). Even though there was an effort from the government authorities to suppress the movement using military force, the dispatch is usually said to have been without much efficacy. The end of luddites is mainly attributed to fast declining of popular support caused by the growing living standards at the late 19th century (Hozumi, 1956).
Since the first industrial revolution the world has experienced wars, political revolutions and rebellions that together with industrial revolutions have changed societies. The second industrial revolution also known as the technological revolution arose in the late 19th century and ended in the beginning of the 20th century. This new
period of transformation extended the success of the first industrial revolution (which was somehow limited in scope and geographic impact) to a much broader range of activities and products (Mokyr, 1998). The new paradigm was only possible due the
large number of new technologies and inventions: electricity, the internal combustion engine, new chemicals, telephones and radios are some examples of it. From all the new inventions, electricity was possibly the most important in the work organization. In the United States of America (US) before 1899, more than 95% of the mechanical power was derived from water and steam, 30 years later 75% of mechanical power was electric. This technical aspect resulted in an increase from 1.6% to 3.3% in the growth rate of output per hour in industry. The developments in chemistry allowed for the emergence of fertilizers which had a big impact in agriculture (Atkeson & Kehoe, 2001).
At the end of the second industrial revolution, in the US, 25% of the working population were operatives or laborers (except miners and farmers) and near 35% were working in agriculture. This shows a big difference when compared with periods of pre-industrial revolution, in which 80% worked in agriculture, and first industrial revolution, when 60% worked in manufacturing (Wyatt, 2006). These transformations also led to a valorization of knowledge and technical expertise, given that for the first-time employees were not selected due to their physical abilities. From a social point of view, the new roles in society and the value they created allowed for an increase in living standards and a bigger purchasing power in the middle and working classes. The status of the elderly also changed, as jobs became more associated with energy and ability to learn new techniques which consign elderly to care activities (Stearns, 2018).
Finkelstein (1989) describes with a present and futuristic perspective what is / would be the third industrial revolution. He points six major high technology change agents, and explores the ideas of engineered materials, life and drugs claiming that “engineers and entrepreneurs will have the imaginative range of expression that only poets and artists held”. The third industrial revolution, also known as the digital revolution started somewhere around the 1980s and is directly related to Information and Communication Technologies (ICT) (Greenwood, 1997). The computer and Internet were the bases of what would be a deep transformation in the way work was distributed.
The new technologies impacted all economic sectors. In 2000 agriculture represented 7.3% of employment in the European Union (EU), in 2010 it was 4.4%. Additionally, services represented 65.2% in 2000 increasing to 69.9% in 2010 (European Commission & Directorate-General for Employment, 2018). The numbers are clear, there was a wide change in the work distribution during the third industrial revolution. Regarding the skills required, in 2010 the EU pointed that 27.6% of jobs required at least a bachelor degree, which shows the high level of specialization required if compared with previous years (Luxembourg: Publications Office of the European Union, 2013). The third industrial revolution brought important advances, the purchasing power adjusted Gross Domestic Product (GDP) per capita in EU grew 28.8% in the period from 2000 to 2010 (Eurostat, 2018b) and the risk of poverty rate was at 16.5% in 2010 (Eurostat, 2018a). The digital revolution also resulted in less desirable consequences, such as inequality: in Europe at the beginning of the industrial revolution the top 1% national income represented 9.3% of the total income, whereas in 2008 it was 13.2%, which actually shows an increase in inequality. In the same period, the same share grew 41.6% if analyzed in a world perspective (Alvaredo, Chancel, Piketty, Saez, & Zucman, 2018).
Even though there is not a clear end of the third industrial revolution, it seems as if a new industrial revolution is already underway, as the fourth industrial revolution is already defined by many authors. The pace of the developments in the last years can not only change the way how the world is organized, but also challenge the idea of what it means to be human (Marr, 2018). In Hawken, Lovins, & Lovins (2013) a utopian scenario as the result of the fourth industrial revolution is presented. The work explores the possibilities that will arise from the birth of a new type of industrialism, one that according to the authors, differs in its philosophy, goals and fundamental processes from the actual industrial system. The fourth industrial revolution or industry 4.0 as it is also known, represents entirely new ways in which technology becomes embedded within societies (Davis, 2016). However, the pace at which innovations have been made is unprecedented and the visions about the key factors at stake also constantly change with this pace. One example of it is the report
“The Future of Jobs Report 2018” produced by the World Economic Forum only two years after the “The Future of Jobs” that was launched in 2016. The Forum explains the need of a new report due to the further acceleration in the pace of change (World Economic Forum, 2018).
At the risk of being outdated by a new innovation presented tomorrow, some authors point to a set of technologies that are shaping the new industrial transformation. “The Future of Jobs” (World Economic Forum, 2018), pinpoints four specific technological advances that are presented as drivers of change: ubiquitous high-speed mobile internet; artificial intelligence; widespread adoption of big data analytics; and cloud technology. Other studies explain that industry 4.0 combines relevant physical and digital technologies, whose drivers are related with: analytics, additive manufacturing, robotics, high-performance computing, natural language processing, artificial intelligence and cognitive technologies, advanced materials, and augmented reality (Deloitte, 2018). From the point of view presented by McKinsey & Company, (2016) , the fourth industrial revolution is set in four pillars: data, computational power and connectivity; analytics and intelligence; human-machine interaction; and conversion to the physical world.
Even though technology is at the base of all industrial revolutions, in the fourth industrial revolution there are other elements that need to be considered. Environmental causes (such as the goal to eliminate waste), maximum product efficiency, green energies and sustainable growth will have a major influence on the paths chosen (Hawken et al., 2013). Other aspects that can have influence in the developments is the appearance of neo-luddites, movements that advocate anti-liberal instincts and reindustrialization to prevent unemployment and degradation of the community (Kryszcuk & Wenzel, 2017). The new luddites are particular active in the last years in subjects regarding automation and replacement of people by machines.
However, none of this needs to happen. The positive or negative impacts of technology will to a great extent depend on the policies adopted. And technology is
not, of course, the only driver of change for the job market. Other key factors are, for instance, population and education, which we will analyze next.
2.3 Demographics
After presenting some of the past events that reshaped the way in which work was organized, it is time to start analyzing the present situation. In this sub-chapter we present in a detailed and quantitative manner the population demographics. This data helps us to understand both the current situation and the likely future scenario for the EU, always in a comparative perspective, in which data for the EU is compared with the global scenario.
In the following pages we address the population numbers and its growing rates, the age groups in which population is distributed, as well as the labor force. Moreover, we also go through the numbers of education and employment numbers so as to grasp their current situation and how they can influence the future and shape our projections for 2030.
2.3.1 Population
According to the available data, the world population has been constantly growing, reaching a peak in 2017 (the last year of the available data), which by now has certainly been topped. The estimations point to a continued growth, expecting 7.76 billion people in 2020, and 8.52 billion by 2030 (World Bank Group, 2018d). According to the best available estimates, the first take off in growth began in the 18th century, involving
relatively modest annual growth rates. Before that, the demographic rates were below 0.1% (Piketty, 2014). The highest population growth was registered during the 1960s with a growing rate above 2.0%. This rate has been decreasing and at the present moment the World population is increasing by 1.16% per year (World Bank Group, 2018d). At first glance, numbers around 1.16% and 2.0% can suggest low growth rates;
however, it is important to understand that these numbers are under what might be called the “law of cumulative growth”. This law holds that a low annual growth rate over a long period of time gives rise to progress. In other words, a growing rate of 2.0% doubles the population each 35 years.
Figure 1 shows the data regarding past years and the estimates for the following years.
Figure 1 – World population and growing rate. Data source: World Bank Group (2018b).
From the total population, 46.8% is accumulated in the 5 most populated countries: China 18.4%, India 17.8%, United States of America 4.3%, Indonesia 3.5% and Brazil 2.8%. By 2030, the concentration in the 5 most populated countries is estimated to have a small decrease by 2030, to 45.1%, distributed by: India 17.8%, China 16.6%, United States of America 4.2%, Indonesia 3.5% and Nigeria 3.1%. This information is also presented in Figure 2. 0 0.5 1 1.5 2 2.5 0 2 4 6 8 10 12 1960 1970 1980 1990 2000 2010 2020 2030 2040 2050 U n it s B ill io n s Year
Figure 2 – World’s most populated countries in 2017 and 2030 Data source: World Bank Group (2018b).
With 512.5 million people in 2017, the EU represented 6.8% of the world’s population. However, this percentage is expected to decrease to approximately 6.0% by 2030, as the EU is not following the growth rates taking place in the rest of the world and specialists believe that its population can start declining by 2028. From Figure 3, it is possible to see the evolution of EU population and its growing rate. It is important to note that the data referred to the EU presents data from 28 countries (the 28 that belong to EU since 2013 until the time we collected this data, in January 2019) (World Bank Group, 2018d).
0% 2% 4% 6% 8% 10% 12% 14% 16% 18% 20%
China India USA Indonesia Brasil Nigeria
P er ce n ta ge Country 2017 2030
Figure 3 – EU’s Population and its Growing Rate. Data source: World Bank Group (2018b).
The 5 most populated countries represent 63.0% of the European Union population: Germany 16.1%, France 13.1%, United Kingdom 12.9%, Italy 11.8% and Spain 9.1%. By 2030 the same 5 countries (assuming all of them are staying in the EU) would have 63.6% of the total EU population by 2030: Germany 15.8%, United Kingdom 13.6%, France 13.6% Italy 11.6% and Spain 9.0%. Figure 4 shows this information.
-0.4 -0.2 0 0.2 0.4 0.6 0.8 1 0 100 200 300 400 500 600 1960 1970 1980 1990 2000 2010 2020 2030 2040 2050 U n it s B ill io n s Year
Figure 4 – EU’s most populated countries in 2017 and 2030 Data source: World Bank Group (2018b).
2.3.2 Age Groups
When the subject is the population distribution by age group, there are three main segments: the first includes people from 0 to 14 years old, that do not have enough to work and are completely dependent; the second composed by people with ages between 15 and 64 years old that are in their majority capable of production, commonly named as active age; lastly, the third group consist in the population with more than 64 years old, this group is mainly constituted by retired people.
As we have already seen, in the global picture, the population is increasing, however, the distinct age groups have been performing differently.
The age group that encompasses people from 0 to 14 years old, has been increasing since 1960 (with the exception of the years 2000, 2002, 2003, 2004 and 2005) and it is expected to keep increasing until 2050. In 2017, this age group accounted for 25.9% of the total population, however, this value has been decreasing since 1967 and it is estimated to be 23.7% by 2030. 0% 2% 4% 6% 8% 10% 12% 14% 16% 18%
Germany United Kingdom France Italy Spain
P er ce n ta ge Country 2017 2030
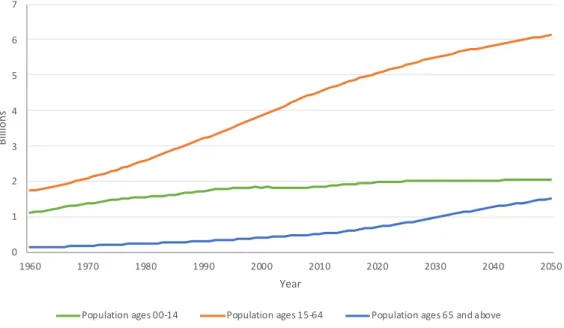
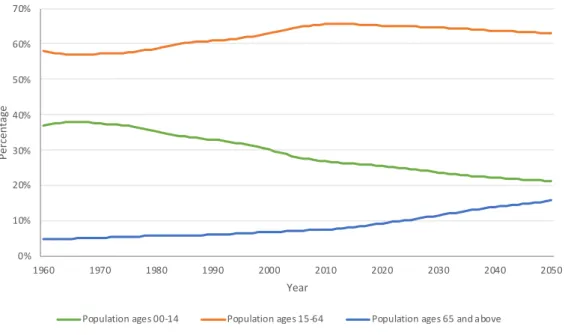
The segment that includes people aged from 15 to 64 years old has been increasing since there is available data and it is expected to continue growing. Its share in the global population grew until 2012 and started decreasing in the following years. In 2017, this age group represented 65.4% of the total population, number that is expected to decrease to 65.6% by 2030.
In the case of the group of the “elderly” (people more than 64 years old) the numbers have been growing sharply in total population but also in the share that they represent. In 2017 it accounted for 8.7% of the total population value and is expected to increase to 11.6% by 2030 (World Bank Group, 2018d).
Figure 5 and Figure 6 show the data about the age group distribution.
Figure 5 – World Age group distribution – total population. Data source: World Bank Group (2018b).
0 1 2 3 4 5 6 7 1960 1970 1980 1990 2000 2010 2020 2030 2040 2050 B ill io n s Year
Figure 6 – World Age group distribution – percentage of total population. Data source: World Bank Group (2018b).
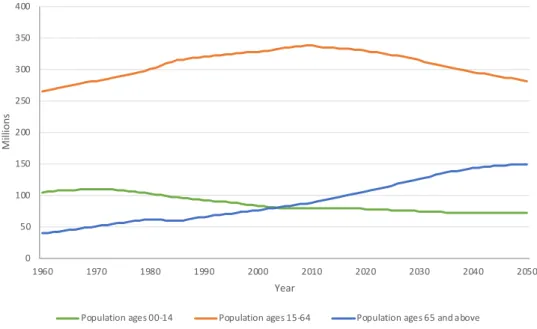
Closing the scope to the EU reality, the younger age group has been constantly decreasing since the year 1970 (with a 7 years exception in such period). Estimates point that its share in the total population will decrease until 2040. In 2017, 15.4% of the population had 0 to 14 years old, share that is estimated to be 14.5% by 2030.
The age group of the people between 15 and 64 years old stopped growing in 2010, and the percentage of people belonging to this age group started decreasing a bit sooner in 2006. Consisting in a majority of the population, in 2017 the group accounted for 64.8% of the total EU population, value that is expected to decrease to 60.9% by 2030.
Contrary to the other age groups, the group that includes people more than 64 years old has been growing in its numbers and also in its share of the total population. This growth is expected to be maintained. The group represented 19.8% of the total population by 2017 and specialists expect it to represent 24.5% by 2030 (World Bank Group, 2018d). 0% 10% 20% 30% 40% 50% 60% 70% 1960 1970 1980 1990 2000 2010 2020 2030 2040 2050 P er ce n ta ge Year
Figure 7 and Figure 8 show the data about the age group distribution in the European Union.
Figure 7 – EU’s Age group distribution – total population. Data source: World Bank Group (2018b).
Figure 8 – EU’s Age group distribution – percentage of total population. Data source: World Bank Group (2018b).
0 50 100 150 200 250 300 350 400 1960 1970 1980 1990 2000 2010 2020 2030 2040 2050 M ill io n s Year
Population ages 00-14 Population ages 15-64 Population ages 65 and above
0% 10% 20% 30% 40% 50% 60% 70% 80% 1960 1970 1980 1990 2000 2010 2020 2030 2040 2050 P er ce n ta ge Year
Despite the difference in magnitude, there are there are two factors that help to explain the current paradigm regarding the population age distribution. The first is the life expectancy at birth, it estimates lifetime in years for someone born in a given year. For example, someone who was born in 2016 can expect to live 72.0 years on average, but if this same person was born in the EU, he or she can expect to live 80.6 years. The difference between the two geographical areas (the EU vs. the entire world) has been on average 9.3 years, the time reference goes from 1990 to 2016. In the following years the value is expected to stabilize at 8.8 years (World Bank Group, 2018d). More detailed information can be found in Table 1.
Table 1 – Life Expectancy at Birth.
Life Expectancy at Birth (years)
EU World Difference 1990 74.9 65.4 9.4 1995 75.8 66.3 9.5 2000 77.2 67.7 9.5 2005 78.4 69.1 9.2 2010 79.7 70.7 9.0 2015 80.6 71.9 8.8 2020 81.6 72.8 8.8 2025 82.4 73.6 8.8 2030 83.2 74.3 8.8 2035 83.9 75.1 8.9 2040 84.6 75.7 8.9 2045 85.3 76.4 8.9 2050 85.9 77.0 8.9
The second factor is the fertility rate. This barometer can be translated in the average number of children that a woman would give birth to over her lifetime. In a simple exercise, we can say that with a constant life expectancy, and considering 50% women and 50% men, a fertility rate of 2 would maintain the population in its current numbers.
Figure 10 provides data about fertility rate. By 2016, each woman in the world could expect to have 2.4 children in her lifetime, but if that same woman were an EU citizen, she could expect to give birth to 1.6 children. On average, each EU woman contributes with less 0.8 children when compared with the World average (World Bank Group, 2018d).
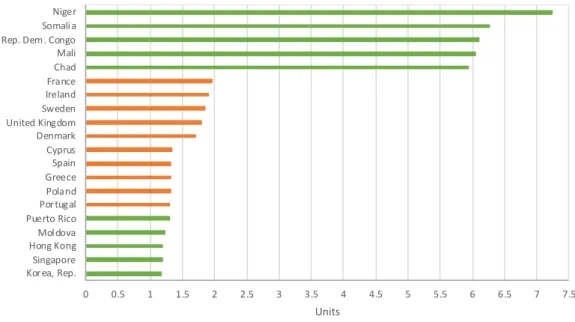
Considering the most recent available data without future predictions (2016), the 5 countries with lower fertility rates are: Republic of Korea, Singapore, Hong Kong, Moldova and Porto Rico with an average of 1.2 births per women; the 5 countries with higher fertility rate are: Chad, Mali, Democratic Republic of the Congo, Somalia and Niger with an average of 6.3 children per women. In this matter, the EU has numbers close to the bottom. With an average birth rate of 1.3 are the 5 countries with lower births per women: Portugal, Poland, Greece, Spain and Cyprus; on the opposite top we find: Denmark, United Kingdom, Sweden, Ireland and France with a fertility rate of 1.8 (World Bank Group, 2018d). Figure 9 shows an alternative to visualize the numeric data.
Figure 9 – Highest/Lowest fertility rates, global and EU perspective Data source: World Bank Group (2018d)
The gap between the world and the EU rates is expected to decrease in the upcoming years. By 2030, an average woman is estimated to give birth 2.4 births, less 0.11 than in 2016. Conversely, a woman with EU nationality would have 1.7 children, an increment of 0.16 compared to the 2016 numbers.
Figure 10 – Fertility rate, number of births per woman.
0 0.5 1 1.5 2 2.5 3 3.5 4 4.5 5 5.5 6 6.5 7 7.5 Kor ea, Rep.
Singapore Hong Kong Mol dova Puerto Rico Por tugal Poland Greece Spain Cyprus Denmark United Kingdom Sweden Ireland France Chad Mali Rep. Dem. Congo Somali a Niger Units 0 0.5 1 1.5 2 2.5 3 3.5 1990 1995 2000 2005 2010 2015 2020 2025 2030 2035 2040 2045 2050 U n it s Year
Data source: World Bank Group (2017).
2.3.3 Labor force
One of the key metrics to answer the research questions that we set out to investigate in this thesis is the number of people available to work or, put more precisely, the labor force. The labor force is defined by the World Bank Group (2018a) as “people aged 15 and older who supply labor for the production of goods and services during a specified period. It includes people who are currently employed and people who are unemployed but seeking work as well as first-time job-seekers.”.
This indicator grew slightly until 2005 and was relatively stable until 2017 (last year of available data) with an average of 46.0%. Within the EU, the labor force had its main growth between 1996 and 2008 and after that it stabilized with an average of 48.4% (World Bank Group, 2018a). Due to its volatility, the labor force is not an indicator easily calculated. Given that fact, and for reasons of reliability, in this this thesis we also use, in what concerns the EU, data from the Organization for Economic Co-operation and Development, OECD (2019). Even though there is a discrepancy between these values and those previously presented, the correlation between both sources amounts to 98.6%, which shows that both are moving in the same direction. The data presented can be visualized in Figure 11.
Figure 11 – Percentage of population in labor force. Data source: World Bank Group (2018d) and (OECD, 2019).
At first glance, one way to predict the labor force is to look at the age group that encompasses people between 15 to 64 years old. However, there are also indicators, such as the percentage of female/male population older than 14 years old, that can have a big impact.
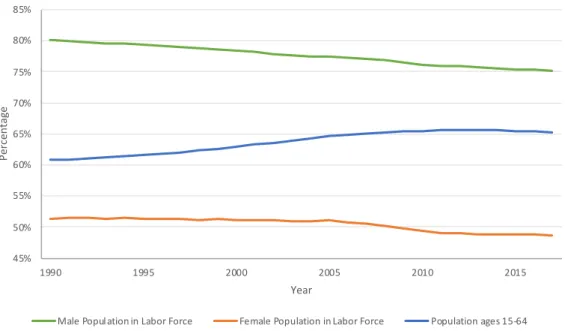
From 1990 to 2017, the World labor force grew 1.8%. As it is presented in Figure 12, in the same period, the population aged 15 to 64 years old grew 4.4%. The percentage of male population (more than 14 years old) in the labor force decreased 4.9% and the percentage of female population (more than 14 years old) in the labor force decreased 2.7% (World Bank Group 2018a; 2018b; 2018c; 2018d). These data allow us to understand that, in the perspective of the world taken as a whole, the labor force growth was sustained by the increase in the share of people aged 15 to 64 years old. On the opposite direction, the percentage of male/female population (older than 14 years old) in the labor force decreased, which can be possibly explained by the increase in the life expectancy at birth and a higher retirement rate (increasing the number of people with more than 14 years old that do not work).
43% 44% 45% 46% 47% 48% 49% 1990 1995 2000 2005 2010 2015 P er ce n ta ge Year
Figure 12 – Indicators with impact in the labor force. Data source: World Bank Group (2018b), (2018c) and (2018d).
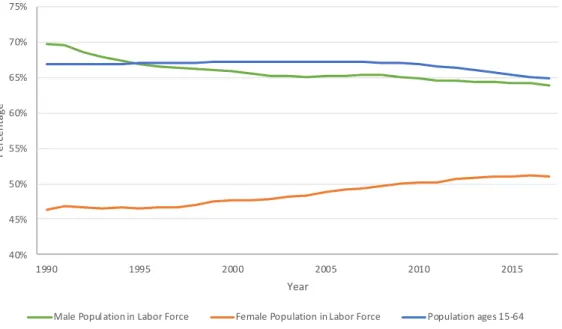
As for the EU, its labor force grew 2.1% between 1990 and 2017. This growth is backed by the female population (more than 14 years old) in the labor force that increased from 46.3% in 1990 to 51.1% in 2017, a surge of 4.8%. On the other side, the male population (more than 14 years old) in the labor force decreased 5.8% in the period, and the population share attributed to the age group 15 to 64 years old decreased by 2.1%. Once again, since the labor force consists of the people older than 14 years old, if the life expectancy rate increases and the people after a certain age stop working (retirement) the percentage of population in the labor force decreases. As it is possible to observe in Figure 13, the gap between male and female population (more than 14 years old) in labor force is shrinking, which shows that the EU is evolving towards gender equality in the percentage of the labor force. The increment of the female population (more than 14 years old) in the labor force is, by itself, not enough to sustain the labor force, and as it was seen before, the population aged between 15 to 64 years old is expected to decrease, which can lead to a future decrease in the percentage of labor force inside EU.
45% 50% 55% 60% 65% 70% 75% 80% 85% 1990 1995 2000 2005 2010 2015 P er ce n ta ge Year
Figure 13 – Indicators with impact in EU’s labor force Data source: World Bank Group (2018b), (2018c), (2018d).
The labor force dependency ratio is an indicator used to measure the pressure on productive population, as it divides the population that is not in the labor force by the population in the labor force. If the result is equal to 1 then each individual in the labor force has one dependent; if the ratio is higher than 1 then one person has more than one dependent; if it is lower than 1 then there are more people in the labor force than in the dependent population. Figure 14 presents the ratios in a World and EU perspectives. 40% 45% 50% 55% 60% 65% 70% 75% 1990 1995 2000 2005 2010 2015 P er ce n ta ge Year
Figure 14 – Labor force dependency ratio Data source: World Bank Group (2018b)
2.3.4 Education
To understand how the future of the labor force is going to be, it is also crucial to understand the current state of education both around the world and the EU, and to indicate some of the predictions for the future. Indeed, there is a strong correlation between high levels of education and a high level of labor productivity and greater ability to absorb advanced technology (Barro & Lee, 2013).
School systems are not uniform around the world. In this thesis, we adopt the following terminology: primary school, also known as elementary school, provides basic literacy as well as numeracy; secondary school, provides levels 2 and 3 of the International Standard Classification of Education (ISCED, 2011), that aim to lay the foundation for lifelong learning and a more specialized education; tertiary schools, correspond to the level 5 and 6 of the ISCED 2011 and may be academically based or practically oriented / occupationally specific.
When the subject is education, the enrollment rate is undoubtedly one of the ratios to consider. However, to better understand the following data, the difference between
0.8 0.9 1 1.1 1.2 1.3 1990 1995 2000 2005 2010 2015 U n it s Year
net and gross ratio should be clarified. According to the World Bank Group (2018f), the net enrollment rate is the “ratio of children of official school age who are enrolled in school to the population of the corresponding official school age”, on the other side, the gross enrollment rate is the “ratio of total enrollment, regardless of age, to the population of the age group that officially corresponds to the level of education shown” (World Bank Group, 2018e).
The primary school net enrollment ratio had been increasing worldwide since 1990 (with exceptions for 1992, 1995, 1996, 1997 and 2013), reaching 89.5 % in 2016 (the last year of available data). In the same period, the EU also did some progess increasing its ratio from 95.3% to 97.2%. Looking at the primary school gross enrollment ratio, since 2002 the gap between the world average and the EU disappeared and the difference between them is, on average, 0.6%. The difference between the net and gross ratios is, on average, 15.7% in the case of the whole world and 5.7% for the EU. In the available period the gap decreased by 2.4% worldwide and 0.3 for the EU (UNESCO Institute for Statistics (UIS), 2018). All the data about the primary school net and gross ratios, from the standpoints of both the world and the EU, can be seen in Figure 15.
Figure 15 – Primary school enrollment ratio 70% 80% 90% 100% 110% 1990 1995 2000 2005 2010 2015 P er ce n ta ge Year
Data source: UNESCO Institute for Statistics (2018)
Worldwide, secondary school was not perceived to be as essential as primary school, and the first indicator of this reality is the lack of data regarding the net enrollment rate from 1990 until 1998. The second indicator is the low enrollment percentage, despite its growth with an average rate of 0.6% (remember the “law of cumulative growth”), only 65.6% of the children with the official school age are enrolled in school. In this matter, the EU did a good progress especially in the years preceding 2005, where it increased its secondary school net enrollment by 9.9%; in 2016 its ratio was 92.2%. The gross enrollment rates have been following the net rates tendency, with the exception of, as presented in Figure 16, the EU abrupt rise in 2014 which was not followed by the net enrollment rate (UNESCO Institute for Statistics (UIS), 2018).
Figure 16 – Secondary school enrollment ratio Data source: UNESCO Institute for Statistics (2018)
The higher level of education analyzed in this work is the tertiary school and, due to its students age diversity, the net enrollment ratio is not calculated. From Figure 17 it is possible to see that in both areas (World and EU) it is growing. In the period for which data is availale, it grew 23.1% worldwide and 38.8% in the EU. These different
40% 50% 60% 70% 80% 90% 100% 110% 120% 1990 1995 2000 2005 2010 2015 P er ce n ta ge Year
growth rates resulted in an increment in the gap between the two areas, in 1990 it was 15.2% and by 2016 it was 30.9% (UNESCO Institute for Statistics (UIS), 2018).
Figure 17 – Tertiary school enrollment ratio Data source: UNESCO Institute for Statistics (2018)
The International Institute for Applied Systems Analysis (IIASA) / Vienna Institute of Demography (VID) (2015) projected the mean years of schooling for 2020 and 2030. This indicator shows the average number of years of education received by people aged 15 and older. Figure 18 and Figure 19 show the world map where colors represent different average values, the evolution is notorious in the scales, in 2020 the clear blue (lowest scale) represents approximatly 3.0 years of schooling in average, by 2030 it is expected to increase 33.8% to 4.0 years. The highest scale is estimated to increse by 2.5%. 0% 10% 20% 30% 40% 50% 60% 70% 80% 1990 1995 2000 2005 2010 2015 P er ce n ta ge Year
Figure 18 – World mean years of schooling 2020
Source: International Institute for Applied Systems Analysis (IIASA)/Vienna Institute of Demography (VID) (2015)
Figure 19 – World mean years of schooling 2030
Source: International Institute for Applied Systems Analysis (IIASA)/Vienna Institute of Demography (VID) (2015)
The maps available in Figure 20 and Figure 21 show the data for the whole of Europe. Some of the countries that belong to the EU are expected to increase its scale in the analyzed period, however, more important than that is the increse in the average values of all scales, meaning that, in a general way, all the EU countries would have people with more schooling years.