EQUALPI: A FRAMEWORK TO EVALUTE THE
QUALITY OF THE IMPLEMENTATION OF THE
CMMI PRACTICES
ISABEL DE JESUS LOPES MARGARIDO
TESE DE DOUTORAMENTO APRESENTADA
À FACULDADE DE ENGENHARIA DA UNIVERSIDADE DO PORTO EM ENGENHARIA INFORMÁTICA
F
ACULDADE DEE
NGENHARIA DAU
NIVERSIDADE DOP
ORTOEQualPI: a Framework to Evaluate the
Quality of the Implementation of the
CMMI Practices
Isabel de Jesus Lopes Margarido
Programa Doutoral em Engenharia Informática Advisor: Raul Moreira Vidal, FEUP
Co-advisor: Marco Paulo Amorim Vieira, FCTUC
c
EQualPI: a Framework to Evaluate the Quality of the
Implementation of the CMMI Practices
Isabel de Jesus Lopes Margarido
Programa Doutoral em Engenharia Informática
Approved by unanimity:
President: Doutor Eugénio da Costa Oliveira, Professor Catedrático da FEUP
Referee: Doutor David Zubrow, Associate Director of Empirical Research, Software So-lutions Division, Software Engineering Institute, Carnegie Mellon University
Referee: Doutor Marco Paulo Amorim Vieira, Professor Associado com Agregação do Departamento de Engenharia Informática da Faculdade de Ciências e Tecnologia da Uni-versidade de Coimbra (Coorientador e especialista em área científica distinta)
Referee: Doutor Fernando Manuel Pereira da Costa Brito e Abreu, Professor Associado do Departamento de Ciências e Tecnologias de Informação do ISCTE-IUL
Referee: Doutor Raul Fernando de Almeida Moreira Vidal, Professor Associado do De-partamento de Engenharia Informática da Faculdade de Engenharia da Universidade do Porto (Orientador)
Referee: Doutor João Carlos Pascoal Faria, Professor Auxiliar do Departamento de En-genharia Informática da Faculdade de EnEn-genharia da Universidade do Porto
Referee: Doutora Ana Cristina Ramada Paiva, Professora Auxiliar do Departamento de Engenharia Informática da Faculdade de Engenharia da Universidade do Porto
Abstract
The Capability Maturity Model Integration (CMMI) allows organisations to improve the qual-R ity of their products and customer satisfaction; reduce cost, schedule, and rework; and make their processes more predictable. However, this is not always the case, as there are differences in perfor-mance between CMMI organisations, depending not only on the context of the business, projects, and team, but also on the methodologies used in the implementation of the model practices. CMMI version 1.3 is more focused on the performance of the organisations than previous versions. How-ever, the Standard CMMI Appraisal Method for Process ImprovementSM(SCAMPI) is not focused on evaluating performance.
To evaluate practices performance it is necessary to consider the goal of executing the practice, and the quality of implementation of a practice is reflected in its outputs. Therefore, if we can establish a relationship between the methods used to implement a practice and the performance of its results, we can use such relationship in a framework to evaluate the quality of implementation of the practice. We consider that it is possible to objectively measure the quality of implementation of CMMI practices by applying statistical methods in the analysis of organisations’ data, in order to evaluate process improvement initiatives and predict their impact on organisational performance.
In this research we develop a framework to evaluate the quality of the implementation of the CMMI practices that supports the comparison of the quality of the implementation before and after improvements are put in place. Considering the extent of the CMMI model, we demonstrate the framework in the Project Planning’s Specific Practice 1.4 "Estimate Effort and Cost". We consider that the quality of implementation of this practice is measured by the Effort Estimation Accuracy, defined by a set of controllable and uncontrollable factors, and it can be improved by acting on the controllable factors. To implement and validate our framework we conducted literature reviews, case studies on high maturity organisations, data analysis of a survey performed by the Software Engineering Institute (SEI) and on the Team Software ProcessSM(TSP) Database, which we used to build a regression model, and conducted an experiment with students to define a process improvement.
This Ph.D. thesis provides to software development organisations a framework for self-assessing the quality of the implementation of the CMMI practices, EQualPI. The framework is also use-ful to the CMMI Institute, in order to evaluate the performance of the organisations from one SCAMPI A to the next. The framework is already populated with recommendations to support organisations willing to implement CMMI to avoid a set of problems and difficulties, factors to consider when implementing Measurement and Analysis for CMMI high maturity levels, a pro-cedure based on the scientific method to conduct process improvements, a performance indicator model to evaluate the quality of implementation of the effort estimation process, and indicators related with effort estimation accuracy. Additionally, with the implementation and validation of the EQualPI framework, we provide the procedure we used to analyse data from the SEI TSP Database and define process variables, and by applying the process improvements procedure, we contribute with a defects classification specific for requirements.
Resumo
O Capability Maturity Model Integration (CMMI) permite às organizações melhorar a quali-R dade dos seus produtos e satisfação dos seus clientes; reduzir custos, calendário e a necessidade de refazer trabalho. Com o CMMI os processos passam a ser mais previsíveis. No entanto nem sempre é este o caso, dado que há uma diferença de desempenho entre organizações que usam CMMI, que depende não somente do negócio, projectos e equipas mas também das metodolo-gias usadas na implementação das práticas modelo. A versão 1.3 do CMMI é mais focada na performance das organizações do que as anteriores, no entanto o seu método de avaliação, Stan-dard Appraisal Method for Process ImprovementSM (SCAMPI), não tem como objectivo avaliar o desempenho das organizações.
Para avaliar o desempenho de práticas é necessário considerar o objectivo de as executar e que a qualidade de implementação de uma prática se reflecte nos seus resultados. Por esse motivo, podemos estabelecer uma relação entre os métodos utilizados na implementação de uma prática e os resultados da sua performance. Consideramos que é possível medir objectivamente a qualidade de implementação das práticas do CMMI aplicando métodos estatísticos na análise dos dados de organizações, para dessa forma avaliar as iniciativas de melhoria de processos e prever o impacto que essas melhorias vão ter na performance da organização.
Nesta investigação científica desenvolvemos uma framework para avaliar a qualidade de im-plementação das práticas CMMI que permite comparar a qualidade da imim-plementação antes e depois de introduzir uma melhoria. No entanto, o CMMI é extenso, por esse motivo vamos demonstrar a framework na área específica do processo de Planeamento de Projectos 1.4 "Esti-mar esforço e custo". Consideramos que a qualidade de implementação desta prática é medida através da precisão da estimativa de esforço, definida por um conjunto de factores controláveis e não controláveis, e que o seu valor pode ser melhorado actuando sobre os factores controláveis. Para implementar e validar a nossa framework efectuámos revisões de literatura, casos de estudo em organizações de alta maturidade, análises de dados sobre um inquérito realizado pelo Soft-ware Engineering Institute(SEI) e sobre a base de dados do Team Software ProcessSM(TSP), que utilizámos para implementar um modelo de regressão linear, e conduzimos uma experiência com estudantes para definir uma melhoria de processo.
Como resultado desta tese de Doutoramento disponibilizamos às organizações a EQualPI, uma frameworkde auto-avaliação da qualidade de implementação das práticas CMMI. Esta framework também é útil para o CMMI Institute poder avaliar o desempenho das organizações aquando da recertificação. A EQualPI tem já incluídas recomendações de suporte às organizações que pre-tendem implementar o CMMI evitando um conjunto de problemas e dificuldades, recomendações sobre factores a considerar quando se implementa a prática de Measurement and Analysis em níveis de alta maturidade, um procedimento de melhoria de processo baseado no método cien-tífico, um modelo de um indicador de performance para avaliar a qualidade de implementação da prática de estimação de esforço, bem como um conjunto de indicadores relacionados com a precisão da estimação de esforço. Adicionalmente, da implementação e validação da EQualPI,
iv
resultou o procedimento que seguimos na análise dos dados TSP que se encontram na base de dados do SEI na definição das variáveis de processo, da aplicação do procedimento de melhorias de processo resultou também uma lista de classificação de defeitos específica para documentos de requisitos.
Acknowledgements
This adventure would have not been possible without the love and support of my better half, who took care of me in all the hard moments; my parents and my sisters who are always there for me and understood my long absences to do this research; my native reviewer and Mena.
I thank the SEI for receiving me so well, in particular Paul Nielsen, Anita Carlton, Rusty Young, Eileen Forrester, Gene Miluk, Jim Over, Mike Conrad, Bob Stoddard and Jim McCurley. Special thanks to Dave Zubrow and Bill Nichols for the great work we did together, and Dennis Goldenson for his advice and support.
I thank my SEPG friends, including Mike Campo, Kees Hermus and Mia, for the great mo-ments we spent together and CMMI talks.
My PhD colleagues, Professors and CISUC colleagues for all discussions and good times. A big thank you to my MBFs, for all the hangouts and my friends, close and absent, for sup-porting me.
I also thank my supervisors, co-authors and reviewers, who contributed to this research. Finally, I cannot finish without thanking to the person without whom I could not have done this research, Watts Humphrey.
Isabel de Jesus Lopes Margarido
This research was partially funded by Fundação para a Ciência e a Tecnologia (FCT) and Critical Software S.A., support grant SFRH/BDE/33803/2009:
Contents
1 Introduction 1
1.1 Research Scope . . . 2
1.1.1 Problem Definition . . . 2
1.1.2 Research Questions and Hypothesis . . . 3
1.1.3 Research Objectives . . . 4 1.2 Research Approach . . . 4 1.2.1 Contributions . . . 5 1.2.2 Beneficiaries . . . 5 1.3 Thesis Organisation . . . 6 2 Fundamental Concepts 7 2.1 Measurement . . . 8
2.2 Continuous Process Improvement . . . 9
2.3 Process Performance Measurement and Improvement . . . 12
2.4 CMMI Architecture and Appraisal Method . . . 15
2.5 TSP Architecture and Certification . . . 19
2.6 Effort Estimation in CMMI and TSP . . . 21
3 Background and Related Work 25 3.1 Process Improvements . . . 25
3.1.1 Historical Perspective on Metrics Programs and CMMI . . . 25
3.1.2 Nature of CMMI and TSP . . . 26
3.1.3 Problems in Process Improvements, Metrics Programs and CMMI . . . . 28
3.1.4 SCAMPI Limitations . . . 31
3.1.5 CMMI V1.3 Changes . . . 34
3.1.6 Methods and Models for Process Measurement and Evaluation . . . 36
3.2 Survey on MA Performance in HML Organisations . . . 43
3.3 Defect Classification Taxonomies . . . 47
3.4 Effort Estimation . . . 51
4 The EQualPI Framework 59 4.1 Framework Overview . . . 59
4.2 EQualPI’s Architecture . . . 63
4.3 EQualPI’s Metamodel: Repository and Evaluation . . . 67
4.4 Procedures Package . . . 69
4.4.1 EQualPI Setup, Tailoring and Evaluation . . . 70
4.4.2 CMMI Implementation: Problems and Recommendations . . . 75
4.4.3 Process Improvements . . . 89 vii
viii CONTENTS
4.5 Manage Configurations Module . . . 94
4.6 Repository Package . . . 96
4.6.1 Data Dictionary . . . 97
4.6.2 Domain Model . . . 99
4.6.3 Performance Indicator Models: Effort Estimation Evaluation . . . 106
5 EQualPI Validation 113 5.1 CMMI HML Implementation . . . 113
5.1.1 Further analysis of the HML Survey Data . . . 115
5.1.2 Case Studies . . . 123
5.1.3 Problems Analysis and Limits to Generalisation . . . 132
5.1.4 CMMI Implementation Discussion . . . 135
5.2 Requirements Process Improvement . . . 136
5.2.1 Experiments with Students . . . 141
5.2.2 Adoption by an Organisation . . . 146
5.2.3 Process Improvements Procedure Analysis . . . 148
5.2.4 Process Improvements Steps Discussion . . . 149
5.3 Evaluation of the Estimation Process . . . 150
5.3.1 Data Extraction and Characterization . . . 155
5.3.2 Data Munging . . . 156
5.3.3 Process Variables Definition and Data Aggregation . . . 157
5.3.4 TSP Estimation Model . . . 159
5.3.5 Effort Estimation Accuracy Model . . . 161
5.3.6 Cross Validation of the Standard Error . . . 166
5.3.7 Differentiating Factors on EEA Quality and EEA Ranges . . . 167
5.3.8 Limits to Generalisation and Dataset Improvements . . . 182
5.3.9 EEA PI Discussion . . . 182
6 Conclusions 187 6.1 Research Achievements . . . 187
6.2 Validation Discussion . . . 189
6.3 Answering Research Questions . . . 192
6.4 Research Objectives Achievement . . . 194
6.5 Challenges and Limits to Generalisation . . . 195
6.6 Future Research Work . . . 197
References 201 A Effort Estimation Methods 217 A.1 Effort Estimation Methods . . . 217
A.2 Factors Related with the Process . . . 220
A.3 Factors Related with the Project Execution . . . 230
B Process Improvement: Requirements Defects Classification 235 B.1 Confusion Matrix . . . 235
CONTENTS ix
D Survey About EQualPI 239
D.1 Survey Questions . . . 239 D.2 Results . . . 245 D.3 Conclusion . . . 249
List of Figures
2.1 Measurement components. Based onISO/IEC 15939:2007. . . 7
2.2 Shewhart cycle for learning and improvement: Plan, Do, Study, Act (Moen and Norman,2006). . . 10
2.3 Six Sigma’s DMAIC: Define, Measure, Analyse, Improve, Control (Hahn et al., 1999). . . 11
2.4 IDEAL model: Initiating, Diagnosing, Acting, Learning (Gremba and Myers,1997). 12 2.5 Mapping BSC into GQiM, into processes and sub-processes(SP). Monitored pro-cesses are being followed. . . 14
2.6 CMMI maturity levels in the staged representation. . . 15
2.7 Personal Software Process (PSP) training (Faria,2009). . . 19
3.1 Subset of the CMM(I) releases. . . 26
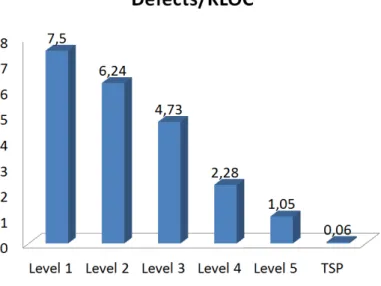
3.2 Average defects per thousand lines of code of delivered software in TSP and CMM different maturity levels (Davis and McHale,2003). . . 27
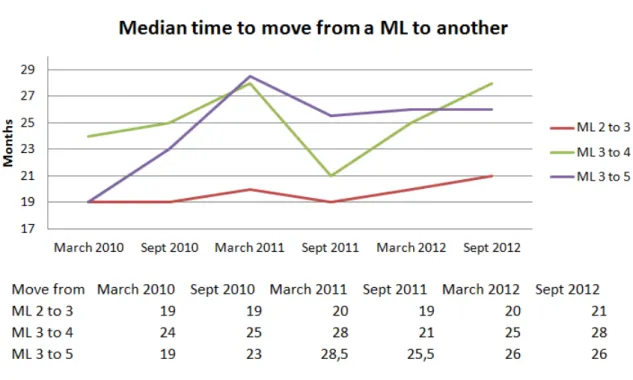
3.3 Median time to move from a ML to another based on semi-annual SEI reports from 2010 to 2012 (CMU/SEI,2010a,b,2011a,b,2012a,b). . . 29
3.4 Multi-model representation (Phillips,2010b). . . 34
3.5 Representation of OPM and OID (Phillips,2010b). . . 35
3.6 CMMI static process metamodel (Hsueh et al.,2008) . . . 41
3.7 Obstacles identified by the organisations respondents found in the implementation of HML (TR2010). . . 45
3.8 HP defects classification scheme (Freimut et al.,2005). . . 48
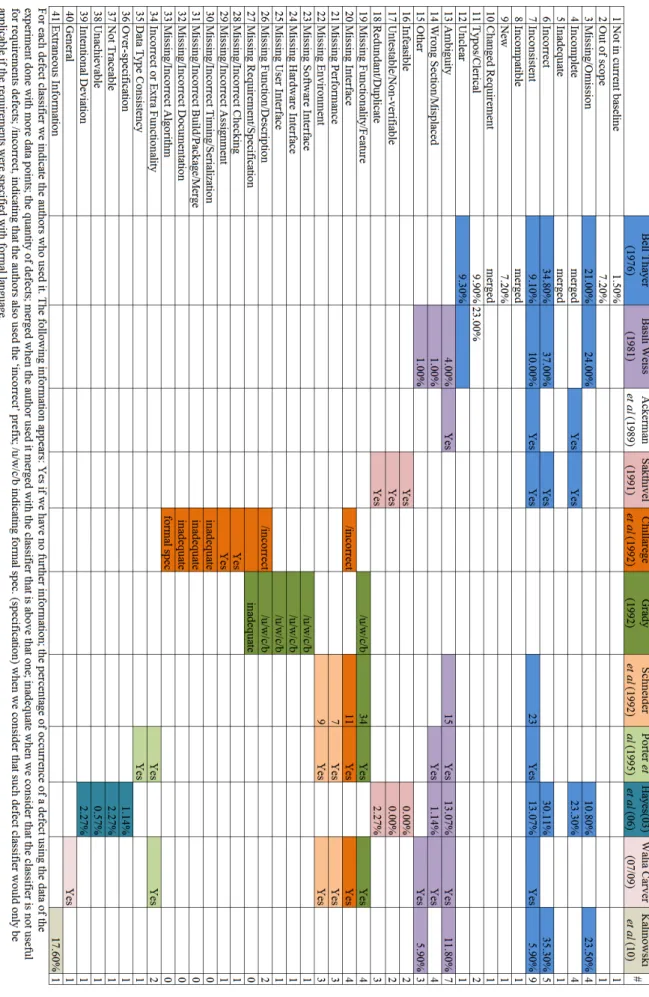
3.9 Defect classifier per authors by chronological order from left to right. . . 50
4.1 Bottom-up evaluation of practices implementation. . . 61
4.2 Building the Evaluation Framework (Lopes Margarido et al.,2011b). . . 61
4.3 EQualPI architecture level 0 - deployment perspective. . . 64
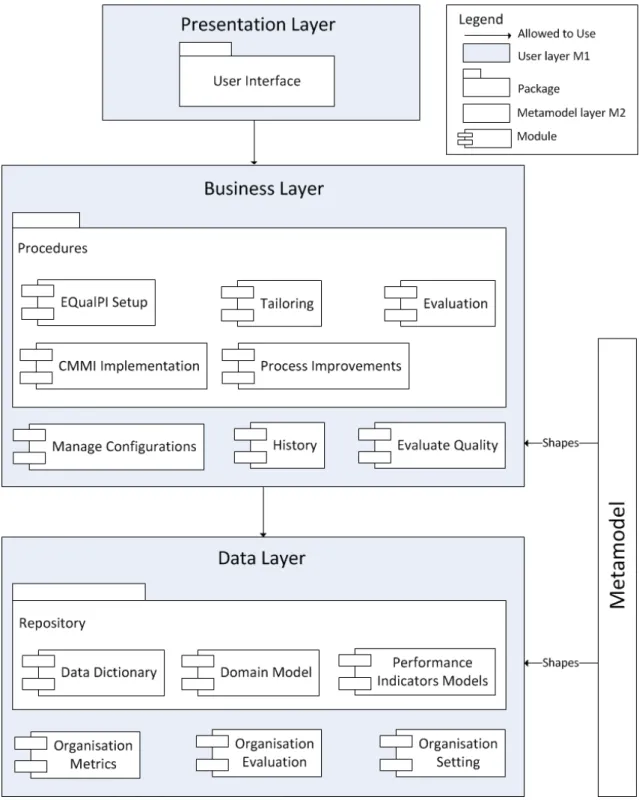
4.4 EQualPI architecture level 1 - static perspective. . . 65
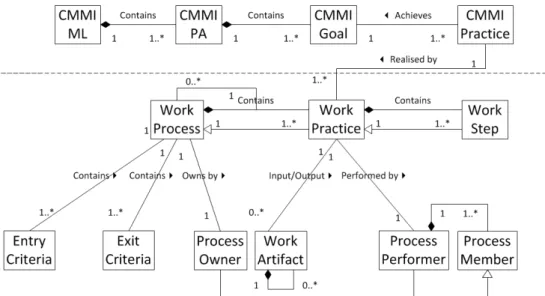
4.5 EQualPI’s Repository Metamodel (Lopes Margarido et al.,2012). . . 67
4.6 EQualPI’s Evaluation Metamodel (Lopes Margarido et al.,2012). . . 68
4.7 Contents of the Procedures package. . . 70
4.8 Flowchart of the setup of the EQualPI framework. . . 71
4.9 Evaluation of the Schedule Estimation Error (Lopes Margarido et al.,2011b). . . 72
4.10 Aggregation of evaluation in the source perspective and target perspective (Lopes Mar-garido et al.,2011b). . . 74
4.11 Representation of the scientific method (Goulão,2008). . . 89
4.12 Process improvement steps. . . 90
4.13 Contents of the Repository . . . 97 xi
xii LIST OF FIGURES
4.14 Use case of the TSP Database. . . 98
4.15 Data Entry elements. . . 100
4.16 Structure of the Data Dictionary . . . 101
4.17 Iterative projects overview. . . 102
4.18 Organisation elements. . . 103
4.19 Project elements. . . 104
4.20 Cycle elements. . . 106
4.21 Estimation and Development processes feedback loop. . . 107
4.22 Modules of EQualPI that we defined signalled in blue/shadowed, including the metamodel. . . 111
5.1 Relationship between giving incentives to people who use and improve MA, and the achievement of the HML goal (Lopes Margarido et al.,2013). . . 116
5.2 Relationship between managers who use PPM and PPB understanding the ob-tained results, and the achievement of the HML goal (Lopes Margarido et al.,2013).117 5.3 Relationship between understanding the CMMI intent with PPM and PPB by their creators, and the achievement of the HML goal (Lopes Margarido et al.,2013). . 118
5.4 Relationship between PPM and PPB creators understanding the CMMI intent and managers who use them understanding their results (Lopes Margarido et al.,2013). 119 5.5 Relationship between the availability of experts to work in PPM and managers who use them understanding their results (Lopes Margarido et al.,2013). . . 120
5.6 Relationships between performing data integrity checks and the achievement of the CMMI HML goal (Lopes Margarido et al.,2013). . . 121
5.7 Problems found in the case study organisations (CI, CII and CIII), the organisa-tions surveyed by the SEI (TR) and the literature review (LR). . . 133
5.8 Major sources of software failures, based onHamill and Katerina(2009). . . 137
5.9 Results of the McNemar test. The experiments have approximate results. . . 145
5.10 Percentage of defects found in requirements reviews by type. . . 147
5.11 EEA and MER histograms and statistics. . . 162
5.12 EEA and MER models outliers. . . 163
5.13 EEA and MER coefficients: Beta, Standard Error and Significance . . . 165
5.14 Total EEA in percentage, per project. . . 169
5.15 Percentage of projects on each Total EEA level. . . 170
5.16 Percentage of phases parts that were estimated based on size. . . 170
5.17 Comparison of the tasks per phase where size was estimated and where it was not. Not all phases present better estimates (lower EEA) when size is used. . . 171
5.18 Detailed Design Review Percentage (DLDRPerc) of tasks where the parts were measured in LOC distribution by ranges of Total EEA. . . 173
5.19 Detailed Design Review Percentage of the Implementation Phases (DLDRPer-cDev) of tasks where the parts were measured in LOC distribution by ranges of Total EEA. . . 174
5.20 Regression model of actual size and planned size. At the right in logarithmic scale. 181 5.21 Modules of EQualPI that we validated signalled in brighter blue/shadowed, in-cluding the metamodel. . . 186
B.1 Confusion matrix of the experiments conducted with the two groups of students. . 236
C.1 Phases EEA distribution by the ranges of Total EEA: 1 - <= 10%; 2 - 10 < Total EEA <= 25%; 3 - Total EEA > 25%. . . 238
LIST OF FIGURES xiii
D.1 Role of the subjects in the organisation and their relation with the CMMI. . . 246 D.2 CMMI level, appraised and perceived. . . 246 D.3 Respondents and their organisations interest in the Framework and their opinion
regarding its usefulness for performance evaluation. . . 247 D.4 Opinion of the subjects regarding the usefulness of the Framework requirements. 248 D.5 Opinion of the subjects regarding the usefulness of the Framework purposes. . . . 249
List of Tables
2.1 Rules to aggregate implementation-level characterisations (CMU/SEI,2011c). . . 18
2.2 Specific Goals and Practices of Project Planning Process Area (Chrissis et al.,2011). 22 3.1 Some of the problems identified in the implementation of CMMI (Leeson,2009). 31 3.2 KPI categories - based on (Sassenburg and Voinea,2010) . . . 39
3.3 Related Frameworks. . . 41
3.4 Summary of the surveys results TR2008 and TR2010. . . 44
3.5 Variables related with achieving HML and TR2008 and TR2010 surveys results comments. . . 45
3.6 Top 10 Higher-severity problem factors impacting software maintainability (Chen and Huang,2009). . . 48
4.1 CMMI Implementation Checklist: list of activities to follow in order to avoid common problems. . . 85
5.1 Statistics and hypotheses that were tested. . . 120
5.2 HML 2009 survey – further data analysis (Lopes Margarido et al.,2013). . . 122
5.3 MA recommendations for HML (Goldenson et al.,2008;McCurley and Golden-son,2010;Lopes Margarido et al.,2013). . . 123
5.4 Classification of type of defect for requirements (final version) (Lopes Margarido et al.,2011a). . . 140
5.5 Experiment conditions of each group. . . 142
5.6 Experiment results of the first group. . . 143
5.7 Experiment results of the second group. . . 144
5.8 Evaluation of the improvements steps we executed. . . 149
5.9 TSP Planning and Quality Plan Guidelines (Humphrey,2006) that we considered in our model. . . 158
5.10 Process Variables used to verify process compliance or determine the value of the planned metrics that define the process variable. . . 158
5.11 Actual Hours model coefficients, all variables are significant and the significance level of the model itself is 0,000 with adjusted R Square of 92,9%. . . 160
5.12 EEA and MER Models summaries. . . 165
5.13 EEA and MER ANOVA . . . 165
5.14 4-fold cross validation of the standard error of the estimates of the models EEA and MER. . . 167
5.15 Data of previously published TSP reports (McAndrews,2000;Davis and McHale, 2003) and the analysis we did using the dataset extracted in 2013 (TSP 2013). The medium, minimum and maximum of the effort deviation. . . 168
xvi LIST OF TABLES
5.16 Tests between groups to check if there is a statistically meaningful reduction of
Total EEA mean when the variable is present (Vn=3). . . 171
5.17 Variables whose means distribution is different across Total EEA levels. The de-fault confidence interval (CI) is 95%, we indicate the ones where it is 99%. . . . 173
5.18 Hypotheses related to the value of the Performance Indicator Effort Estimation Accuracy: results that we obtained in our research and other authors’ results. The ones not signalled were testes by Morgenshtern (2007). . . 174
A.1 Effort Estimation methods. . . 217
A.2 Factors considered on effort estimation. . . 220
Acronyms and Definitions
Acronyms
AIM Accelerated Improvement Method AFP Automated Function Points BSC Balanced Score Card
BUn Basic Unit
BU Business Unit
CAR Causal Analysis and Resolution (process area)
CI Configuration Item
CI, II COCOMO I, COCOMO II
CISQ Consortium of IT Software Quality
CL Capability Level
CM Configuration Management (process area) CMM Capability Maturity Model
CMMI Capability Maturity Model Integration CMMI-ACQ CMMI for Acquisition
CMMI-DEV CMMI for Development CMMI-SVC CMMI for Services COCOMO Constructive Cost Model CODEINSP Code Inspection
CR Code Review
DAR Decision Analysis and Resolution (process area) DCA Defect Causal Analysis
DL Deliverable
DLD Detailed Design
DLDR Detailed Design Review
DMAIC Define Measure Analyse Implement Control DoD Department of Defence (funding the SEI) DOE Design of Experiments
DPPI Defect Prevention Based Process Improvement EEA Effort Estimation Accuracy
EQualPI Framework to Evaluate the Quality of Process Improvements
f Function
FCT/UNL Faculty of Science and Technology, Universidade NOVA de Lisboa FCTUC Faculty of Sciences and Technology, University of Coimbra FEUP Faculty of Engineering, University of Porto
FI Fully Implemented
FL Fuzzy Logic
FPA Function Point Analysis
xviii ACRONYMS AND DEFINITIONS
FSS Feature Subset Selection
GA Genetic Algorithm
GG Generic Goal
GP Genetic Programming
GQiM Goal Question (Indicator) Metric GQM Goal Question Metric
H0 Null Hypothesis
H1 Alternative Hypothesis
HLD High Level Design
HML High Maturity Level
HP Hewlett-Packard
ICSE International Conference on Software Engineering
ID Unique Identifier
IDEAL Initiating Diagnosing Establishing
IEEE Institute of Electrical and Electronics Engineers IPM Integrated Project Management (process area) ISAM Integrated Software Acquisition Metrics ISO International Organisation for Standardisation
IT Information Technology
ITIL Information Technology Infrastructure Library KLOC Thousand Lines of Code
KPI Key Performance Indicators
LI Largely Implemented
LML Lower Maturity Level LSR Least Squares Regression M2DM Metamodel Driven Measurement
MA Measurement and Analysis (process area) MARE Mean Absolute Relative Error
MER Magnitude Error Relative
MIEIC Integrated Master in Informatics Engineering and Computation MinBU Minimum number of Business Units
MK II FPA Mark II Function Point Analysis
ML Maturity Level
MLP Multy-layer Perceptron
MMR Multidimensional Measurement Repository MMRE Mean Magnitude Relative Error
MRE Magnitude Relative Error
N/A Not Applicable
NI Not Implemented
NY Not Yet
ODC Orthogonal Defect Classification ODM Ontology Driven Measurement
OID Organisational Innovation and Deployment (process area)
OMG Object Management Group
OPM Organisational Performance Management (process area, CMMI V1.3) OPP Organisational Process Performance (process area)
OT Organisational Training (process area)
ACRONYMS AND DEFINITIONS xix
PB Publication
PBC Performance Benchmarking Consortium
PDCA Plan Do Check Act
PDSA Plan Do Study Act
PI Performance Indicator
PIm Partially Implemented
PMC Project Monitoring and Control (process area) PMI Project Management Institute
PMP Project Management Professional PP Project Planning (CMMI process area) PPB Process Performance Baseline
PPM Process Performance Model
PPQA Process and Product Quality Assurance (process area) PRED Percentage of Predictors
Price-S Parametric Review Information for Costing and Evaluation – Software PROBE PROxy-Based Estimation Method
PSM Practical Software Measurement PSO Particle Swam Optimization PSP Personal Software Process
QPM Quantitative Project Management (process area)
QUASAR Quantitative Approaches on Software Engineering and Reengineering RBF Radial Basis Function
RD Requirements Development (process area)
REQ Requirements
REQINSP Requirements Inspection
REQM Requirements Management (process area)
RQ Research Question
RSK Risk
RSKM Risk Management (process area)
SAM Supplier Agreement Management (process area) SBO Software Benchmarking Organisation
SCAMPI Standard CMMI Appraisal Method for Process Improvement
SD Standard Deviation
SDA Survey Data Analysis, further analysis of a survey conducted by the SEI SEER-SEM Software Evaluation and Estimation Resources – Software Estimation Model SEI Software Engineering Institute
SEMA Software Engineering Measurement and Analysis
SG Specific Goal
SLIM Software Lifecycle Management SME Small Medium Enterprise
SP Specific Practice
SPI Software Process Improvement SPR Software Productivity Research SRS Software Requirements Specification SSIC Systems and Software Consortium, Inc. SVM Support Vector Regression
TRW Tandem Random Walk
xx ACRONYMS AND DEFINITIONS
TSP Team Software Process
UCP Use Case Points
UML Unified Modelling Language USA United States of America
V Version
VAR Variance Account For
VARE Variance Absolute Relative Error
WP Work Product
ACRONYMS AND DEFINITIONS xxi
Definitions
Affirmations "Oral or written statement confirming or supporting implementation (or lack of implementation) of a model practice provided by the implementers of the practice, provided via an interactive forum in which the appraisal team has control over the interaction." (CMU/SEI,2011c)
Artefacts "Tangible forms of objective evidence indicative of work being performed that represents either the primary output of a model practice or a consequence of implementing a model practice." (CMU/SEI,2011c)
Benchmark To take a measurement against a reference point. Benchmarking is a process of comparing and measuring an organisation with the business leaders located anywhere (Kasunic,2006). The acquired information helps the organisation to improve its performance.
Constellation "A constellation is a collection of CMMI components that are used to con-struct models, training materials, and appraisal related documents for an area of interest (e.g., development, acquisition, services)." (CMMI Product Team, 2010)
Self-directed Teams Teams whose members sense the project needs without being told, help when-ever is necessary and "do whatwhen-ever is needed to get the job done." (Humphrey, 2006)
Data Sufficiency Rules Coverage rules that determine how much evidence (Affirmations and Arte-facts) needs to be provided in the SCAMPI A (Byrnes,2011).
Fully Implemented Sufficient artefacts and or/affirmations are present and judged to be adequate to demonstrate practice implementation (CMU/SEI,2011c). No weaknesses are noted.
Largely Implemented Sufficient artefacts and or/affirmations are present and judged to be adequate to demonstrate practice implementation (CMU/SEI, 2011c). One or more weaknesses are noted.
Not Implemented Some or all data required are absent or judged to be inadequate (CMU/SEI, 2011c). Data supplied does not support the conclusion that the practice is implemented. One or more weaknesses are noted.
Not Yet "The basic unit or support function has not yet reached the stage in the sequence of work, or point in time to have implemented the practice." (CMU/SEI,2011c)
Organisational Scope A subset of the organisational unit that is determined by selecting support func-tions and basic units to supply data for the SCAMPI appraisal (CMU/SEI, 2011c).
Organisational Unit The part of the organisation that is subject of a SCAMPI appraisal and to which results will be generalised (CMU/SEI,2011c).
Partially Implemented Some or all data required are absent or judged to be inadequate (CMU/SEI, 2011c). Some data are present to suggest some aspects of the practice are implemented. One or more weaknesses are noticed.
OR
Data supplied to the team conflict. One or more weaknesses are noted. Sampling Factors Rule to select the organisation Basic Units into subgroups that determine the
organisational scope to be target of the SCAMPI A (Byrnes,2011). Are used to ensure adequate representation of the organisational unit.
Standard Processes Processes that the organisation statistically controls to assure that the organi-sation and projects quantitative objectives are achieved.
Subgroups Subset of the organisational unit defined by sampling factors, that are basic units with common attributes (CMU/SEI,2011c).
Chapter 1
Introduction
When we open the book "CMMI (Capability Maturity Model Integration) for Development" (Chrissis et al.,2011) and read the preface, the models are presented as "collections of best prac-tices that help organisations improve their processes" and the CMMI for development (DEV) "pro-vides a comprehensive integrated set of guidelines to develop products and services". For years, several successful stories have been presented to the world, showing the benefits organisations achieved when using the model, going from improving the quality of the products and processes, to reducing schedule, costs (Herbsleb and Goldenson,1996) and amount of rework. Consequently, processes become more predictable and customer satisfaction increases (Goldenson et al.,2004). The model is an improvement tool that can be implemented step by step, to improve a process area, evaluate capability or maturity, or simply improve selected practices. CMMI also guides organisations in building measurement capability to provide the information necessary to support management needs, as stated in the Measurement and Analysis process area (Chrissis et al.,2011). For adequate use, it is necessary to understand the model as a whole. In the staged representation the CMMI model is composed of 5 maturity levels, each of them achieved with the implementa-tion of the specific and generic goals prescribed in the model in a current maturity level and all the precedent ones. To satisfy a goal the generic and specific practices, or acceptable alternatives to them, need to be fulfilled. Levels 4 and 5 are called high maturity levels. In these levels the organisations need to have knowledge on simulation, modelling and statistical analysis that sup-port building process performance models that are relevant to indicate the status of objective and measurable organisation goals, and have process performance baselines to quantitatively control process/product execution. In maturity level 5 the organisations use their knowledge and capa-bility of anticipating the behaviour of their standard sub-processes to support decisions regarding performance improvements or resolution of problems. This implies that decisions made are based on evidence of the success of the solutions.
There is plenty information, tips and cases of what makes CMMI work available in order to help organisations improve, but it is still their choice how they shape their processes to respond to their business needs and reflect their culture. Besides, a process may be defined but the real pro-cess is the one actually being executed. Even on strict sets of rules, the real propro-cess may still differ
2 Introduction
from the documented desired process. As each organisation has a choice of how to implement the model, use the practices and perform their work, there is high variability when comparing per-formance results. Therefore, there are unsuccessful cases and organisations achieving a maturity model but not performing accordingly. The Software Engineering Institute (SEI) and the United States Department of Defence (DoD) (Schaeffer,2004) expressed concern with high maturity im-plementation as not all organisations understood it well, which reflected on their performance, and the release of V1.3 was intended to fix this problem (Campo,2012).
CMMI Version 1.3 emphasises improvements on the organisations’ performance, i.e. it clari-fies that organisations need to focus processes on their business goals and carry out performance improvements to achieve those goals that are continuously improving. The Standard Appraisal Method for Process ImprovementSM (SCAMPISM) appraises the alignment of the organisation’s
processes, activities and results with the CMMI model but its objective is not to measure perfor-mance. To the best of our knowledge there is no tool to measure organisations’ performance and evaluate it as a result of the quality of implementation of the CMMI practices and/or goals.
1.1
Research Scope
Given the afore mentioned facts, we conducted the research in this Ph.D. with the purpose of contributing to prior knowledge, overcoming some of the current limitations found, proposing a Framework to Evaluate the Quality of Implementation of Process Improvements (EQualPI), of which we validated part of its modules, and providing guidance to continue our work and for future research in this area. I chose to represent EQualPI as = π as I consider that once the organisations implement the CMMI practices focusing on the performance outcomes and its benefits, they will achieve perfection, and for me π (pi) is a perfect number.
1.1.1 Problem Definition
The problem to solve is composed of three main aspects. One is that CMMI has a high variabil-ity of performance within the same level (Radice,2000;Schreb,2010).Schreb(2010) compiled the problems of CMMI: implementations that do not impact projects, wide range of solutions for the same practice not all leading to high performance, and highly variable approaches to imple-mentation that may not lead to performance improvement. The model is not prescriptive, it only provides guidance and therefore the performance of the organisations implementing it depends on factors related to the business and teams, but also on the methods used to perform the work and quality of implementation of the model. In fact, as Peterson stated, the big issue is CMMI implementation (Schreb,2010). Furthermore, we state that the quality of the implementation of the practices has an impact in performance indicators, related to the organisations’ objectives.
Another aspect of the problem is the quality of implementation of the model. Some organ-isations have difficulties in the selection of the implementation methods, others simply copy the model as if it was a standard, leading to bad implementations. We consider that if the quality of implementation is good, the performance of the organisation using CMMI is improved.
1.1 Research Scope 3
Lastly, we consider that there is a need for a performance evaluation method that can help organisations to assess the quality of implementation of the practices and if they are actually improving their results or not. Even though version 1.3 of the CMMI model is more focused on the organisation performance, the objective of the SCAMPI is not to measure performance but appraise organisations’ compliance with the model. Regarding this problem we consider that it should be possible to define metrics that measure the quality of the implementation of the CMMI model and measure the effects of process improvements. Having this capability would help to avoid implementation problems by early recognition of failures.
We synthesise the problem that we tackled in the following statement:
Not all organisations using CMMI achieve the best performance results, which could be achieved using a good implementation of the model. If a relationship can be established be-tween methods used to implement a practice and the performance results of that practice, such relationship can be used in a framework to evaluate the quality of implementation of that practice.
1.1.2 Research Questions and Hypothesis
Our research questions (RQ) were the following:
RQ 1 - Why do some organisations not achieve the expected benefits when implementing CMMI? RQ 2 - Why does SCAMPI not detect implementation problems, or does not address
perfor-mance evaluation in all maturity levels?
RQ 3 - What additional recommendations can we provide to organisations to help them avoid problems when implementing CMMI?
RQ 4 - How can we evaluate the quality of implementation of the CMMI practices, ensuring that organisations fully attain their benefits and perform as expected?
RQ 5 - Is it possible to define metrics to evaluate the quality of implementation of CMMI prac-tices focused on their effectiveness, efficiency and compliance?
RQ 6 - Can we determine the effects, expressed in a percentage, of uncontrollable factors in an evaluation metric?
Based on the problem statement, and the theory that there is a relationship between the quality of implementation of a CMMI practice and the quality of the outcome of the application of that practice. Based on the definitions of hypothesis given by Rogers(1966); Sarantakos(1993, page 1991) and Macleod Clark and Hockey(1981) we formulate ours as follows:
– It is possible to objectively measure the quality of implementation of the CMMI practices by applying statistical methods, in the analysis of organisations’ data, in order to evaluate process improvement initiatives and predict their impact on organisational performance.
To demonstrate our hypothesis we embarked on a quest to model a quality indicator to measure the quality of implementation of the CMMI Project Planning Specific Practice (SP) 1.4 "Estimate Effort and Cost".
4 Introduction
1.1.3 Research Objectives
This research had the following main objectives:
Objective 1 – Identify problems and difficulties in implementation of CMMI to help define the problem to tackle: considering the high variability of results that CMMI organisations present, evaluate the quality of implementation of practices based on quantitative methods. Objective 2 – Develop and validate a framework to evaluate the quality of implementation of the
CMMI practices.
Objective 3 – Demonstrate the evaluation of quality of implementation by building the perfor-mance indicator model to evaluate the particular case of the Project Planning process’s Spe-cific Practice 1.4 "Estimate Effort and Cost".
1.2
Research Approach
To answer our research questions and design our research methods we conducted literature re-views. The starting point was to identify the problems and difficulties in the implementation of CMMI practices, why did they occur, what were their causes and how could they be overcome. Furthermore, we analysed other researches contributions to help solve the problem, define the areas that required further research and also to base our solution definition on. Such approach allowed us to define the EQualPI framework base concepts, and develop its metamodel. We con-ducted a first case study to confirm and find other problems and recommendations that were added to the Framework as part of the Procedures Package.
The results of our first case study also gave us evidence that process improvements, even being well documented, required attention to ensure objective and quantitative analysis of their benefits. Therefore we defined the Process Improvements procedure. One of the issues we found in the first case study, was that requirements reviewers did not find the defects classification taxonomy in use, adequate for requirements defects. Therefore, all defects were classified as documentation. For that reason, we validated the Process Improvements procedure by developing a classification taxonomy specific for requirements defects and conducting a field experiment. We piloted the improvement with undergraduate and graduate students. The classification list was later adopted by an organisation which recognised its value.
During the definition and improvement of EQualPI we performed a second case study to fur-ther build and sustain the procedures and better define how the evaluation of the quality of imple-mentation of processes should be defined. The case study confirmed the results of the first one: when implementing high maturity levels, organisations found gaps in lower maturity levels and had difficulties in finding solutions to implement the new processes. That was in line with the first motivation to start this Ph.D, understand the lack of results of some high maturity organisations, find a solution to objectively evaluate the quality of the processes in order to achieve the claimed
1.2 Research Approach 5
improvement results and build performance indicator models that could be useful in such evalua-tion. Therefore, we analysed the reported results of organisations that achieved high maturity and the methods they used to build their process performance models and baselines and raised further questions that required further analysis of those surveys data. The results we achieve improved our list of recommendations and integrated the CMMI Implementation package and we did a final case study, to once again verify the identified problems were also found, the recommendations followed and further improve the CMMI Implementation procedure.
For the reason that we wanted to demonstrate the Framework in a Specific Practice, given the model extension (22 Process Areas with their respective Specific Goals and Practices) we selected the effort estimation Specific Practice. The rationale for choosing it was the importance of doing good estimates to execute the project building the right product, with the expected quality and respecting the plan. To validate the process area we used the Effort Estimation Accuracy variable and defined it as a function of controllable and uncontrollable factors. To build the model and therefore validate the EQualPI evaluation process we conducted a literature review on effort esti-mation processes, factors and models. We then developed EQualPI’s Data Dictionary to define and collect the necessary data to evaluate the effort estimation process. The development of the Data Dictionary was also based on the analysis of TSP projects documentation and so was the Domain Model, which identifies the relations between the variables at different levels (development cycle, project, organisation). We intended to use data of organisations projects that were: systematically collected; of which we could have further details about the estimation process and projects con-text; and that were valid. We used the SEI data of TSP projects to build our EEA model and test our hypothesis. The data was collected by the SEI using the Data Dictionary; we extracted further information from the TSP database and used the Domain Model to define the aggregation of data needed to be able to define the performance indicator model.
1.2.1 Contributions
With our research we developed the EQualPI framework, defined its metamodel and architecture. The research approach and Framework overview in themselves are a contribution for researchers and practitioners, constituting a methodology for analysing and evaluating processes performance, based on the quality of their results and, in particular, the CMMI processes and levels.
We validated the EQualPI modules CMMI Implementation, Process Improvement, Data Dictionary, Domain Model, part of the Evaluation at projects aggregation level, using the Pro-cess Performance Indicator Model that we built to evaluate Effort Estimation Accuracy.
1.2.2 Beneficiaries
The development and demonstration of our Framework will provide organisations a tool that can help them to:
• Implement CMMI, by providing a pool of methods that can be adapted to implement the practices, and performance indicators to monitor them;
6 Introduction
• Choose methods not only for their adequacy to context but for their performance, in terms of effectiveness and efficiency, when compared to others;
• Monitor process performance in order to act before problems occur; • Anticipate impact of process changes on the performance indicators; • Prioritise performance improvements;
• More accurately understand the origins of certain results.
The CMMI Institute will be able to assess whether there were actual performance improve-ments in a given organisation from one appraisal to the next. Researchers will benefit from the principles we established with EQualPI and with the Data Dictionary and Domain Model infor-mation to help them analyse TSP data.
1.3
Thesis Organisation
The remainder of this thesis is organised as follows:
In chapter 2 Fundamental Concepts, we present the concepts necessary to understand this research and the remaining chapters of the thesis.
Chapter3 Background and Related Work provides the necessary information to delimit the problem and the contributes of other researchers to help solve some of the problem components.
We present our contribution to solve open points identified on prior research, in chapter 4 The EQualPI Framework, the core of our research, where we detail the framework to evaluate the quality of implementation of the CMMI practices and how organisations can use it.
In chapter 5 EQualPI Validation, we validate the framework we presented in the previous chapter.
In chapter6 Conclusions we guide the reader as to how the framework is extended to other practices, indicate our achievements and their impact in the problem resolution, and define the boundaries of this research. We leave the research open and point to directions for future work that needs to be done in this area.
Chapter 2
Fundamental Concepts
Software Engineering is a discipline that appeared from the necessity of producing software applying engineering principles (van Vliet,2007). The Institute of Electrical and Electronics En-gineers (IEEE or I-triple-E) defines it as "the application of systematic, discipline, quantifiable approach to the development, operation, and maintenance of software; that is the application of engineering to software" (IEEE Std 610:1990). This concept is aligned withHumphrey(1988), who defined a Software Engineering Process as being the "total set of software engineering activ-ities needed to transform user requirements into software". The process may include requirements specification, design, implementation, verification, installation, operational support, and docu-mentation.Fuggetta(2000) extends the definition by stating that a software process is defined as a coherent set of policies, organisational structures, technologies and artefacts necessary to develop, deploy and maintain a software product.
If software engineering is a "quantifiable approach" it needs to be measurable, thus one must apply measurement. In Figure 2.1 we present the measurement components and the relations between them. We then clarify these concepts in the next section.
Figure 2.1: Measurement components. Based onISO/IEC 15939:2007.
8 Fundamental Concepts
2.1
Measurement
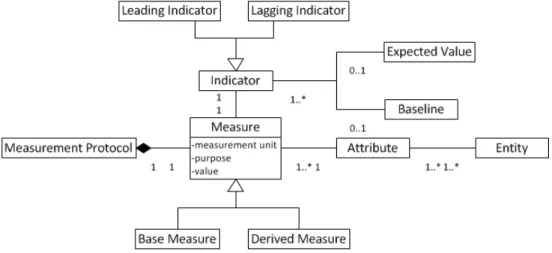
There are several definitions for adequate terms to use in software engineering with respect to expressions such as measures, metrics, metrication, etc. (Zuse,1997).Ragland(1995) clarifies the definitions of the terms "measure", "metric" and "indicator", based on the definitions of the IEEE and the Software Engineering Institute (SEI), and provides illustrative examples.
To measure (verb) (Ragland,1995) is to ascertain or appraise to a standard that may be uni-versal or local. It is considered an act or process of measuring; the result of measurement. The measure (noun) is the result of the act of measuring. An example of a measure is a single data point, for instance "today I produced 10 pages of my thesis". The data point to register would be 10, i.e. the value. However, that information would be insufficient to analyse the measure. It is necessary to define the measurement unit, that in this case is number of pages, and the purpose of the measure, in this case to know how long it took me to produce my thesis. The measure refers to an attribute, "property or characteristic of an entity that can be distinguished quantitatively or qualitatively by human or automated means" (ISO/IEC 15939:2007). InISO 14598:1998a metric "is defined as a quantitative scale and method which can be used for measurement". Such term is often used to designate the data point and all information that allows collecting and analysing it, and that is the definition we will follow in this thesis. So the definition of metric (ISO/FDIS 9126-1:2000;ISO 14598:1998) is more suited to the measurement protocol that we define later in this section. A base measure is "defined in terms of an attribute and the method quantifying it (ISO/IEC 15939:2007)", measures a single property or characteristic of an attribute, which can be a product, process or resource (McGarry et al., 2002). Base measures are used to calculate derived measures (ISO/IEC 15939:2007) or, using the previous definition, metrics.
An indicator (ISO 14598:1998) is a measure that estimates or predicts another measure, which may be used to estimate quality attributes of the software or attributes of the development pro-cess. Ragland(1995) refers to indicator as a device or variable that is set to describe the state of a process, based on its results, or occurrence of a predefined condition. The indicator is an imprecise indirect measure of attributes (ISO 14598:1998) that provides insight into the software development processes and improvements concerning attaining a goal, by comparing a metric with a baseline or expected result (Ragland,1995). A performance indicator is a measure that pro-vides an estimate or evaluation of an attribute. The performance indicator is derived from a base measure or other derived measures. This means that a performance indicator can even be derived from other performance indicators. A leading indicator anticipates quality, as it is a measure that allows forecasting and diagnosis (Ferguson,2008;Investopedia,2007). On the other hand, a lagging indicator follows an event or tendency, therefore allows appraising (Investopedia,2007). Regardless of the scientific field, measurement (Pfleeger et al.,1997) generates quantitative descriptions of key processes, products and resources, those measures are useful to understand the behaviour of what is being measured. The enhanced understanding of processes, products and resources is useful to better select techniques and tools to control and improve them.Pfleeger et al. (1997) consider that software measurement exists since the first compiler counted the number of
2.2 Continuous Process Improvement 9
lines in a program listing. In 1971,Knuthreported on using measurement data, instead of theory, to optimise FORTRAN compilers, based on natural language. In the CMMI for development model constellation1 (CMMI-DEV), the process measurement is considered to be a set of definitions, methods and activities used to take measurements of a process and the corresponding products for the purpose of characterising and understanding it (Chrissis et al.,2011).
One of the requirements for establishing a process measurement program is to put in place a measurement system.Kueng(2000) mentions two important characteristics of a process measure-ment system: it shall focus on the processes and not on the entire organisation or on organisation units, and the measurement system shall evaluate performance holistically, by measuring quanti-tative and qualiquanti-tative aspects. Kueng was focused on business processes without considering the relevance of measuring products characteristics and the importance of analysing processes results at different levels (projects, business units and organisations), for a complete measurement sys-tem.Kitchenham et al.(1995) enunciate some of the necessary concepts to develop a validation framework to help researchers and practitioners to understand:
• How to validate a measure;
• How to assess the validation work of other people;
• When it is appropriate to apply a measure according to the situation.
In the same work,Kitchenham et al.(1995) define measurement protocols as necessary ele-ments to allow the measurement of an attribute repeatedly and consistently. These characteristics contribute to the independence of the measures from the measurer and the environment. The mea-surement protocol depends on how the measured value is obtained and on the use that will be given to the measure. A measure is therefore applied to a specific attribute on a specific entity using a specific measurement unit for a specific purpose.
Doing proper measurement and analysis is fundamental to evaluate processes and products development performance, and to improve them. Process measurement allows inferring the per-formance of the processes.
2.2
Continuous Process Improvement
There are several continuous process improvement frameworks, some of which we present in this subsection: Shewhart Cylce PDSA (Plan, Do, Study, Act) - derived from the more known PDCA cycle (Plan, Do, Check, Act), Deming’s wheel (Moen and Norman, 2006), Juran’s Quality Im-provement Process (Juran and Godfrey,1998), Six Sigma’s DMAIC (Define, Measure, Analyse, Improve and Control) (Hahn et al.,1999) and the IDEAL model (Initiating, Diagnosing, Estab-lishing, Acting and Learning) (McFeeley,1996).
The Japanese defined the PDCA cycle naming it the Deming Wheel in 1951, which was al-ready based on a refined 4 steps product improvement Deming presented in 1950 (added a 4th step
10 Fundamental Concepts
- "redesign through marketing research") of the 3 steps cycle defined by Shewhart in 1939 (Spec-ification, Production, Inspection) (Moen and Norman,2006). In 1993, Deming named PDSA the Shewhart cycle for learning and improvement, which includes the following steps (Figure2.2):
• Plan: plan change or test, aimed at improvement; • Do: carry out the change or test;
• Study: analyse results to gather lessons learnt or understand what went wrong; • Act: adopt the change or abandon it, alternatively run through the cycle again.
Figure 2.2: Shewhart cycle for learning and improvement: Plan, Do, Study, Act (Moen and Nor-man,2006).
The quality improvement process (Juran and Godfrey, 1998) is defined as a continuous pro-cess established in the organisation, with a governance model and intended to last through the organisation lifetime involving the definition of a plan, roles and upper management roles. The author considered the relevance given to new developments was more emphasised and structured than the necessity of reduce "chronic waste", giving less attention to quality. The details of organ-ising and forming a quality council are described, as well as those of preparing the improvement projects including criteria and roles needed in the improvement project team. We emphasise the steps needed for an improvement, summarised as below:
• Awareness: have proof of the need;
• Determine the potential return on investment; • Select processes and project to implement; • Diagnosis journey: understand the symptoms;
• Formulate theories to identify the causes and select the ones to be tested, do retrospective analysis and check lessons learnt;
2.2 Continuous Process Improvement 11
• Establish controls to hold the gains; • Institutionalise the process improvement.
Six Sigma was used in Motorola to reduce defects but was published and used by many others. It has an approach for improving and also eliminating defects, DMAIC (Hahn et al.,1999) (see Figure2.3):
• Define: the problem, its impact and potential benefits;
• Measure: identify the relevant measurable characteristics of the process, service or product, define the current baseline and set the improvement goal;
• Analyse: identify the process variables causing the defects/inefficiencies;
• Improve: establish acceptable values for those variables and improve the process to perform within the limits of variation;
• Control: continue measuring the new process to ensure the process variables have the ex-pected behaviour and achieve the established improvement goal.
Figure 2.3: Six Sigma’s DMAIC: Define, Measure, Analyse, Improve, Control (Hahn et al.,1999). The IDEAL model is a continuous process improvement framework published by the SEI ( McFee-ley,1996) consisting of five phases and their respective activities (Figure2.4):
• Initiating: after a stimulus for the improvement, this phase includes activities to characterise the need and start a project. Includes the activities of: set context, build sponsorship and charter infrastructure;
• Diagnosing: understanding the current state (as is) and defining what the desired future state (to be) is. Includes the activities of: characterise current and desired states, set priorities and develop approach;
• Establishing: definition of the plan on how to achieve the desired state and test and improve the solution to implement. Includes the activities of: plan actions, create solution, pilot test solution, refine solution and implement solution;
• Learning: analyse what was done, understand if the goals were achieved, learn from the experience and prepare for future improvements. Includes the activities of: analyse and validate and propose future actions.
12 Fundamental Concepts
Figure 2.4: IDEAL model: Initiating, Diagnosing, Acting, Learning (Gremba and Myers,1997).
2.3
Process Performance Measurement and Improvement
CMMI-DEV defines process performance as a measure of the actual results achieved by follow-ing a process (Chrissis et al., 2011). It is characterised by both process measures and product measures. The process performance models depend on historical data of the processes perfor-mance and on which data is collected by the measurement system in place.
According to CMMI-DEV (Chrissis et al., 2011), the process performance model (PPM) describes the relationships amongst the attributes and the work products of a process. The rela-tionships are established from historical data of the process performance, and the calibration of the model is done using data collected from the product, process and metrics of a project. Con-sequently, the process performance models are used to predict the results achieved by following the process that the model represents.Kitchenham et al.(1995) indicate that in predictive models, such as COCOMO (COnstructive COst MOdel), variability of the predicted values may occur, caused by the incompleteness of the model, as there are factors that affect what is being predicted which may not have been considered in the model. The model error is the sum of the model incompleteness and the measurement error.
When the data collected on measures is stable, and the process performance model adequately supports the prediction of the behaviour of the projects, it is possible to understand the normal behaviour of the process, i.e., under known circumstances. The process performance baseline (PPB) characterises the behaviour of the process by establishing the maximum and minimum values where the process behaves under the expected causes of variation (Florac et al.,2000). If
2.3 Process Performance Measurement and Improvement 13
a project or process behaves outside boundaries, by a certain threshold, the model shall allow the anticipation of that occurrence. In that case the team needs to identify the special causes of the variation. If the variation brings negative consequences then the team needs to act in order to prevent deviation of the project or process. CMMI-DEV (Chrissis et al., 2011) defines process performance baseline as a documented characterisation of the actual results achieved by following a process. The baseline is used as a benchmark2to compare the actual performance of the process with its expected performance.
In his doctoral thesis,Dybå(2001) indicates that a broad definition of Software Process Im-provement (SPI) would include the following activities:
• Define and model a software process; • Assess the process;
• Refine the process;
• Innovate by introducing a new process.
Our perception is that to achieve process improvement it is necessary to measure the initial per-formance in order to compare it with the final perper-formance. The objective of the process improve-ment, after all, is to improve the process performance and we do not want organisations to loose the focus on that goal. For that reason, we introduce the term Software Process Performance Improvement. So Dybå’s activities are updated here to include the term performance:
• Define and model a software process performance; • Assess the process performance;
• Refine the process;
• Innovate by introducing a new process or new process version.
Considering that a process improvement must be measured and of value, it has to result in performance gains, hence a process improvement should not be done without considering that the process performance must be improved. Some may argue that a process improvement per se im-plies a performance improvement. Nonetheless, many organisations implement "improvements" without measuring the performance of the process as is and the final performance. Moreover, even if a particular process improvement leads to its better performance it may have a negative impact in other processes that cannot be perceived if the organisation does not do an overall control. In fact, an improvement of a process may coincide with a process improvement project but may result from another process change that may have been planned or not. For these reasons we consider that it is important to align process improvements with the organisation goals and focus on the correct outcome.
14 Fundamental Concepts
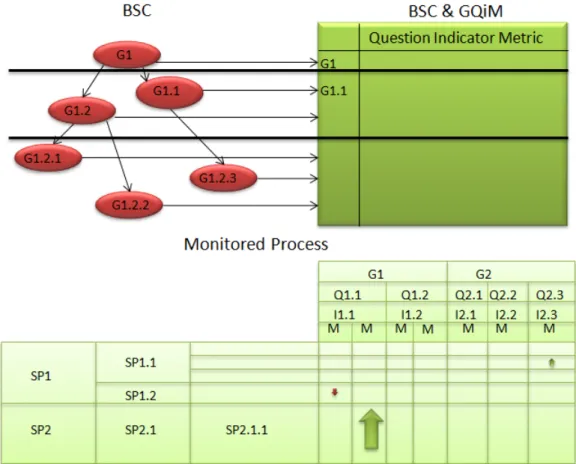
The task of identifying performance indicators which can show how the process is performing is not trivial. First of all, performance indicators per se do not necessarily show if the organisa-tion is doing better or worse. Those indicators need to be related with the organisaorganisa-tion business objectives. That is what it makes metrics implementation a challenge. To make the task easier, organisations can use tools such as the Goal Question (Indicator) Metric, Balanced Score Card (BSC) or the Goal-driven Measurement (Park et al., 1996), a combined application of the BSC and Goal Question (Indicator) Metric (GQiM). We illustrate the method in Figure2.5.
Figure 2.5: Mapping BSC into GQiM, into processes and sub-processes(SP). Monitored processes are being followed.
Note: Realistic metric (M) goals (G) are established, which may be to decrease a metric value, such as number of defects; or increase a metric value, as % of code being reviewed.
The business goals metrics are established using the BSC and are drilled down from organisa-tion’s goals to business units’ goals and ultimately projects’ and individuals’ goals. The metrics are derived by using the GQiM and mapped with the organisations different levels of goals. The most relevant goals/sub-goals for the business strategy are elicited, and realistic objective targets are established for those indicators goals. The metrics to determine the indicators are collected in different sub-processes. If the current processes performance does not allow achieving the quan-titative goals, then process performance improvement projects can be conducted in order to find solutions to achieve them.
2.4 CMMI Architecture and Appraisal Method 15
Process performance improvements result in updates in Process Performance Baselines and eventually in Process Performance Models. The Process Performance Baselines help defining Process Performance Models and there are bidirectional relationships between what needs mea-surement and what builds meamea-surement (processes, performance, models, baselines and improve-ments). CMMI has practices of Measurement and Analysis, at maturity level 2, and practices to build process performance models and establish process performance baselines in the the Organi-sational Process Performance process area (PA), at maturity level 4.
2.4
CMMI Architecture and Appraisal Method
CMMI has two representations designated continuous and staged (Chrissis et al., 2011). The continuous representation is organised in Capability Levels (CL), going from 0 to 3, while the staged representation is organised in Maturity Levels (ML) that range from 1 to 5. In our research we refer to the staged representation, because CLs are just applied to individual process areas, whereas MLs are applied across Process Areas. However, the framework we developed is usable in both representations as one organisation may select just a process area to evaluate or do a broader evaluation. In Figure2.6we present the CMMI maturity levels.
Figure 2.6: CMMI maturity levels in the staged representation.
To achieve a ML it is necessary to accomplish the Specific and Generic Goals of that ML and the precedent ones. In the Initial level (ML 1) there are no formal processes (Chrissis et al.,2011). In ML 2, Managed, the processes are planned and executed according to the organisation’s policy. The projects have documented plans necessary for their management and execution. At
16 Fundamental Concepts
this ML, the process description and procedures can be specific to a project. The statuses of the projects are visible to management and commitments with relevant stakeholders are established and revised as needed.
In ML 3, Defined, the standard processes are used to establish consistency across the organisa-tion and are continuously established and improved. The procedures used in a project are tailored from the organisation set of standard processes. The interrelationships of process activities and detailed measures of processes, work products and services are used to manage processes.
At ML 4, Quantitatively Managed, the organisation establishes quantitative objectives for quality and process performance. The projects have quantitative objectives, based on the goals of the organisation, customers, end-users and process implementers expectations. The projects’ selected sub-processes are quantitatively managed, i.e., the data of specific measures of the pro-cess performance are collected and analysed. The propro-cess performance baselines and models are developed by setting the process performance objectives necessary to achieve the business goals. The processes’ performance becomes predictable, based on the projects’ and processes’ historical data.
At ML 5, Optimising, the quantitative understanding of the business objectives and perfor-mance supports the organisation improvement decisions. The defined and standard processes’ performance, the supporting technology, innovations and business objectives are continuously im-proved based on the revision of the organisational performance and business objectives. The improvements are quantitatively managed. Maturity Levels 4 and 5 are known as High Maturity Levels (HMLs).
In CMMI the process areas are organised in categories, namely Process Management, Project Management, Engineering and Support (Chrissis et al.,2011). The Process Areas include Spe-cific Goals to accomplish, each of them presenting SpeSpe-cific Practices that help achieve those goals. Besides, at levels 2 and 3 the model includes Generic Goals, with the respective Generic Practices, applicable across process areas. When organisations are appraised at a ML or CL, the analysis is focused on what the organisations practices are to achieve the Specific Goals within that level.
SCAMPI is the method used to benchmark the maturity of a company in terms of the CMMI model (CMU/SEI,2011c). This method is used to identify strengths and weaknesses of the pro-cesses and determine the company’s capability and maturity level. There are three SCAMPI classes: A, B, and C. Class A is the most formal one, and is required to achieve a rating for public record. The other two apply when companies are implementing internal improvements at lower costs. In the remainder of this section we present two groups of SCAMPI rules that we believe should be considered in the evaluation of CMMI implementations, i.e., not the rules fo-cused on planning the SCAMPI, but the sampling factors and data sufficiency rules3. Knowing how organisations are rated at a CMMI level and the SCAMPI rules is important to help answer the research question R2 - Why does SCAMPI not detect implementation problems, or does not address performance evaluation in all maturity levels?