PLASTICITY INDUCED CRACK CLOSURE: A SENSITIVITY ANALYSIS L. Correia1, F.V. Antunes2 and A.L. Ramalho1,2
1
Escola Superior de Tecnologia do Instituto Politécnico de Castelo Branco Av. do Empresário, 6000 - 767 Castelo Branco
E-mail: [email protected]; [email protected] 2
CEMUC, Departamento de Engenharia Mecânica, Faculdade de Ciências e Tecnologia da Universidade de Coimbra, Rua Luís Reis Santos, Pinhal de Marrocos, 3030-788 Coimbra, Portugal.
E-mail: [email protected]
ABSTRACT
Plasticity induced crack closure (PICC) is closely linked to the monotonic and reversed plastic deformation occurring at the crack tip. The objective of the paper is to identify the different physical and numerical parameters affecting PICC, and develop a sensitivity analysis to quantify their relative importance. The main parameters affecting PICC are the load parameters, the yield stress, the size of finite elements and the numerical parameter considered to quantify PICC. The numerical predictions should be independent of numerical parameters, therefore further work is required to optimize the numerical models.
KEYWORDS: Fatigue Crack propagation, Plasticity induced crack closure, Sensitivity analysis. 1. INTRODUCTION
Fatigue of welds is a very complex phenomenon. Welding strongly affects the material by the process of heating and subsequent cooling as well as by the fusion of additional filler material, resulting in inhomogeneous materials. Furthermore, a weld is usually far from being perfect, containing inclusions, pores, cavities, undercuts etc. The shape of the weld profile and non-welded root gaps create high stress concentrations with widely varying geometry parameters. Last but not least residual stresses and distortions due to the welding process affect the fatigue behaviour. As a consequence, fatigue failures appear in welded structures mostly at the welds rather than in the base metal. In view of the complexity of the subject and the wide area of application, several approaches for fatigue analysis of welded joints exist 1: nominal stress approach, hot-spot stress approach, strain based approach, crack propagation approach. The presence of defects and the stress concentration reduces significantly the initiation life, therefore a crack propagation model is an interesting approach.
Accurate tools to predict the crack shape evolution as well as the fatigue life are crucial to increase the reliability and to reduce unexpected service failures. Numerical models have been successfully developed to predict fatigue crack propagation 2,3. However, their application to welds needs the inclusion of material heterogeneity, stress concentration, residual stresses and also crack closure. Crack closure is the contact of the fracture surfaces during a portion of the load cycle,
which is expected to reduce fatigue life. In fact, the application of fracture mechanics concepts to fatigue crack advance characterization are generally based on the premise that the compression portion of a fatigue cycle does not contribute to the growth of fatigue cracks. The main mechanism is plasticity induced crack closure (PICC), which is the promoted by the residual plastic wake existing behind crack tip. The deformed material acts as a wedge and the contact of fracture surfaces is forced by the elastically deformed material 4.
Numerical models have been successfully developed to predict plasticity induced crack closure 5,6. The numerical analysis of PICC based on finite element method (FEM) consists basically in the modelling of the cracked body with elastic-plastic behaviour, application of a cyclic loading, progressive extension of the crack and measurement of crack closure level. The procedure has a great number of parameters and most of the numerical studies have been focused on their optimization. A good agreement has been found between experimental results and numerical predictions in previous work 7.
The main objective here is to identify the different physical and numerical parameters affecting PICC, and develop a sensitivity analysis to quantify their relative importance. Different dependent parameters were considered to quantify the PICC level, namely the contact status of first node behind crack tip, the remote compliance and the contact forces at crack flanks.
2. NUMERICAL MODEL
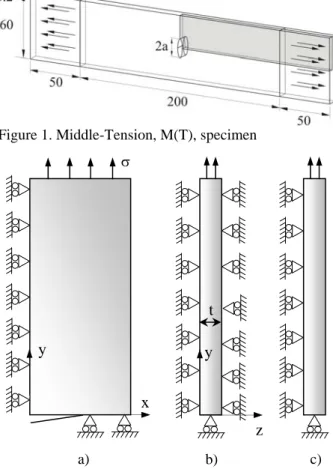
Figure 2a illustrates the geometry of Middle-Tension (M(T)) specimens studied, which is in agreement with ASTM E647 standard (1995). Due to symmetry conditions, only 1/8 of the sample was simulated corresponding to the shadow portion. The opposite crack surface was simulated by assuming frictionless contact conditions over a symmetry plane placed behind the growing crack front. A straight crack was modelled, with an initial size a0 of 5 mm (a0/W=0.167). The boundary conditions assumed are indicated in figures 2. Pure plane strain conditions were simulated constraining out-of-plane deformation in a specimen with a small thickness (t=0.1 mm). Plane stress state was modelled with a small thickness (t/2=0.1 mm; figure 2c). All the simulations were performed assuming a constant amplitude cyclic loading.
Figure 1. Middle-Tension, M(T), specimen
Figure 2. Physical model. a) Frontal view. b) Plane strain state. c) Plane stress state.
The material used for this research was the 6016-T4 aluminium alloy (HV0.5=92). The isotropic hardening model was described by a Swift type equation:
n p 0
)
(
K
Y
(1)combined with a non-linear kinematic hardening model described by a saturation law:
p X X sat X x C X
(2)Y is the equivalent flow stress, C, n, o, Cx and Xsat are
material constants,
σ
is the deviatoric stress tensor, X is the back stress tensor,
p the equivalent plastic strain rate and
the equivalent stress. The material constants determined for the batch of material in study, that were used in the numerical simulations, were: K=388 MPa, o=0.005, n=0.216, Cx= 146.5 and Xsat=34.90 MPa. A High Strength Steel (DP600) was also studied.
Figure 3 presents a typical finite element mesh, which was refined at the crack front to model the severe plastic deformation gradients and enlarged at remote positions to reduce the numerical effort. The crack front elements had a radial size L1=32 m. Only one layer of elements was considered along the thickness. The total number of linear isoparametric elements was 3227, while the number of nodes was 6626.
Figure 3. Finite element mesh.
Crack propagation was simulated by successive debonding of nodes at minimum load. Each crack increment (ai) corresponded to one finite element and two load cycles were applied between increments. In each cycle, the crack propagates uniformly over the thickness by releasing both current crack front nodes. Crack increments of 0.96 mm were considered, which correspond to 30 individual crack propagations. Finally, the opening load, Fop, necessary for the determination of
the closure level was determined considering three approaches. The first consisted in evaluating the contact status of the first node behind the current crack tip with the symmetry plane 4. The second was a global method based on the analysis of the global compliance data captured at the center of the specimen 8. From the load-displacement records, variations of Pop were derived using the maximization of the correlation coefficient technique. This technique involves taking the upper of the F- data and calculating the least squares correlation coefficient. The next data pair is then added and the correlation coefficient is again computed. The procedure is repeated for the whole data set. The point at which the correlation coefficient reaches a maximum could then be defined as Fop. The
third approach calculates the opening level from stress inversion at the crack tip.
The numerical simulations were performed with the Three-Dimensional Elasto-Plastic Finite Element x z y y a) b) c) t
program (DD3IMP) that follows a fully implicit time integration scheme 9. The mechanical model and the numerical methods used in the finite element code DD3IMP, specially developed for the numerical simulation of metal forming processes, take into account the large elastic-plastic strains and rotations that are associated with large deformation processes. To avoid the locking effect a selective reduced integration method is used in DD3IMP. The optimum values of the numerical parameters of the DD3IMP implicit algorithm have been well established in previous works, concerning the numerical simulation of sheet metal forming processes 10 and PICC 11.
2.1. Identification of PICC parameters
The PICC level depends on different physical parameters. The PICC phenomenon is closely linked to monotonic and reversed plastic deformation produced at the crack tip and to the residual plastic wake formation. Therefore all the parameters affecting crack tip plastic deformation are PICC parameters. The geometrical parameters are: specimen geometry (CT, MT, etc.), specimen’s thickness (t) and width (W), crack length (a), crack shape (tunnelling parameter, pt, and angle at
surface, ). The material parameters are the elastic constants (E, ) and the plastic deformation constants (isotropic- ys, n; and kinematic- Cx, Xsat). Assuming
mode I constant amplitude loading, the loading parameters are F (=Fmax-Fmin) and stress ratio (R=Fmin/Fmax). The stress intensity factor includes the effects of crack length, loading level, specimen’s width (=F/(ta)) and crack length:
a Y
K (3)
Y is the geometric factor, which varies with specimen’s geometry and crack length.
There are also numerical parameters, i.e., parameters associated with the numerical model. In fact, the predictions should be independent of the numerical parameters, however unfortunately this is usually false in PICC analysis. A main parameter is the finite element mesh, namely the radial size of crack front elements (L1). The refinment along the thickness and the
extension of refined region around crack tip may also be relevant. The propagation parameters are the number of load cycles between crack increments, the total crack extension and the stress level for crack propagation (maximum, minimum or other). Finally, the PICC level may be quantified with different parameters, namely the contact of first node behind crack tip, the stress inversion at crack tip, the contact forces behind crack tip and the stress inversión at crack tip.
The procedure has therefore a great number of parameters and most of the numerical studies have been focused on their optimization. The large number of numerical and physical independent parameters affecting PICC may justify some contradictory literature results.
2.2. Sensitivity analysis
Sensitivity analysis provides quantitative information on how a change in the input variables results in a modification of the output parameters. A non dimensional sensitivity can be defined as 12:
y x . x y ) x y /( x y nd ) y ( (4)
This non dimensional definition is quite convenient to compare the sensitivities of different input parameters. x and y are the input and output parameters, respectively, while y/x is the gradient of y versus x function. Notice that a sensitivity of 0.5 indicates that a variation of 1% in x produces a variation of 0.5% in y. The finite difference approach is the oldest and most commonly used method to calculate sensitivity coefficients. The forward finite difference is defined by the approximation: x ) x ( y ) x x ( y x y (5)
Only two function evaluations are required, which simplifies significantly the calculation process.
3. NUMERICAL RESULTS
Figure 4 shows the influence of load level on sensitivity. In general there is a great variation of sensitivity with load level. For plane stress state and stress ratios of 0 and 0.1 there is a minimum for max/ys0.4. On the other hand, for plane strain state and R=0.1 the increase of load decreases progressively the sensitivity. Relatively high sensitivities are obtained depending on load parameters. Notice that the increase of Kmax increases the magnitude of forward plastic deformation, which is expected to increase the opening level. On the other hand, the increase of K increases the magnitude of reversed plastic deformation, which is expected to decrease the opening level. For max/ys0.4 these opposite trends have similar strengths.
0 0.2 0.4 0.6 0.8 1 1.2 1.4 1.6 0.2 0.4 0.6 0.8 S e n si tiv ity max/ys[-] pstrain; R=0.1 R=0.1 R=0
Figure 4. Influence of load level on sensitivity. Figure 5 shows PICC values versus the minimum stress (being maximum stress constant). A linear relation is observed, which is explained by the increased reversed deformation with the decrease in minimum load. The monotonic plastic deformation is constant and so the reversed plastic deformation decreases the residual plastic deformation and so PICC level. Variations of about 41% were obtained for the aluminium alloy for the range studied.
0 0.2 0.4 0.6 0.8 -0.6 -0.4 -0.2 0 0.2 ope n / ma x min/ys max/ys=0.38 Steel max/ys=0.27
Figure 5. Influence of minimum load on PICC. Figure 6 shows the influence of specimen’s thickness on PICC. The increase of thickness reduces the PICC level, but the effect can be considered moderate. The effect of crack shape was also studied. A straight crack and a curved crack shape were studied and average values of 0.44 and 0.4 were obtained for PICC, respectively. 0 0.2 0.4 0.6 0.8 1 0.0 0.2 0.4 0.6 S e n si tiv it y z [mm]
Figure 6. Sensitivity of PICC to specimen thickness. Figure 7 shows the sensitivity of PICC1 (node contact) to material properties, for two load levels. The yield stress showed the biggest influence, which could be expected considering that PICC is closely linked to crack tip plastic deformation. The increase of load level increases the influence of ys, which could also be
expected. On the other hand, the hardening exponent produced a relatively small influence, which is linked to the relatively low plastic deformation level. The increase of load produces more plastic deformation, increasing the influence of n. The kinematic hardening parameters (Cx and Xsat in equation 2) showed relatively
low influences, indicating low levels of reversed plastic deformation. Finally, the Young’s modulus showed an unexpected high influence on PICC, considering that PICC is produced by plastic deformation. However, it is the elastic recovery of material that forces the contact of fracture surfaces and this explains the influence of E.
0 0.25 0.5 0.75 1 XS E ys n CCXX S e n si ti v it y
Figure 7. Sensitivity of PICC to material properties. max/ys=0.3 max/ys=0.7
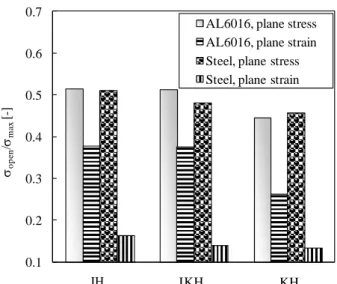
0.1 0.2 0.3 0.4 0.5 0.6 0.7 op e n /ma x [-]
AL6016, plane stress AL6016, plane strain Steel, plane stress Steel, plane strain
IKH
IH KH
Figure 8. PICC versus hardening model (IH, KH, MH - isotropic, kinematic and mixed hardening, respectively). Figure 8 shows the influence of the hardening model (the results in figure 7 were obtained for a mixed hardening model). The kinematic model gives the lowest PICC values, due to the increased reversed plastic deformation. A maximum difference of 36% was obtained for the aluminium alloy in plane strain conditions. A marked influence of stress state can also be observed in figure 8. The plane strain state gives significantly lower values compared with the plane stress state, because the stress triaxiality reduces plastic deformation level.
The parameters of finite element mesh are indicated in figure 9. The size of finite elements near crack front (L1) is fundamental to model the reversed plastic
deformation, the size of most refined region perpendicularly to crack flank (ym) is fundamental for a
proper modelling of monotonic deformation, and the extent of most refined region in crack propagation direction (xr), is fundamental to obtain stabilized PICC values. For ym=xr=1 mm, the PICC values were found to be quite insensitive to mesh variations. On the other hand, a relatively large sensitivity to L1 was found. In
fact, the decrease of L1 approaches the Gauss point to
the crack tip, increasing the plastic deformation level. Besides the number of load cycles applied to each near crack tip point increase. Figure 10 shows the sensitivity relatively to the size of finite elements for three load levels. The decrease of mesh size shows a decrease of sensitivity, which is positive because may reveal convergence. On the other hand, the decrease of maximum load greatly increased the sensitivity, which could be expected. In fact, the load reduction reduces crack tip plastic deformation therefore smaller meshes are required.
Figure 9. Parameters of finite element mesh.
0 0.2 0.4 0.6 0.8 1 0 10 20 30 40 S en sit iv it y L1[m] max/ys=0.48 max/ys=0.38 max/ys=0.24
Figure 10. Sensitivity of PICC to the size of finite elements.
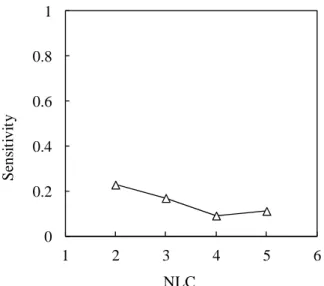
Figure 10 shows the influence of the numerical parameter considered to quantify the PICC level. The node number indicates the position behind crack tip. Remote nodes open first, i.e., the corresponding PICC values are lower. However, in literature only the first and the second node behind crack tip are considered to quantify PICC. The stress inversion at crack has also been studied. The corresponding PICC value is higher that obtained from node 1, as was expected. The remote compliance gives a relatively low value. Notice that a variation of 46% exists between the remote compliance and stress inversion, which is too much for a numerical parameter. Figure 10 also shows the influence of the number of load cycles between crack increments (NLC). A relatively low variation can be observed, which is reinforced by the sensitivity values presented in figure 12.
ym L1
0.2 0.3 0.4 0.5 0.6 0 1 2 3 4 5 6 7 8 9 10 11 ope n / ma x Node NLC=4 NLC=2 NLC=2, stress inversion NLC=2, remote comp
Figure 11. Influence of PICC numerical parameter.
0 0.2 0.4 0.6 0.8 1 1 2 3 4 5 6 S en sit iv it y NLC
Figure 12. Influence on PICC of numerical parameter. Finally, figure 13 shows the sensitivity of PICC values relatively to the crack propagation. At the beginning of crack propagation there is a relatively large sensitivity. As the crack propagates the residual plastic wake is formed and the sensitivity reduces significantly, indicating a robust prediction.
0.0 0.2 0.4 0.6 0.8 0 0.5 1 S en sit iv it y a [mm]
Figure 13. Sensitivity of PICC to crack propagation.
4. CONCLUSIONS
The main parameters affecting PICC are the load parameters, the yield stress, the size of finite elements and the numerical parameter considered to quantify PICC. The influence of loading parameters is however quite variable, but a high sensitivity can be obtained. The increase of thickness reduces the PICC level, but the influence is moderate. However, the abrupt transition from plane stress to plane strain state reduces significantly the PICC level. The influence of material parameters was also quite variable. The yield stress is the most influent parameter, which was expected. The hardening exponent, and the kinematic parameters were found to have a limited influence, which was explained by the relatively low plastic deformation level. The decrease of mesh size and the increase of load cycles may be expected to increase the influence of kinematic and isotropic parameters. The hardening model was found to have a significant influence. There is also a great sensitivity to numerical parameters, namely the size of finite elements near crack tip and the parameter used to quantify PICC. Therefore further work is required to optimize the numerical models, which ideally must be independent of numerical parameters.
ACKNOWLEDGEMENTS
The authors would like to acknowledge the Portuguese Foundation for the Science and Technology (FCT) and to FEDER (European Regional Development Fund) for the financial support (Project PTDC/EME-PME/114892/2009; COMPETE: FCOMP-01-0124-FEDER-015171).
[1] Fricke W. Fatigue analysis of welded joints: state of development. Marine Structures 2003, 16:185–200. [2] Lin X.B., Smith R.A. (1997). Shape growth
simulation of surface cracks in tension fatigued round bars. Int. Journal of Fatigue 19, 461-469. [3] Branco R, Antunes FV (2008). Finite element
modelling and analysis of crack shape evolution in mode-I fatigue Middle Cracked Tension specimens, Engng Fracture Mechanics 75, 3020-3037.
[4] Elber W. Fatigue crack closure under cyclic tension. Engng Fracture Mechanics 1970, 2:37-45.
[5] McClung RC, Sehitoglu H. On the finite element analysis of fatigue crack closure-1: Basic modelling issues. Engng Fracture Mechanics 1989, 33(2):237-252.
[6] Solanki K, Daniewicz SR and Newman Jr JC. Finite element modelling of plasticity-induced crack closure with emphasis on geometry and mesh refinement effects. Eng. Fracture Mechanics 2003, 70:1475-1489.
[7] Antunes FV, Branco R, Costa JD and Rodrigues DM. Plasticity induced crack closure in MT specimen: Numerical versus experimental. Fatigue Fract Engng Mater Struct 2010, 33:673–686.
[8] Toyosad M and Niwa T. The significance of RPG load for fatigue crack propagation and the development of a compliance measuring system. Int J Fract 1994, 67:217–230.
[9] Menezes LF and Teodosiu C. Three-Dimensional Numerical Simulation of the Deep-Drawing Process using Solid Finite Elements. Journal of Materials Processing Technology 2000, 97:100-106.
[10]Oliveira MC and Menezes LF. Automatic correction of the time step in implicit simulations of the stamping process. Finite Elements in Analysis and Design Vol. 2004, 40:1995–2010.
[11]Antunes FV and Rodrigues DM. Numerical simulation of plasticity induced crack closure: Identification and discussion of parameters. Engng Fracture Mechanics 2008, 75:3101–3120.
[12] Tortorelli D. and Michaleris P. Design sensitivity analysis: overview and review. Inverse problems in Engineering 1994, 1:71-105.