Rita Severino dos Loios
Bachelor Degree in Cellular and Molecular Biology
Optimization of strategies for
anti-cancer vaccines
Dissertation to obtain the Master Degree in
Molecular Genetics and Biomedicine
Supervisor: Professor Doctor Paula Videira, FCT/UNL
Co-supervisor: Doctor Tiago João Ferro, FCT/UNL
Júri:
President: Prof. Doctor José Paulo Sampaio Argue: Prof. Doctor Maria de Guadalupe Cabral
Vowel: Prof. Doctor Paula Videira
iii
Copyright
Optimization of strategies for anti-cancer vaccines
Rita Severino dos Loios
FCT-UNL, UNL
The Faculty of Sciences and Technology and the NOVA University of Lisbon have the right, forever and without geographical limits, to file and publish this dissertation through printed copies reproduced in paper or by digital means, or by any other means known or that is invented, and to disclose it through scientific repositories and to allow its copying and distribution for noncommercial educational or research purposes, provided that the author and editor are credited.
A Faculdade de Ciências e Tecnologia e a Universidade Nova de Lisboa têm o direito, perpétuo e sem limites geográficos, de arquivar e publicar esta dissertação através de exemplares impressos reproduzidos em papel ou de forma digital, ou por qualquer outro meio conhecido ou que venha a ser inventado, e de a divulgar através de repositórios científicos e de admitir a sua cópia e distribuição com objetivos educacionais ou de investigação, não comerciais, desde que seja dado crédito ao autor e editor.
v “If I cannot do great things, I can do small things in a great way” M. Luther King
vii
Acknowledgments
To my supervisor, Professor Paula Videira, for the opportunity to work in her Glycoimmunology group and for all the knowledge, guidance, advice and encouragement.
To my co-supervisor, Tiago Ferro, for all the teaching, guidance and advice.
To Tiago Costa for helping me every day, for his friendship, for being very supportive and share my worries.
To Fanny Deschepper and Roberta Zoppi for all the help in the lab with the different techniques and for being excellent teachers.
To all the colleagues of the Glycoimmunoly group for the knowledge transmitted, advices and companionship: Inês Ferreira, Érica Freitas, Gonçalo Mineiro and Zélia Silva.
To our collaborators from Jacobs University for providing us the microcapsules for the experiments.
To all my friends that supported me during this year, for all the conversations and advices and for all the coffees and dinners.
To my lovely family, specially to my father Carlos and sister Matilde for all the support in this hard year for the three of us, to my aunt Cristina for being a mother for me, to my grandparents for being always there for everything, to my aunt Catarina for the patience and for help in everything and also to my mother.
To Diogo, for all the support, friendship, long conversations, laughs, tears and for being very patient with me especially during this stressed year.
And last, to the “Departamento de Ciências da Vida da Faculdade de Ciências e Tecnologia” da Universidade Nova de Lisboa for the opportunity of developing this work.
ix
Abstract
Nowadays, cancer is one of the leading causes of death worldwide and treatments currently in use are often aggressive, invasive and not very effective. Promising therapeutic approaches include immunotherapies that has the potential to boost the immune system to fight cancer.
One type of immunotherapy is provided by vaccines of dendritic cells (DCs) or containing artificial antigen presenting cells (aAPCs). These vaccines are used to expand and activate T cells against specific tumors antigens, eliminating tumor cells and providing immunological protection. Activation of T cells in vivo is lead mainly by DCs. aAPCs are artificial systems that have as main goal to mimic the function that DCs have in vivo, by presenting antigens, the first signal required for T cell activation. Vaccines of aAPCs are easier to produce and maintain and overcome the issues of patient-derived autologous DCs.
The main aim of this thesis was to implement an in vitro assay to test the potential of a new generation of aAPCs, named PEMs, to activate antigen specific human T cells. PEMs consist of carbonated cores assembled with HLA-A02 molecules loaded with peptides.
To verify PEMs ability to activate T cells against a specific antigen (cytomegalovirus (CMV) peptide), PEMs were co-cultured with human CD8+ T cells, isolated from healthy donors. The
activation of the cells was verified by the measure of the expression of IFN-γ by qPCR and ELISA. Results showed that, in some donors, there is an increase of IFN-γ when T cells are stimulated with PEMs complexed with HLA-A02 loaded with CMV peptide, compared with negative controls. PEMs show significant binding to CD8+ T cells.
With this study it was possible to conclude that PEMs are able to bind and activate T cells. However, there are still issues related to their stability and specificity. Future studies testing other aAPCs that present distinct cores and assemblies should be performed.
xi
Resumo
Atualmente, o cancro é uma das principais causas de morte no mundo e os principais tratamentos que são utilizados são frequentemente agressivos, invasivos e pouco eficazes. Abordagens terapêuticas promissoras incluem imunoterapias que têm o potencial de impulsionar o sistema imunológico para combater o cancro.
Um tipo de imunoterapia é fornecido por vacinas de células dendríticas (DCs) ou que contém células artificiais apresentadoras de antigénios (aAPCs). Estas vacinas são usadas para expandir e ativar as células T contra antigénios tumorais específicos, eliminando células tumorais e fornecendo proteção imunológica. A ativação de células T in vivo é conduzida principalmente por DCs. aAPCs são sistemas que têm como principal objetivo imitar a função que as DCs têm in vivo, apresentando antigénios, o primeiro sinal necessário para a ativação das células T. Vacinas de aAPCs são mais fáceis de produzir e manter e permitem ultrapassar os problemas de DCs autólogas derivadas de pacientes.
O principal objetivo desta tese foi implementar um ensaio in vitro para testar o potencial de uma nova geração de aAPCs, denominadas PEMs, para ativar células T humanas específicas para determinados antigénios. PEMs consistem em núcleos de carbono ligados a moléculas de HLA-A02 carregadas com péptidos.
Para verificar a capacidade das PEMs para ativar células T contra um antigénio específico (péptido do citomegalovirus (CMV)) as PEMs foram co-cultivadas com células T CD8+ humanas,
isoladas de dadores saudáveis. A ativação das células foi verificada pela medição da expressão de IFN-γ por qPCR e ELISA.
Os resultados mostraram que, em alguns dadores, houve um aumento de IFN- quando as células T foram estimuladas com PEMs complexadas com moléculas de HLA carregadas com o péptido CMV, em comparação com os controlos negativos. PEMs mostram ligação significativa às células T CD8+.
Com este estudo foi possível concluir que as PEMs podem ligar-se e ativar células T. Contudo ainda existem questões relacionadas com a sua estabilidade e especificidade. Futuros estudos, que testem outras aAPCs que apresentem outros núcleos e formas devem ser realizados.
xiii
Table of Contents
1 Introduction ... 1
1.1 Immunity, immune system and immunology ... 1
1.1.1 Innate immunity ... 1
1.1.2 Adaptive immunity ... 1
1.1.3 T cells ... 2
1.1.4 T cell activation ... 3
1.1.5 T cells differentiation after activation ... 4
1.1.6 Antigen presenting cells (APCs) ... 5
1.1.6.1 Antigen Processing and Presentation ... 5
1.1.6.2 MHC II/Endocytic Pathway ... 6
1.1.6.3 MHC I/Cytosolic Pathway ... 6
1.2 Cancer ... 7
1.2.1 Cancer treatment ... 9
1.2.2 Cancer immunotherapy ... 9
1.3 Artificial antigen presenting cells (aAPCs) ... 10
1.3.1 Cell Based aAPCs ... 11
1.3.2 Synthetic/Acellular aAPCs ... 11
1.3.3 Polyelectrolyte Microcapsules (PEMs) ... 12
1.4 Aim of Thesis ... 13
2 Materials and Methods ... 15
2.1 Flow cytometry ... 15
2.1.1 Screening of HLA-A02 positive donors by flow cytometry ... 16
2.2 Isolation of human peripheral blood mononuclear cells from buffy coats by density gradient………..17
2.3 Immunomagnetic isolation of CD8+ T cells from human peripheral blood mononuclear cells ... 17
2.4 Culture of CD8+ T cells ... 18
2.5 Efficacy of isolation method ... 18
2.6 Assembly of PEMs ... 19
2.7 Co-culture of CD8+ T cells with PEMs ... 19
2.8 Real time PCR ... 20
2.8.1 Analysis of genetic expression of IFN-γ in the cells recovery from co-cultures experiments, by RT-PCR ... 21
2.9 Enzyme-Linked Immunosorbent Assay (ELISA) ... 23
2.9.1 Capture ELISA for assessment of IFN-γ in co-culture supernatants ... 24
2.10 Experiment to test the link between PEMs and CD8+ cells ... 25
xiv
3.1 Screening of HLA-A02 positive donors ... 27
3.2 Efficacy of CD8+ T cells isolation ... 28
3.3 Analysis of 24 hours genetic expression of IFN-γ by T cells ... 29
3.4 Analysis of 24 hours expression of IFN-γ protein by T cells... 31
3.5 Analysis of 72 hours genetic expression of IFN-γ by T cells ... 32
3.6 Analysis of 72 hours expression of IFN-γ protein by T cells... 35
3.7 Confirmation of the binding between PEMs and CD8 cells ... 37
4 Conclusion and Future Perspectives ... 45
5 References ... 47
xv
Index of Figures
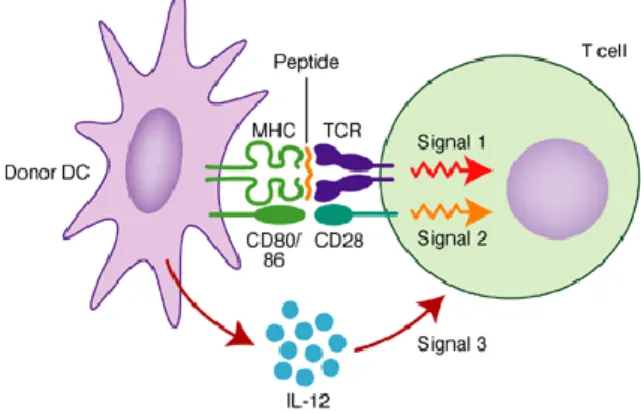
Figure 1.1 - Three signals for T cell activation. Interaction between dendritic cells and T
cells for T cell activation involves three signals. Signal 1 consists in the interaction between MHC containing peptide fragments on DC and the TCR on the T cell. Signal 2 is provided by the interaction between co-stimulatory molecules on DC surface and their receptors on T cell surface. Signal 3 occur when DC secrete IL-12. Adapted from [25]. ... 4
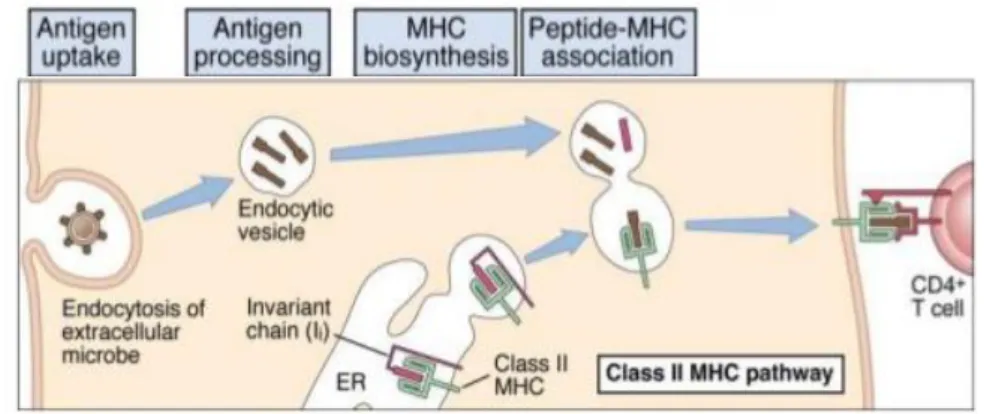
Figure 1.2 – MHC II/Endocytic pathway for intracellular processing of proteins antigens. Protein antigens found in endocytic vesicles are converted into peptides that bind to
MCH II molecules for recognition by CD4+ T cells. Adapted from [5] ... 6
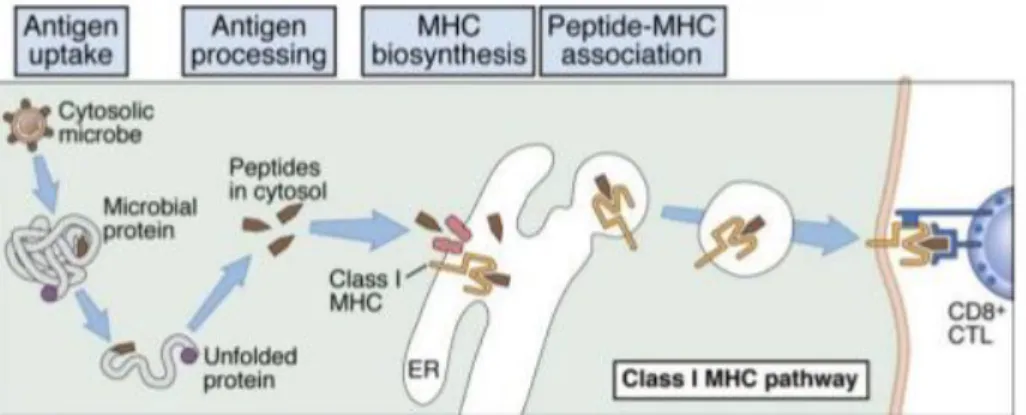
Figure 1.3 – MHC I/Cytosolic pathway for intracellular processing of proteins antigens.
Cytosolic proteins are converted into peptides that bind to MHC I molecules to be recognize by CD8+ T cells. Adapted from [5] ... 7
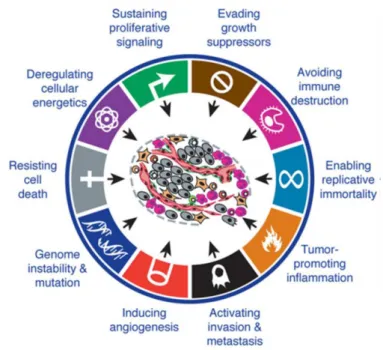
Figure 1.4 – Hallmarks of Cancer. Functional capabilities acquired by cancer during their
development. Adapted from [44] ... 8
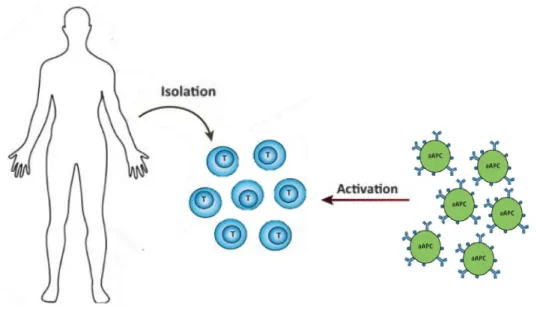
Figure 1.5 – One strategy of cancer immunotherapy. Activation of T cells isolated from
patients can be induced by aAPCs. Adapted from [50]. ... 13
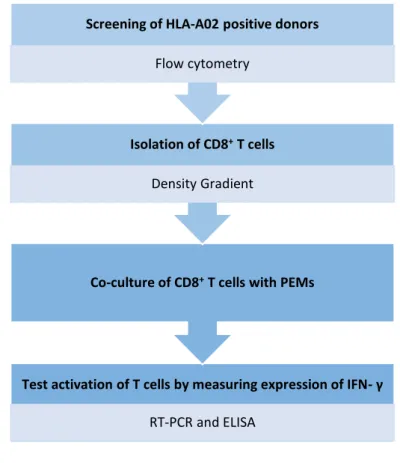
Figure 1.6 – Schematic resume of the aim of the thesis. Principal steps and respective
methods used. First step consists in screening of HLA-A02 positive donors by flow cytometry. Second step consists in the isolation of CD8+ T cells by density gradient and then co-culture of
the isolated cells with PEMs. Final step was testing the activation of T cells measuring the expression of IFN- by RT-PCR and ELISA. ... 14
Figure 2.1 – Strategy used to analyze if the donors tested were HLA-A02 positive or not. After flow cytometry acquisitions, a histogram graph of fluorescence channel vs count was
generated and if the peak of the cells (red) was equal to the peak of unstained cells (blue) the donor was HLA-A02 negative, as shown on the right side. Otherwise, if the peak (red) was displaced relatively to the peak of unstained cells (blue) the donor was HLA-A02 positive, as shown on the left side. ... 17
Figure 2.2 – Gating strategy to evaluate the efficacy of gradient density isolation method. Cells isolated were marked with anti-CD3 APC and anti-CD8 PerCp. Double marked
cells correspond to CD8+ T cells in Q2 quadrant ... 19
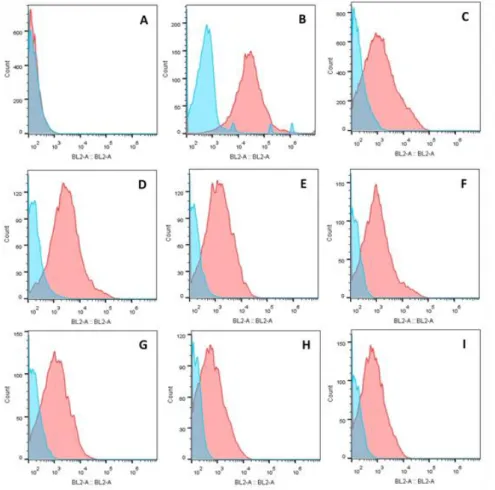
Figure 3.1 - Screening of HLA-A02 donor by flow cytometry. On the histograms the yy
axis represent the number of events and the xx axis represents the fluorescence intensity on the BL2 channel. In blue are represented the unstained cells and in red the cells stained with HLA-A02 PE. A – Two histogramss (blue and red) are overlapped, representing a HLA-HLA-A02 negative donor. B,C,D,E,F,G,H,I – The two histograms that are not overlapped being the red peak (stained cells) moved to the right. These represent HLA-A02 positive donors. ... 27
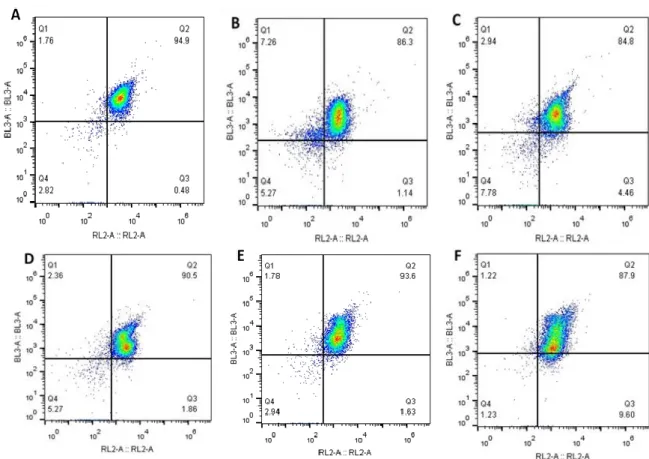
Figure 3.2 – Percentage of CD8+ T cells isolated from each from donors A,B,C,D,E and F. CD8+ T cells appear on Q2 quadrant since cells isolated were stained with two markers (CD3
APC and CD8 PerCp) to distinguish CD8+ T cells. On Q2 quadrant appear the double stained
cells, so the CD8+ T cells. A – Cells isolated from donor A, being 94.9% of the cells isolated CD8+
T cells. B – Cells isolated from donor B, being 86.3% of the cells CD8+ T cells. C – Cells isolated
from donor C. 84.8% of isolated cells were CD8+ T cells. D – Cells isolated from donor D. 90.5%
were CD8+ T cells. E – Cells isolated from donor E, being 93.6% of the cells CD8+ T cells. F -
Cell– isolated from donor F. 87.9% of the cells isolated were CD8+ T cells. ... 28
Figure 3.3 – Genetic expression of IFN-γ measured by RT-PCR in the cells recovered from co-cultures experiments at 24 hours. In the graphs, it is shown the relative mRNA
expression of IFN-γ gene. The yy axis represents the relative mRNA levels and the xx axis represents the different conditions studied. CD8 – CD8+ T cells were cultured alone.
CD8+PMA+ION – CD8+ T cells were stimulated with PMA and Ionomycin (positive control).
CD8+PEMs – CD8+ T cells were co-cultured with PEMs (microcapsules). CD8+PEMs+HLA –
CD8+ T cells were put in culture with PEMs linked to HLA-A02 molecules without any peptide.
CD8+PEMs+HLA+NV9 – CD8+ T cells were co-cultured with PEMs linked to HLA-A02 molecules
complexed with NV9 peptide (CMV peptide). CD8+PEMs+HLA+IV9 – CD8+ T cells were cultured
with PEMs linked to HLA-A02 molecules complexed with the IV9 peptide (HIV peptide – irrelevant control). A - Relative mRNA expression of IFN-γ of donor A. B - Relative mRNA expression of
xvi IFN-γ of donor B. C - Relative mRNA expression of IFN-γ of donor C. D - Relative mRNA expression of IFN-γ of donor D. ... 30
Figure 3.4 – Expression of IFN-γ measured by ELISA in the supernatants recovered from co-cultures experiments at 24 hours. In the graphs it is shown the concentration (pg/mL)
of IFN-γ. The yy axis represents the concentration in pg/mL of IFN-γ in the supernatants and the xx axis represents the different conditions studied. CD8 – CD8+ T cells were cultured alone.
CD8+PMA+ION – CD8+ T cells were stimulated with PMA and Ionomycin (positive control).
CD8+PEMs – CD8+ T cells were co-cultured with PEMs (microcapsules). CD8+PEMs+HLA –
CD8+ T cells were put in culture with PEMs linked to HLA-A02 molecules without any peptide.
CD8+PEMs+HLA+NV9 – CD8+ T cells were co-cultured with PEMs linked to HLA-A02 molecules
complexed with NV9 peptide (CMV peptide). CD8+PEMs+HLA+IV9 – CD8+ T cells were cultured
with PEMs linked to HLA-A02 molecules complexed with the IV9 peptide (HIV peptide – irrelevant control). A – Concentration of IFN-γ on supernatants from donor A. B - Concentration of IFN-γ on supernatants from donor B. C - Concentration of IFN-γ on supernatants from donor C. D - Concentration of IFN-γ on supernatants from donor D. ... 32
Figure 3.5 - Genetic expression of IFN-γ measured by RT-PCR in the cells recovered from co-cultures experiments at 72 hours. In the graphs it is shown the relative mRNA
expression of IFN-γ gene. The yy axis represents the relative mRNA levels and the xx axis represents the different conditions studied. CD8 – CD8+ T cells were cultured alone.
CD8+PMA+ION – CD8+ T cells were stimulated with PMA and Ionomycin (positive control).
CD8+PEMs – CD8+ T cells were co-cultured with PEMs (microcapsules). CD8+PEMs+HLA –
CD8+ T cells were put in culture with PEMs linked to HLA-A02 molecules without any peptide.
CD8+PEMs+HLA+NV9 – CD8+ T cells were co-cultured with PEMs linked to HLA-A02 molecules
complexed with NV9 peptide (CMV peptide). CD8+PEMs+HLA+IV9 – CD8+ T cells were cultured
with PEMs linked to HLA-A02 molecules complexed with the IV9 peptide (HIV peptide – irrelevant control). A - Relative mRNA expression of IFN-γ of donor E. B - Relative mRNA expression of IFN-γ of donor F. C - Relative mRNA expression of IFN-γ of donor G. D - Relative mRNA expression of IFN-γ of donor H. E - Relative mRNA expression of IFN-γ of donor I. ... 33
Figure 3.6 - Expression of IFN-γ measured by ELISA in the supernatants recovered from co-cultures experiments at 72 hours. In the graphs it is shown the concentration (pg/mL)
of IFN-γ. The yy axis represents the concentration in pg/mL of IFN-γ in the supernatants and the xx axis represents the different conditions studied. CD8 – CD8+ T cells were cultured alone.
CD8+PMA+ION – CD8+ T cells were stimulated with PMA and Ionomycin (positive control).
CD8+PEMs – CD8+ T cells were co-cultured with PEMs (microcapsules). CD8+PEMs+HLA –
CD8+ T cells were put in culture with PEMs linked to HLA-A02 molecules without any peptide.
CD8+PEMs+HLA+NV9 – CD8+ T cells were co-cultured with PEMs linked to HLA-A02 molecules
complexed with NV9 peptide (CMV peptide). CD8+PEMs+HLA+IV9 – CD8+ T cells were cultured
with PEMs linked to HLA-A02 molecules complexed with the IV9 peptide (HIV peptide – irrelevant control). A – Concentration of IFN-γ on supernatants from donor E. B - Concentration of IFN-γ on supernatants from donor F. C - Concentration of IFN-γ on supernatants from donor G. D - Concentration of IFN-γ on supernatants from donor H. E - Concentration of IFN-γ on supernatants from donor I. ... 36
Figure 3.7 – Gate strategy used to test the binding between PEMs and CD8 T cells. A
– First, there were selected only the particles stained with anti-CD8 PE. B – From anti-CD8 PE stained particles, there were selected only the doublets doing for that a FSC-A:FSC-H dot plot and selected the particles that were not in the diagonal. C-Finally the two fluorescences were intersected and the doublets double stained with biotin FITC and anti-CD8 PE correspond to PEMs binding with CD8+ cells. ... 37
Figure 3.8 – PEMs in the different conditions stained with biotin FITC and CD8 PE. A1
– PEMs stained with biotin FITC (red) and unstained cells (blue). A2 – PEMs stained with CD8 PE (purple) and unstained cells (blue). B1 – PEMs with HLA-A02 stained with biotin FITC (red) and unstained cells (blue). B2 - PEMs with HLA-A02 stained with CD8 PE (purple) and unstained cells (blue). C1 – PEMs with HLA-A02 complexed with NV9 peptide stained with biotin FITC (red) and unstained cells (blue). C2 - PEMs with HLA-A02 complexed with NV9 peptide stained with CD8 PE (purple) and unstained cells (blue). D1 – PEMs with HLA-A02 complexed with IV9 peptide
xvii stained with biotin FITC (red) and unstained cells (blue). D2 - PEMs with HLA-A02 complexed with IV9 peptide stained with CD8 PE (purple) and unstained cells (blue). ... 38
Figure 3.9 – Binding between PEMs and CD8 cells analyzed by flow cytometry. In Q2
quadrant are the doublets (PEMs+CD8) double stained with biotin FITC and CD8 PE. CD8+ T
cells used in co-culture were from donor G. A – Results from co-culture of PEMs (just the microcapsules) and CD8+ cells. B – Results from co-culture of PEMs with HLA-A02 with CD8+
cells. C- Results from co-culture of PEMs with HLA-A02 complexed with NV9 peptide with CD8+
cells. D - Results from co-culture of PEMs with HLA-A02 complexed with IV9 peptide with CD8+
cells. ... 40
Figure 3.10 - Binding between PEMs and CD8 cells analyzed by flow cytometry. In Q2
quadrant are the doublets (PEMs+CD8) double stained with biotin FITC and CD8 PE. CD8+ T
cells used in co-culture were from donor I. A – Results from co-culture of PEMs (just the microcapsules) and CD8+ cells. B – Results from co-culture of PEMs with HLA-A02 with CD8+
cells. C- Results from co-culture of PEMs with HLA-A02 complexed with NV9 peptide with CD8+
cells. D - Results from co-culture of PEMs with HLA-A02 complexed with IV9 peptide with CD8+
cells. ... 41
Figure 3.11 - Binding between PEMs and CD8 cells analyzed by flow cytometry. In Q2
quadrant are the doublets (PEMs+CD8) double stained with biotin FITC and CD8 PE. CD8+ T
cells used in co-culture were from donor H. A – Results from co-culture of PEMs (just the microcapsules) and CD8+ cells. B – Results from co-culture of PEMs with HLA-A02 with CD8+
cells. C- Results from co-culture of PEMs with HLA-A02 complexed with NV9 peptide with CD8+
cells. D - Results from co-culture of PEMs with HLA-A02 complexed with IV9 peptide with CD8+
xix
Index of Tables
Table 2.1 – Conditions tested in the experiments. ... 20
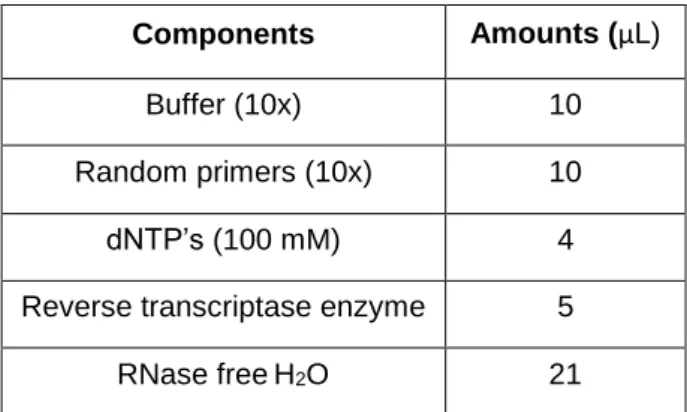
Table 2.2 – Components of conversion mix and respective amounts (μL) ... 22
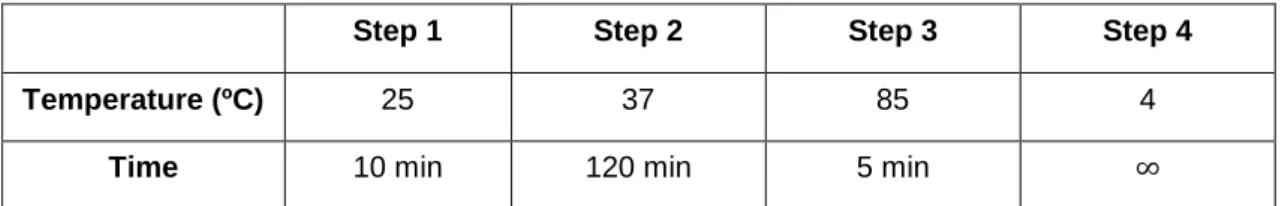
Table 2.3 – Settings of the used program to cDNA conversion ... 23
xxi
List of Abbreviations
aAPC's Artificial antigen presenting cells ALP Alkaline phosphatase
APC Allophycocyanin
APCs Antigen presenting cells CAR Chimeric antigen receptor cDNA
CLIP
Complementary deoxyribonucleic acid Class II-associated invariant chain peptide
CMV Cytomegalovirus Ct
CTLA 4
Threshold cycle
Cytotoxic T lymphocyte associated antigen 4
DCs Dendritic cells
DNA Deoxyribonucleic acid DNase deoxyribonuclease
dNTP Deoxynucleoside triphosphate
EDC 1-Ethyl-3-(3-dimethylaminopropyl) carbodiimid ELISA Enzyme-Linked Immunosorbent Assay
ER Endoplasmic reticulum FBS Fetal bovine serum
FITC Fluorescein isothiocyanate
FRET Fluorescence resonance energy transfer GADPH Glyceraldehyde-3-phosphate dehydrogenase
HCl Hydrochloric acid
HIV Human immunodeficiency virus HLA Human leukocyte antigen HRP
HTLV
Horseradish peroxidase Human T-lymphotropic virus
IFN Interferon IL
Ion
Interleukin Ionomycin
IPST Instituto Português do Sangue e da Transplantação LPS Lipopolysaccharide
xxii
MHC Major histocompatibility complex MHC I Major histocompatibility complex, class I MHC II Major histocompatibility complex, class II mRNA Messenger ribonucleic acid
NK Natural killer
PAA Poly(acrylic acid) sodium salt PAH Poly(allylamine hydrochloride)
PAMPs Pathogen-Associated Molecular Patterns PBMCs Peripheral blood mononuclear cells
PBS Phosphate buffered saline PCR Polymerase chain reaction
PE Phycoerythrin
PEMs Polyelectrolyte microcapsules PerCp Peridinin chlorophyll protein complex
PLGA Poly(lactic-co-glycolic acid) PMA Phorbol 12-myristate 13-acetate PRR Pattern-Recognition Receptors qPCR quantitative PCR
RNA Ribonucleic acid RNase
RPMI
Ribonuclease
Roswell Park Memorial Institute
RT-PCR Reverse transcriptase polymerase chain reaction Sulfo-NHS Sulfo N-Hydroxysuccinimide
TAP Transporter associated with antigen processing TCR T cell receptor
TLRs Toll-like receptors
TMB 3,3',5,5'-tetramethylbenzidine TNF Tumor necrosis factor
1
1 Introduction
1.1
Immunity, immune system and immunology
Immunity is defined as resistance to diseases, more specifically to infectious diseases [1]. The immune system involves many organs, molecules, cells and pathways in interconnected processes and has evolved as the host’s defense, to protect multicellular organisms from pathogens and cancer [2], [3].
Immunology is the study of the immune system and the responses to the invading pathogens microorganisms. The reaction of the components of the immune system against infectious microorganisms is known as the immunologic response [1].
In vertebrates the immunologic defenses are divided into two immunologic subsystems – the innate and adaptative immune responses [4].
1.1.1 Innate immunity
Innate immunity is the first line of defense and it is found in all multicellular plants and animals [5]. It works rapidly (in some hours) against the infectious insult and gives rise to the acute inflammatory response. When a host is attacked by a pathogen it is the innate immune system that responds with immediate action. In the innate immune system are included the epithelial barriers, specialized cells and natural antibiotics that block the entry of the microorganisms in the epithelia [2]. In the tissues or in the circulation, the microorganisms are destroyed by the phagocytes (macrophages and neutrophils), the natural killer (NK) cells and also plasmatic proteins, where the complement system is included. This type of immunity has some specificity for microbes but no memory [5], [6].
The innate immune system recognizes the pathogens through pattern-recognition receptors (PRR). These receptors identify particular types of molecules that are common to many pathogens, known as pathogen-associated molecular patterns (PAMPs), that do not exist in the host [7], [8]. The lipopolysaccharide (LPS), a component of the Gram-negative bacteria cell wall (recognized by the toll-like receptor 4 (TLR-4)) and the teichoic acids on Gram-positive bacteria are examples of PAMPs [8], [9]. Different PRR recognize specific PAMPs which will activate specific signaling pathways leading to different responses against pathogens [7], [8].
1.1.2 Adaptive immunity
In addition to the innate immune responses, vertebrates also have an adaptive immunity. The adaptive immune responses are the second line of defense and are highly specific to a particular antigen [10]. This type of immunity takes more time to be effective, usually days, since the organism is first exposed to the antigen, but provides long-lasting protection mediated by cells and molecules forming the immunologic memory. Innate immune responses are responsible for
2 activating adaptive immunity and together they work in order to eliminate the foreign molecules. B and T lymphocytes are white blood cells that are responsible for the adaptive immune responses. There are two types of adaptive immunity, the humoral responses and the cell-mediated immune responses [10]–[12].
B cells are involved in the humoral responses. In this type of response, B cells are activated and differentiate into plasma cells, producing antibodies, which are proteins that will destruct microorganisms in extracellular spaces. Activation of B cells is stimulated by specific soluble antigens, and the antibodies produced specific for that antigens. The antibodies binds to the pathogens blocking them or mark them for destruction that is carried out mostly by phagocytic cells [10][13].
T cells are responsible for cell-mediated immune responses. T cells are activated when antigen presenting cells (APCs) present the antigen to the T cell in the context of major histocompatibility complex (MHC). Dendritic cells are professional APCs which ingest the antigens and then present them. Activated T cells can destroy directly the infected cells (effector T cells) or they can produce molecules that will activate macrophages and promote the phagocytosis (helper T cells) [10][14].
1.1.3 T cells
Lymphocytes are developed in lymphoid organs. T lymphocytes are derived from stem cells in the bone marrow but their development occurs mainly in the thymus. The immature T cells derived from bone marrow migrate towards the thymus where maturation takes place. Interactions between immature T cells and thymic stromal cells lead to the differentiation and posterior proliferation of T cells. The development of T cells occurs in different phases and in each phase occurs changes at T cell receptor (TCR) genes and expression levels. [15][16]
TCR is a disulfide-linked heterodimeric protein that is attached to the membrane. These protein is typically constitute by a complex with two different parts. One part consisting of the highly variable α and β chains and the other part is constitute by the invariant CD3 chain molecules.[16]
Majority of T cells express the α and β chains (α:β T cells) but there is a minority that express an alternate receptor that is formed by variable chains γ and δ (γ:δ T cells). During TCR development occurs a specific process of gene recombination in somatic T cells. TCRα gene locus contains variable (V) and joining (J) gene segments and TCRβ contains, beside V and J segments, a D (diversity) gene segment. Therefore, α chain is generated from VJ recombination and β chain from VDJ recombination. In γ:δ TCRs the process is similar since VJ recombination is involved in γ and δ chain is generated from VDJ recombination. [17], [18]
During maturation, cell-surface proteins expression is altered, mainly involving the TCR (CD3) complex expression and CD4 and CD8 proteins. Mature T cells express a diverse of antigen specific receptors - T cell receptors, due to the rearrangement of the genes that encode
3 to the antigen receptors and the changes of expression that happen in cell-surface and intracellular proteins. [15]
In the last phase of development, α:β T cells originate two types of cells - CD4+ and CD8+ T
cells, which are functionally different. Cells where the rearrangements do not occur properly die by apoptosis.[16]
TCR recognize only antigens that are bound to MHC molecules in the surface of APCs. CD4+
T cells are called helper cells because they provide signals and cues to B lymphocytes in antibody productions and to phagocytic cells in their function. CD8+ T cells are named cytotoxic T cells
since they kill infected or aberrant cells. [1]
1.1.4 T cell activation
To activate T cells, three different signals are required. Signal 1 occurs when an APC presents an antigen on the surface bound to MHC molecules, to be recognized by the TCR. Furthermore, CD4 molecules on helper T cells and CD8 molecules on cytotoxic T cells will bind to MHC II and MHC I on APC, respectively. This selective recognition is termed MHC restriction. These interactions between TCR and peptide-MHC complexes and between CD4 or CD8 and MHC II and MCH I will induce a cascade of signaling from the cytosol to the nucleus. This cascade of events involves many interactions and modifications on proteins, such as phosphorylation and ubiquitination, interacting with many second messengers, like calcium and diacylglycerol. It is a fact that TCR recognize the antigens that allow a specific response. [19]–[22]
Signal 2 is co-stimulation, where the costimulatory molecules from APC bind to co-receptors on the surface of the T cells. If co-stimulation does not occur, T cells can recognize the antigen but they cannot respond and die or enter in a state of anergy (unresponsive state) [20]. The best known T cell costimulatory pathway involves the costimulatory molecules B7-1 (CD80) and B7-2 (CD86) expressed on APCs and the CD28 receptor expressed on T cells. Pathogens and cytokines enhance the expression of costimulatory molecules in the surface of APCs. Signal 1 and 2 promote the expansion of T cells which were stimulated, and their subsequent differentiation in effector and memory cells. CD28 receptor induce the production of cytokines, especially of interleukin-2 (IL2). These cytokines promote metabolism and up-regulation of cell-survival genes [20], [21], [23].
However, there are also signaling molecules driving inhibitory responses. Cytotoxic T lymphocyte associated antigen 4 (CTLA-4) is one of those molecules and it can bind to B7-1 and B7-2, since it is a homologue of CD28. CTLA-4 is a negative regulator of T cell activation while it is expressed in activated T cells. When expression of CTLA-4 is upregulated, the expression of CD28 is downregulated by endocytosis and CTLA-4 can bind to the costimulatory molecules on APC and inhibit the T cell responses, by blocking the production of IL-2 and the progression of cell-cycle [20], [23].
Also, the expression of costimulatory molecules B7-1 and B7-2 is regulated on the APCs being dependent of the activation state of the cell. Transcription, translation and trafficking of
B7-4 1 and B7-2 to the surface of APCs are enhanced by the recognition of infection and stress and cellular levels by innate receptors. This regulation is essential to prevent aberrant and autoreactive T cell responses allowing the responses against non-self antigens [20].
Signal 3 is provided by cytokines produced by macrophages and dendritic cells, and is required for the effective production of effector and memory cells as well as for the survival of T cells. The knowledge about this third signal of stimulation is recent and the cells that do not receive this signal do not develop cytolytic function and stay unresponsive. Cytokines that provide signal 3 are essentially IL-12, interferon (IFN)-α, IFN-β and IL-21 [20], [24]. Figure 1.1 illustrates the three signals needed for T cell activation.
Figure 1.1 - Three signals for T cell activation. Interaction between dendritic cells and T cells for T
cell activation involves three signals. Signal 1 consists in the interaction between MHC containing peptide fragments on DC and the TCR on the T cell. Signal 2 is provided by the interaction between co-stimulatory molecules on DC surface and their receptors on T cell surface. Signal 3 occur when DC secrete IL-12. Adapted from [25].
1.1.5 T cells differentiation after activation
After activation of T cells, they can differentiate essentially in two types: helper T cells (CD4) and cytotoxic T cells (CD8). Helper cells are responsible for production of cytokines, that activate other cells, and chemokines that recruit other cells to the place of infection. The main function of cytotoxic cells is the killing of pathogen infected cells by delivering cytotoxic granules in their cytosol. As there is a very diverse number of pathogens, the host produces different specialized T cells responses specific for the invading pathogen. Helper T cell responses are divided into different subsets depending on the pathogen, being the major ones Th1, Th2 and Th17 subsets. In the Th1 subset there is the production of large amounts of IFN-γ and tumor necrosis factor (TNF) α in response to intracellular pathogens such as virus. The Th2 subset is characterized by the production of large amounts of IL-4, IL-5 and IL-13 which will activate eosinophils, mast cells and basophils to eliminate parasites [26]. In order to eliminate extracellular bacteria and fungi, Th17 subset is activated and these cells produce IL-17. This cytokine is responsible for the activation of neutrophils which have the ability to kill bacteria and fungi [27]. Cytotoxic T cells are responsible for elimination of intracellular pathogens and cancer cells and they are activated after
5 they recognize their antigens in the presence of cytokines (IFN-α, IFN-β and IL-12). After activation cytotoxic T cells produce large amounts of IFN-γ, TNF-α and secretory vesicles that contain perforin and granzyme proteins that have the ability to kill the other cells and disseminate close to them [21].
1.1.6 Antigen presenting cells (APCs)
APCs are cells that are able to capture antigens, process them into peptides and present them to lymphocytes to activate them. DCs, macrophages and B cells present antigens mainly to T cells and are considered professional APCs since they express MHC II and co-stimulatory molecules [28]. However, there are other cells that can also present antigens such as thymic epithelial cells and vascular endothelial cells. In the lymph nodes, follicular dendritic cells act as APCs for B cells. APCs present antigens in form of peptide-MHC complexes. To present antigens to a CD4+ T cell, the presentation is made in association with MHC II. If an antigen is to be
presented to CD8+ T cells, APCs do it via MHC I [28], [29].
DCs are the most potent because are the only APCs capable of activating naïve T cells, and also because they can present antigens either via class I or class II MHC molecules activating CD4+ and CD8+ T cells. [30] They also present a constitutive expression of B7 co-stimulatory
molecules. Costimulatory molecules are essential to a properly activation of T cells as mentioned before. [28]
DCs capture antigens that invade the organism by phagocytosis, micropinocytosis or endocytosis[3]. DCs reside in certain areas of epithelial tissues and express receptors that bind directly to microorganisms and mannose residues on glycoproteins (bacterial characteristic). After recognition, the antigens are mainly captured by endocytosis. Besides endocytosis, antigens can bind also to TLRs on DCs and macrophages, enhancing the production of TNF and IL-1. Altogether, these factors contribute to activate DCs, inducing their migration towards lymph nodes in response to chemokines. In the lymph nodes, they can activate T cells. During migration DCs become mature and start to express costimulatory molecules and MHC molecules in a stable way [28], [31].
1.1.6.1
Antigen Processing and Presentation
To activate T cells, antigens need to be presented by APCs in form of peptides-MHC complexes or lipid-CD1 molecules complexes. In humans, MHC is designated by human leukocyte antigen (HLA). APCs express MHC II in their native state, while MHC I is expressed in all nucleated cells (including APCs). There are two major pathways responsible for the processing and presentation of antigens. One of the pathways is related to processing extracellularly-derived proteins (exogenous), presenting them via MHC II , while the other pathwaypresents cytosolic proteins (endogenous) via MHC I. [32]
6 However, DCs are also capable of process and present extracellular antigens via MHC I through cross-presentation. There are two main intracellular pathways for cross-presentation.[33] Cytosolic pathway involves the uptake of exogenous antigens and their transport from endosomal vesicles into the cytosol. In the cytosol, antigens are degraded by the proteasome and then transported by a transporter associated with antigen processing (TAP) into the endoplasmic reticulum (ER) where they are loaded on MHC I molecules.[34]–[36]
Vacuolar pathway is independent of proteasome since capture antigens are processed by endosomal proteases and load on MHC I in endosomal compartments. [34]–[36]
1.1.6.2
MHC II/Endocytic Pathway
Endocytic pathway (Figure 1.2) is responsible for processing the proteins that enter in the cell by endocytosis, phagocytosis or pinocytosis. These proteins are internalized in phagosomes, that fuse with lysosomes creating phagolysosomes where proteins are processed by proteolytic enzymes. This enzymatic cleavage generates a diverse array of peptides. [37]
MHC II molecules synthesized in the ER have the peptide-binding site blocked by the invariant chain (li). After synthesis, MHC II molecules are secreted in vesicles that posterior will fuse with the phagolysosomes where the peptides were processed. There the invariant chain is broken leaving only a small fragment called class II-associated invariant chain peptide (CLIP) that blocks the peptide-binding site. Then CLIP is removed by an MHC II-like structure and MHC II can bind to the peptides and migrate into exocytic vesicles to the cell surface in order to present the antigen to CD4 cells.[32], [38]
Figure 1.2 - MHC II/Endocytic pathway for intracellular processing of proteins antigens. Protein
antigens found in endocytic vesicles are converted into peptides that bind to MCH II molecules for recognition by CD4+ T cells. Adapted from [5]
1.1.6.3
MHC I/Cytosolic Pathway
The cytosolic pathway (Figure 1.3) is responsible for processing proteins generated in the cytosol, such as viral proteins in infected cells or native proteins from the cell that are aberrantly synthesized or no longer needed. All these proteins are ubiquitinated and degraded in the
7 proteasome and then translocated by TAP from the cytosol to the ER, where they are combined with MHC I molecules.[39]
MHC I molecules, synthesized in the ER, are constitute by a polymorphic heavy chain and a chain called β2-microglobulin. In the ER, MHC I molecules without peptides are stabilized by chaperone proteins and the association of MHC I/β2-m heterodimers. When the right peptide finds the right MHC I, they form a non-covalent complex and MHC I becomes stable. The complex peptide-MHC I then migrates to the cell surface through the trans-Golgi network in order to present the antigen to CD8+ cells [32], [38]
Figure 1.3 - MHC I/Cytosolic pathway for intracellular processing of proteins antigens. Cytosolic
proteins are converted into peptides that bind to MHC I molecules to be recognize by CD8+ T cells. Adapted from [5]
1.2
Cancer
Cancer is one of the leading causes of death worldwide along with cardiovascular, chronic lower respiratory and neurodegenerative diseases and diabetes [40]. In general, 1 in 6 deaths are caused by cancer and it is expected that in the next two decades the number of new cases will increase by about 70%. Neoplasms of lung, liver, colorectal, stomach and breast are the most common [41]. Cancer results from genomic modifications in normal cells that turn them into tumor cells. These alterations consist on the accumulation of somatic mutations that lead to uncontrolled growth and proliferation of the mutated cells. Some of these alterations are related to the interaction between genetic factors and external factors, which include physical carcinogens (e.g. ultraviolet and ionizing radiation), chemical carcinogens (e.g. aflatoxin and arsenic) and biological carcinogens (e.g. infections by certain viruses, bacteria or parasites). More common mutations that lead to cancer are those that occur in genes responsible for deoxyribonucleic acid (DNA) repair, in proto-oncogenes and tumor suppressor genes. Mutations in proto-oncogenes lead to production of oncogenes with dominant gain of function and mutations in tumor suppressor genes lead to a recessive loss of function [40]–[42].
All these changes can occur in any cell of the body, leading to different types of cancer. Each neoplasm has a different behavior and that’s why each type responds differently to treatments.
8 Tumor growth can be benign or malignant. In general, benign tumors remain confined to their original location; otherwise, in malignant tumors, abnormal cells can invade surrounding normal tissues and also spread to other organs via circulatory or lymphatic systems in a process called metastasization, being metastases the major cause of death from cancer [41].
Depending on the type of cell from which tumors arise they are classified into: carcinomas, originating from epithelial cells; sarcomas, that arise from connective tissues and are relatively rare in humans; leukemias that arise from blood forming cells and lymphomas that arise from immune system cells [42], [43].
Tumors consist of complex tissues formed by multiple distinct cell types that interact between themselves. Cancer cells and the tumor microenvironment contribute to many of the hallmark capabilities that tumors present. Cancer hallmarks (Figure 1.4) consist of acquired capabilities of cancer cells that allow them to survive and proliferate. Cancer cells can be self-sufficient in growth signals and insensitive to anti-growth signals because many cell survival and proliferation signaling pathways are deregulated, thus allowing cancer cells to maintain a chronic proliferation. These cells can avoid apoptosis may present a limitless replicative potential due to their ability to maintain telomeric DNA at lengths that avoid apoptosis. Angiogenesis, tissue invasion and metastasis are also typical abilities of tumor cells. Angiogenesis is triggered by hypoxia and allows cancer cells to obtain nutrients and oxygen. Other hallmarks may consist on evading the immune system through genetic and epigenetic modifications and reprograming energetic metabolism pathways, which is related to the fact that tumor cells can limit their energy metabolism to glycolysis even in the presence of oxygen leading to a state of aerobic glycolysis (Warburg effect) [44], [45].
Figure 1.4 - Hallmarks of Cancer. Functional capabilities acquired by cancer during their
9
1.2.1 Cancer treatment
There are many types of treatment options for cancer patients and the treatment that each patient receives is related to the type of cancer and how advanced it is. Most of cancer patients receive a combination of treatments. Currently, combination of surgery with chemotherapy and/or radiotherapy is the most common treatment regime. Surgery is considered the best procedure for solid tumors that are confined to a specific area [46]. With surgery, it is possible to remove the entire tumor in some cases. In other cases, when the removal of the entire tumor can cause damage in an organ, the tumor should be debulked, which means that part of the tumor, but not all, is removed. Sometimes, surgery is only used to remove tumors that are causing pain to the patients [46]
Radiotherapy uses high doses of radiation to kill cancer cells and chemotherapy uses drugs to kill cancer cells. Radiotherapy and chemotherapy not only kill cancer cells, but these therapies also have the potential to kill healthy cells. This causes side effects like nausea, hair loss and mouth sores [47].
More recently, new and more specific therapies have been developed, such as immunotherapy, targeted therapy, hormone therapy and stem cell transplant. Immunotherapy is a biological therapy in which substances made from living organisms (or cells itself) are used to treat cancer. In immunotherapy, the host immune system is helped to fight cancer. Immunotherapies include the ones where cancer cells are marked to be easier for the immune system to find and kill them, usually by antibodies, and the ones where the immune system is boosted to be easier the fight against cancer. Targeted therapy consists of the design of essentially small molecule drugs or monoclonal antibodies which will target the changes in cells that lead to cancer and block their effects. Hormone therapy uses hormones in order to slow down or stop cancer from progressing. This type of therapy is essentialy used in prostate and breast cancers since they are hormone-sensitive to grow. In patients who receive systemic chemotherapy or radiotherapy to treat cancers, the blood cells are usually destroyed. In this case, a stem cell transplant can be performed in order to restore blood-forming stem cells, since all types of blood cells are important to the health of the organism. [47]
1.2.2 Cancer immunotherapy
Cancer immunotherapy involves the use of components of the immune system in order to treat cancer patients. Immunotherapy against cancer has the purpose to kill cancer cells by activating the immune system against these cells either passively or actively. Passive immunotherapy is related to, for example, monoclonal antibodies which are designed to recognize specific targets expressed by the tumor cells or existing in the tumor microenvironment. In this type of therapy, there is a higher specificity and off-target toxicities can be avoided. In contrast, active immunotherapy is related to the stimulation of immune cells to fight cancer. In this case, immune cells, especially T cells and B cells, are stimulated for a specific antigen. In fact, the knowledge that T cells are able to recognize specifically cancer cells and kill them is exploited in
10 this case. Accordingly, it is possible to produce a large number of activated T cells specifically against tumor antigens, eliciting the elimination of cancer cells. Adoptive T cell transfer is based on the same scheme: T cells isolated from cancer patients are stimulated with tumor antigens and expanded ex vivo, for later reinfusion into patients. After reinfusion, T cells will respond to cancer cells by killing them [48][49].
Chimeric antigen receptor (CAR) T-cell therapy is one specific type of adoptive T cell transfer therapy with leading results in the field and tested in small clinical trials. In this particular therapy, white blood cells are removed from patients and then T cells are separated and genetically modified. The modification consists of the addition of the specific CAR which will recognize a specific tumor antigen. After expansion of CAR T-cells, they are reintroduced into patients, specifically targeting cancer cells [49].
Cytokines, especially interferons and interleukins, are also used to treat cancer. These molecules are produced by the host own cells and have a key role in normal immune responses and in the response of the immune system against cancer [48].
Treatment vaccines against cancer are other type of immunotherapy. In this case there is a boost of the immune systems in order to respond to cancer cells [48].
One type of anti-tumor therapeutic vaccines is the one where patients are vaccinated with DCs, expanded and activated ex vivo, promoting and improving the activation of T cells. Since this process is expensive and time consuming, and the DCs generated can present a variable quality, other methods to activate T cells are starting to appear in the experimental setting. Artificial antigen presenting cells (aAPCs) are a new method that has been used to activate specifically T cells against tumor antigens either ex vivo or in vivo [50].
1.3
Artificial antigen presenting cells (aAPCs)
aAPCs are engineered systems for activation and expansion of T cells, mimicking the role of DCs. These systems include engineered cells or synthesized biomaterials and they have the advantage of being more controlled and reproducible [50], [51]. However it is very important to consider some variables when aAPCs are designed. These variables include the size, shape, mechanism for cytokine delivery and ligand distribution, mobility and positioning on aAPCs. All these factors will influence T cell activation. Most aAPCs are spherical particles which may be a disadvantage since DCs (natural APCs) are not spherical and for that reason have a bigger contact area with T cells than aAPCs.
The use of aAPCs has become a successful tool in immunology and clinical applications, especially the ones made with biomaterials which generate anti-tumor immune responses both in vitro and in vivo. Some advantages of these systems are the fact that they are not time-consuming in manufacture or preparation and they do not need expensive cell-culture strategies.[50], [52]
In these type of systems, the three signals that are needed for T cell activation are mimetized usually using agonist molecules. For example, signal 1 is provided by TCR agonists, such as recombinant peptide-MHC complexes or antibodies that are directed to CD3. Signal 2 is
co-11 stimulation and it is provided by co-stimulatory agonists, for example anti-CD28 monoclonal antibodies. Cytokines are responsible for signal 3 and they play an important role in T cell expansion and differentiation. IL-2 is the cytokine most commonly used to guarantee signal 3 since it is the best known for the survival of CD8+ T cells. However, there are other cytokines that
can promote, even better, expansion and differentiation of T cells. In these group of cytokines are included IL-7, IL-15 and IL-21.[53], [54]
Currently, there are some clinical trials where aAPCs have been tested. For example, anti-CD3/anti-CD28-coated magnetic beads, a type of aAPCs, have been applied in Phase I clinical trials. These aAPCs were tested in patients with metastatic breast cancer, chronic myeloid leukemia and carcinomas. These trials showed, in some cases, tumor regression or even complete remission but also showed a risk of developing graft versus host disease or non-tumor-specific cytotoxicity [50].
Silica microspheres containing peptide-MHC I complexes or tumor cell membranes were tested first in mice where they induced regression of tumors in combination with chemotherapeutic agent cyclophosphamide. In Phase I and II clinical trials these aAPCs were tested in patients with melanoma and renal cell carcinoma. It was observed a variable success where partial responses were induced, in some cases [50].
1.3.1 Cell Based aAPCs
There are aAPCs based on xenogenic or allogenic cells genetically modified, such as Drosophila cells, murine fibroblasts and human erythroleukemia cells (K562) [55]. These cellular-aAPCs present several advantages, since these are stable cell lines that can be easily handled, stored for long periods and easily obtained. Cells used in this system are also better defined than DCs, which allows a more controlled system. The biggest disadvantage is related with the allogenic nature of cells.[50], [55]
To be used as aAPCs, cells are engineered by transduction with retroviral or lentiviral vectors. Transduction allows introduction of necessary molecules needed for the immune synapse formation, such as TCR, costimulatory and adhesion molecules. Besides these, cytokines can be introduced in culture medium or produced by cellular-aAPCs.[55], [56]
1.3.2 Synthetic/Acellular aAPCs
Acellular aAPCs are relatively easy to prepare, provide a more stringent control when compared to cellular aAPCs and can be nonspecific or antigen-specific because they can activate T cells either presenting T cell activating antibodies, such as anti-CD3, or presenting specific peptide-MHC complexes. Most of aAPCs approaches use MHC stimulation for CD8+ T cells
activation, since these cells have antigen specific tumor cell lysis ability. There are some properties of aAPCs that will influence T cell activation. Size, shape, distribution of ligands in the
12 surface and ligand mobilities are some of those properties. Therefore, many types of aAPCs have been developed in order to understand which ones are better to mimic DCs.[50], [52]
Currently there are many systems of synthetic aAPCs being developed. These systems are based on synthetic and biomimetic biomaterials and they present applications in immunotherapy either ex vivo and in vivo.[53]
Liposomes, RAFTsomes and microdomain liposomes are lipid based aAPCs which are particles with a lipid bilayer and a fluid membrane. Liposomes containing MHC were developed by Prakken et al., and were able to activate CD4+ T cells in vitro [57]. Ding et al. developed the
RAFTsomes which are liposomes containing pre-clustered peptide-MHC complexes on membrane microdomains. These ones were capable of promoting CD4+ T cell proliferation [58].
Giannoni et al. described other systems based on artificial membrane bilayers containing T cell ligands membrane microdomains [59]. Since liposomes are poorly stable, some scaffolds started to be used. These scaffolds have as main function to support the lipid bilayers and improve the advantages of using these systems as aAPCs. Lipid bilayers were constructed on Poly(lactic-co-glycolic acid) (PLGA), silica or core of hydrogel.[53]
Polymeric aAPCs are another type of aAPCs that are made from polymers. The most common used polymers PLGA, sepharose or polystyrene beads. The polymeric particles present immunomodulatory compounds (anti-CD3, anti-CD28, peptide-MHC complexes) on the surface and can release gradually the IL-2 or other soluble molecules that were encapsulated inside. In this case, the optimal size of microbeads was between 4 to 5 μm. [50]
Since natural APCs are not spherical and the shape is a very important parameter for T cell activation, there were also designed non-spherical microparticles. Ellipsoid PLGA microparticles made using film-stretching technologies are one of these examples. Like this, it is possible to better mimic what happens in vivo. [50], [53]
Carbon nanotube bundles, other type of aAPC, are functionalized nanotubes coated with anti-CD3 that seem to be grouped into large aggregates with a high surface area which contribute to a better T cell activation. [53]
Nanoworms are aAPCs that combine two important aspects, membrane fluidity and shape, to access better results. For this, semi-flexible filamentous polymers are used to form the nanoworms that, then, can be decorated with antigen presenting and co-stimulatory molecules.[50]
There are also aAPCs that contain magnetic parts. Levine et al. describe magnetic beads linked to anti-CD3 and anti-CD28 antibodies. These beads were applied in clinical trials as a potential treatment for different types of cancers. [53]
1.3.3 Polyelectrolyte Microcapsules (PEMs)
Polyelectrolyte Microcapsules (PEMs) are a type of synthetic aAPCs that were produced at Sebastian Springer’s laboratory in Jacobs University at Bremen, Germany and their performance was tested in the context of this thesis.
13 PEMs are carbon microcapsules that were produced using calcium carbonate particles with 5-6 μm of size. The calcium carbonate particles were coated with two layers of PAH (Poly(allylamine hydrochloride)) and PAA (Poly(acrylic acid) sodium salt) in alteration. After that, the –COOH groups on the microcapsules were activated with EDC (1-Ethyl-3-(3-dimethylaminopropyl) carbodiimid) and Sulfo-NHS (Sulfo N-Hydroxysuccinimide) and the streptavidin molecules were added in order to coat the PEMs [60].
1.4
Aim of Thesis
Cancer vaccines are one type of immunotherapy, especially vaccines of DCs. More recently, aAPCs have been developed in order to increase the safety and efficacy of treatment. In the last case, aAPCs are used to expand and activate T cells against specific tumor antigens.
The main aim of this thesis is to test a new generation of aAPCs and to study their potential to activate T cells in vitro (Figure 1.5). aAPCs tested in this thesis were microcapsules made and assembled by researchers at the Jacobs University and named PEMs.
Figure 1.5 - One strategy of cancer immunotherapy. Activation of T cells isolated from patients can
be induced by aAPCs. Adapted from [50].
PEMs microcapsules have a carbonate core and are coated with streptavidin molecules. In addition to PEMs, three types of A02 molecules biotinylated were used in this thesis: HLA-A02 molecules with no peptide (empty), with NV9 peptide, which is a peptide derived from cytomegalovirus (CMV), and also HLA-A02 molecules with IV9 peptide, a peptide derived from proteins of the human immunodeficiency virus (HIV). Since HLA-A02 molecules were biotinylated and PEMs were coated with streptavidin it was possible to bind the two components by a streptavidin-biotin reaction.
HLA-A02 molecules were used as a model because this allele is one of the most prevalent in the population. The CMV peptide was chosen as the peptide of interest since 60% to 90% of the adults have suffered a CMV infection at some point in their life [61]. The HIV peptide was
14 chosen as peptide of control since the cells used in the tests were from healthy donors tested for HIV.
In order to test the capacity of PEMs to activate T cells, co-cultures of CD8+ T cells and
PEMs were made. Since all of the technical system was optimized with HLA-A02 molecules, the T cells used in co-cultures had to be T cells isolated from HLA-A02 positive donors. The first step was to perform a screening of HLA-A02 positive donors by flow cytometry. After that, T cells were isolated from positive donors by a density gradient in Biocoll. To test if PEMs were capable to activate T cells, the co-cultures were maintained for different time points. To test the activation of T cells the expression of IFN-γ was evaluated at transcriptional and protein level.
Since PEMs technology use CMV peptide as peptide of interest, only the CD8+ T cells from
donors previously infected with CMV and with lymphocytes responsive to CMV will produce IFN-γ in response to the stimulus. Figure 1.6 represent a schematic resume of the principal steps and methods used in this thesis to achieve the aim.
Figure 1.6 - Schematic resume of the aim of the thesis. Principal steps and respective methods
used. First step consists in screening of HLA-A02 positive donors by flow cytometry. Second step consists
in the isolation of CD8+ T cells by density gradient and then co-culture of the isolated cells with PEMs. Final
step was testing the activation of T cells measuring the expression of IFN- by RT-PCR and ELISA.
Test activation of T cells by measuring expression of IFN- γ
RT-PCR and ELISA
Co-culture of CD8+T cells with PEMs Isolation of CD8+T cells
Density Gradient
Screening of HLA-A02 positive donors
15
2 Materials and Methods
2.1
Flow cytometry
Flow cytometry is a sophisticated and powerful tool that allows a rapid analysis of multiple individual parameters of single cells, or other particles such as nuclei, microorganisms, chromosome preparations and latex beads. This technique allows to measure the optical and fluorescence characteristics of a suspension of particles [62], [63].
Flow cytometers are composed by three principal components: fluidics, optics and electronics. The fluidic system introduces and aligns the particles in a continuous flow in direction to the laser beam allowing a single cell or particle to go through the light laser. The optical system is divided into excitation components and collection components. The first one is responsible for focusing the light source on the particles and the collection components capture the dispersion and emitted fluorescent light by the fluorophores that are excited by the laser beam. This information is transmitted to the electronic system that converts the signal into digital data.[64]
In flow cytometers, the particles pass one by one through a laser beam and the scattered lights at different angles (related with structure and morphology of the cells) and fluorescence emissions are measured. Size, granularity, which are related with the internal complexity of the cell, and fluorescent features are physical properties that are used to characterize and differentiate cell populations.[65]
The forward angle light scatter (forward-scatter) is related with the size of the cells and the complexity of the cells is represented by the right angle scatter and it is known as side-scatter.[63] The fluorescent emissions which are measured can be derived from natural or chemical molecules. The last ones are used to stain some components that do not have natural fluorescence.[64]
Fluorescent compounds absorb light energy over a range of specific wavelengths. This absorption allows an electron to move into its excited state, as it passes from its fundamental level of energy to a higher energy level. Once the excited electron quickly returns to its ground state the excess of energy is released as a photon of light, being this release of energy called fluorescence. [62]
The fluorescent dyes can bind to different cellular components and antibodies conjugated to fluorescent dyes can bind with more specificity to the cellular components, such as proteins or cell membranes. The amount of fluorescence is proportional to the amount of fluorescent probe that is bound to a specific cell or component.[64]
For the work of this thesis, the Flow Cytometer that was used was an Attune Acoustic Focusing Cytometer (Applied Biosystems) which is constituted by two lasers: a blue laser (488 nm) and a red laser (638 nm). These two lasers allow the use and detection of up to six different fluorescences: four detected by the blue laser (BL1: green, BL2: orange, BL3: red and BL4: red) and the other two detected by the red laser (RL1: light red, RL2: dark red). In all experiments performed, at least 1x10⁴ events were acquired using the Attune Cytometric Software (version
16 2.1) and all the data analysis was made using FlowJo (version 10) and GraphPad Prism (version 6).
2.1.1 Screening of HLA-A02 positive donors by flow cytometry
Since the PEMs used in this experimental setup were assembled exclusively with MHC I molecules of the HLA-A02 allele, only CD8+ T cells from HLA-A02 donors were selected.
T cells used in the different assays were isolated from buffy-coats which are leuco-platelet concentrates. Buffy-coats were provided by Instituto Português do Sangue e da Transplantação (IPST), and all blood collection, separation of components and ethical procedures were performed by this institute. Each buffy-coat contains approximately 60 mL of blood and was obtained from a single healthy donor. Also in IPST, donated blood was screened in order to guarantee that the donors were healthy. An analytic imuno-serologic and molecular biologic screening for hepatitis B and hepatitis C virus, human immunodeficiency virus (HIV1/2), human T-lymphotropic virus (HTLV) and Treponema pallidum bacteria, which is syphilis agent, is performed prior to buffy coat receival.
Since all PEMs technology was optimized for cells from HLA-A02 donors, the first step performed was the screening of HLA-A02 positive donors by flow cytometry. To test if donors were HLA-A02 positive an aliquot of 100 μL of the leuco-platelet concentrate was placed into two tubes of 2 mL (100 μL in each tube) to perform a red blood cell lysis step at the same time that cells were stained for flow cytometry. In one of the tubes, 3 μL of PE Mouse anti-human HLA-A02 Clone BB7.2 (BD PharmingenTM) was added and mixed thoroughly. The tubes were then
incubated 30 minutes in the dark at room temperature. After incubation, 2 mL of room temperature Red Blood Cells Lysis Buffer 1x (see composition on Appendix I) were added in each tube. Tubes were pulsed in vortex and incubated at room temperature in the dark for 15 minutes. After lysis, the tubes were centrifuged at 500 x g for 5 minutes at room temperature. The supernatant was decanted and cells resuspended in 2 mL of phosphate buffered saline (PBS) (see composition on Appendix I) and centrifuged again at 500 x g for 5 minutes at room temperature. Finally, the supernatant was decanted and cell pellet resuspended in PBS. The samples were then analyzed by flow cytometry. An unstained control was used in parallel. The strategy used to analyze if donors were HLA-A02 positive is demonstrated in the Figure 2.1.