Consumer’s Willingness to Pay for Organic
Coffee: Weight of Each Benefit, Subaditivity
Effect and Influence of a National Brand.
Guilherme de Oliveira Pinheiro
152110014
i
Abstract
Over the last years organic agriculture has presented a remarkable increase on production due, among other things, to the higher interest shown by the consumers regarding food safety. In the U.S., despite the difficult economic times, the organic food grew by 9,4% in 2010. Therefore organic products’ market represents a great opportunity for companies in this industry.
In this research I investigate the price premium consumers’ in Portugal are willing to pay towards an organic product, more specifically organic coffee, estimating the weight of each benefit (private and public) implicit on the organic products for that price premium and if there is a subadditivity effect between public and private benefits. Furthermore, I explore what is the influence of a national brand in the price premium.
I performed a survey in Portugal, using the Contingent Valuation Method (CVM), more specifically Double-bounded dichotomous choice, in order to achieve the objectives of my research.
I found that consumers in Portugal are willing to pay 39,7% more for white label organic coffee and the private benefits of this organic product has two times the weight of its’ public benefits. Regarding the subadditivity effect, I discover that there is this effect between private and public benefits. Last but not least, concerning the influence of a national brand in the consumers’ price premium I found that the brand need to have a credible image that is consistent with the benefits of organic products if it wants to influence positively the price premium of consumers in Portugal.
ii
Ackowledgments
This thesis would have not been possible without the help and advices of others.
I want to specially thank to:
Professor Fernando Machado, for his enormous guidance and advices, always having pacience for my thousand questions.
My parents (Abilio de Oliveira Pinheiro and Ana Maria de Oliveira Pinheiro) and brother (Alexandre de Oliveira Pinheiro), for being my wisest guides, and for the unconditional support.
My friends, for the compassion revealed when listening to my concerns and for the support, expecially Ana Azevedo Branco and Kira Boenisch.
iii
Contents
Chapter 1 - Introduction ... 1
Chapter 2 – Literature Review ... 3
2.1. Methodologies used to calculate the price premium ... 3
2.2. Price Premium for Organic Products ... 5
2.3. Private versus public benefits of organic food products ... 9
2.4. Embedding Effects ... 11
Chapter 3 – Research Objectives and Research Design ... 13
3.1. Research Objectives ... 13
3.2. Research Design... 14
3.2.1. Scenarios Description ... 14
3.2.2. Elicitation of Willingness to Pay ... 16
3. 3. Description of the Questionnaire ... 17
Chapter 4 – Data Collection and Sample ... 18
4.1. Survey Method and Sampling ... 18
4.1.1. Survey Method ... 18
4.1.2. Target Population ... 18
4.1.3. Sampling ... 18
4.2. Participants ... 18
4.3.1. Characterization of the Sample ... 19
Chapter 5 - Analysis of Results ... 21
5.1. Study 1 ... 21
5.1.1. What is the price premium consumers are willing to pay for an organic white label coffee compared to traditional coffee? ... 21
iv 5.1.2. What percentage, in terms of value, is allocated by the consumer to each
benefit when purchasing this product? ... 24
5.1.3. Is there a subadditivity effect between public and private benefits? ... 26
5.2. Study 2 ... 28
5.2.1. The influence of a brand in the purchase of organic coffee ... 28
Chapter 6 – Main Findings & Implications ... 32
6.1. Main Findings ... 32 6.2. Implications ... 33 6.3. Limitations ... 34 Bibliography ... 35 Appendixes ... 41 Appendix 1 - Questionnaire ... 41
Appendix 2 – Bid Sets ... 47
Appendix 3 – Demographic Analysis ... 49
Appendix 4 – Frequency of Purchasing Organic Products ... 51
Appendix 5 – Number of Organic Products Bought Last Month ... 52
Appendix 6 – Correlation with Marital Status and Frequency of Purchasing Organic Products ... 53
Appendix 7 - Correlation with Educational Level and Frequency of Purchasing Organic Products ... 54
Appendix 8 - Correlation with Age and Frequency of Purchasing Organic Products . 55 Appendix 9 - Correlation with Gender and Frequency of Purchasing Organic Products ... 57
Appendix 10 – Weight of Each Benefit in the Consumers’ WTP ... 58
Appendix 11 – Exponential, Weibull and Loglogistic Model ... 58
1
Chapter 1 - Introduction
Over the last years organic agriculture has presented a remarkable increase in production due, among other things, to the higher interest shown by the consumers regarding food safety (Rodríguez, Lacaze & Lupín 2008). In the U.S., despite the difficult economic times, the organic food grew by 9,4% in 2010 (Jacobsen 2012). In order to have an insight of this market, we have first to define what this concept so called organic agriculture is and how it differentiates from the traditional one. As cited in Lampkin (1990), organic production is “a production system which avoids or largely excludes the use of synthetic compounded fertilizers, pesticides, growth regulators and livestock feed additives. To the maximum extent feasible, organic farming systems rely upon crop rotations, crop residues, animal manures, legumes, green manures, off-farm organic wastes and aspects of organic pest control to maintain soil productivity and tilt, to supply plant nutrients and to control insects, weeds and other pests.”. It is also defined by Antonio Colom-Gorgues (2009, p. 167) as a “production process which excludes the use of synthesized chemical products and is based on values such as health, respect for the environmental and protection of biodiversity, authenticity, animal care and welfare, social life, and other health aspects”.
Therefore, this method of production is applied due to the private and public benefits that are implicit in it. The private benefits rely on the organic products being healthier to the consumer owing to the absence of fertilizers. The public benefits are the ones that all the society will benefit from. As mentioned above, these include the prevention of soil erosion and the protection of biodiversity.
Several articles have estimated the consumers’ willingness to pay for organic food products. In general these studies have concluded that consumers are willing to pay a price premium for such products, due to these added benefits. However the empirical literature regarding this subject has limitations and leaves several open problems. First, there is a substantial disparity between the price premiums’ average, in percentage, that the consumers are willing to pay towards organic products. Second, taking into account that organic products have different benefits, it is important to
2 understand the main motivation of consumers to purchase these products. In other words, estimate how the price premium is divided between public and private benefits. Third, there is a lack of knowledge about the embedding effects in the estimation of Willingness to pay for organic food using contingent valuation method ,which happens when the willingness-to-pay (WTP) values for a good differ according to whether the good is valued on its own or as part of a package of goods (Dupont, 2003).
In this paper we analyze the above issues by conducting an empirical analysis of consumers’ WTP for organic coffee through the contingent valuation method.
This paper is organized as follows: The next section will provide an overview of the previous literature regarding this subject. This is followed by the methodology used in this article, research purpose, research questions and the research design. The following section describes how the data collection was done, stating the questionnaire conditions and what the characteristics of our sample are. Then we analyze the results from our sample estimating the price premium respondents are willing to pay for this type of products, analyzing the influence of the brand in these products and the existence of a subadditivity effect. The conclusion section summarizes the main findings of the article, reviews key limitations, and discusses relevant managerial implications.
3
Chapter 2 – Literature Review
In this chapter an overview of the previous literature will be done regarding four main topics: Methodologies used to calculate price premiums, previous studies that already calculated the price premium for organic food products, private versus public benefits of organic food products and embedding effects of Contingent Valuation Method usage.
2.1. Methodologies used to calculate the price premium
Several methodologies can be used to estimate the consumers’ willingness to pay for goods or product attributes. These methodologies can be aggregated in two main categories: stated preference approach and revealed preference approach. The stated preference approach asks to the consumers what economic value they would attach to a product or service. On the other hand, the revealed preference approach identifies the ways where a non-marketed good impact actual markets for some other good (Preference Techniques for Estimating Contingent Value: The Intelligent Customer's Guide, 2000)
In this study we focus on the stated preference approach and more specifically on the contingent valuation method (CVM).
The CVM involves questioning a random sample of people, a direct elicitation for their willing to pay for a specific product.
The CVM can take several formats:
Open-ended – When it is asked directly what the consumers’ maximum WTP is. This method has the following advantages: straightforward, does not give tips of what the value change might be.
Bidding game – Respondents are faced with several rounds of discrete choice questions, with a final question being an open-ended WTP question.
4 This method facilitates the respondents’ thought process and encourages them to consider their preferences carefully.
Payment card - where consumers are provided with visual aid which contains a large range of potential WTP amount ranging from 0 to a large amount. Consumers are then asked to declare which amount on the card they are willing to pay. This method is supported with Alberini (2005) findings: “the interval data is often superior to the bivariate model of a dichotomous question with follow up”.
This method has the following advantages: it provides a context to the bids, while avoiding starting point bias at the same time.
Single-bounded dichotomous choice - consumers are asked if they are willing to pay an extra amount of money for the organic food product. For instance: Are you willing to pay 5€ more for an organic product?
This method is thought to simplify the cognitive task faced by respondents.
Double-bounded dichotomous choice - consumers are asked if they are willing to pay an extra amount of money for the organic food product and is then asked to say yes or no to higher/lower bids, depending on the previous answer. For example: Are you willing to pay 5€ for an x product? If yes: and 10€? If no: and 2€?
This method has all of the advantages of single-bounded dichotomous choice but is more efficient as more information is elicited about each respondent’s WTP.
Although the CVM has been mainly utilized in economics to evaluate public goods (Randall, et al., 1974; Bishop & Heberlein, 1979; Hanemann, 1994), it has also been increasingly used in the marketing literature (Cameron & James, 1987; Park & MacLachlan, 2008; Sinha, Machado & Sellman, 2010).
5
2.2. Price Premium for Organic Products
Several studies have used the CVM to estimate the consumers’ price premium towards Organic Produced Products (OPP). Table 1 resumes most of these papers.
Table 1 – Summary of previous research on the estimation of WTP for OPP through the CVM
Study Year Country Method Organic Product / Scenario Price Premium
Mean in % Additional Evidence Tsakiridou, Zotos and Mattas (2006) - Greece Payment Card
Fruits, Vegetables, Olive Oil, Wine, Legumes, Bread
33,5%
Single Bound Dichotomous
Choice 35%
Jolly (1991) 1987 USA Open ended question Apples 37%
Krystallis and Chryssohoidis
(2005)
2005 Greece Open ended question
Fruits 45% - 90% Vegetables 30% - 60% Canavari, Nocella and Scarpa (2005) 2001 Italy Open ended Single Bounded Dichotomous Choice
Fruit (pesticide ban) -
WTP:
99 cents for Web survey 72 cents for in-person
6 Table 1 - Summary of previous research on the estimation of WTP for OPP through the CVM (Continued)
Study Year Country Method Organic Product / Scenario Price Premium
Mean in % Additional Evidence Sanjúan, et al. (2003) Gil, Gracia and Sánchez (2000) 1998 Spain Single Bounded Dichotomous Choice Open ended question
Vegetables 22-24% Fruit 22-24% Potatoes 15-17% Bernabéu et al. (2008) 2006 Spain - Single Bounded Dichotomous Choice - Open ended question
Organic Cheese 15,42%
Rodriguez, Lacaze and Lupín (2008)
2005 Argentina Single Bounded Dichotomous Choice
Milk 12%
Leafy Vegetables 87%
Whole Wheat Flour 7,5%
Fresh Chicken 20%
Aromatic Herbs 110%
Loureiro and Lotade (2005)
7 Some of them studied the WTP for various organic products instead of focusing their research in just one product.
Tsakiridou, Zotos and Mattas (2006) applied two different elicitation methods which are usually used to calculate the maximum WTP: payment card method and the dichotomous choice method. They used both methods to compare the consumer WTP in each one. The results indicated that the payment card method provided relatively lower prices for organic products in comparison with the dichotomous choice method. The model estimation indicated that consumers were willing to pay in the first method 33,5% extra price to purchase an OPP and in the second method 35%. It was also found that women, retired people, individuals with higher income and consumers who were born in semi-urban areas were the people with the higher WTP towards organic products.
Other studies have evaluated the WTP of consumers towards specific organic products.
Jolly (1991) and Canavari, Nocella & Scarpa (2005) based their studies on the WTP of consumers for organic fruit. Interest finding was done by Jolly (1991) using an open ended question, where in the USA the consumers were willing to pay a price premium for organic fruit (+37%).
Also Krystallis & Chryssohoidis (2005) used the open ended question methodology to estimate the WTP of Greek consumers for several types of organic food. Among the several types, this article reveals the WTP of Greek population regarding fruit (45 to 90% more) and vegetables (30 to 60% more).
Regarding the WTP of consumers towards organic food among different segments Sanjuán, et al. (2003) and Gil, Gracia and Sánchez (2000) a single bounded dichotomous choice and an open ended question were used in Spain. It was concluded that the WTP for organic products depended on the segment and product that was evaluated.
Exactly the same methodology as Sanjuán et al. (2003) was applied in the study of Bernabéu et al. (2008) to calculate the Spanish consumers’ WTP towards organic
8 cheese. The only difference of these two studies’ methodologies remains on the percentage that consumers were asked if they were willing to pay for a organic product. In the study of Bernabéu et al. (2008) consumers were asked if they were willing to pay an extra amount of money for the organic food products from a range of 10% to 100%, instead of a range from 5% to 20% done in the previous paper. The results showed that the price premium Spanish consumers were willing to pay for an organic cheese was 15.42%. (Bernabéu et al., 2008)
The contingent valuation method was also chosen by Rodríguez, Lacaze and Lupín (2008) to evaluate the WTP for five selected organic products in Argentina: regular milk, leafy vegetables, whole wheat flour, fresh chicken and aromatic herbs. In the evaluation a similar single bound dichotomous choice format was used. The results concluded that Argentinian consumers were willing to pay a price premium to acquire organic products. The price premium value depends on the type of organic product purchased, in this case the organic aromatic herbs and leafy vegetables had the highest WTP (110% and 87% higher compared to the conventional product) and the organic whole wheat flour the lowest one (7.5%).
Another methodology was conducted by Loureiro and Lotade (2005) to calculate the WTP for organic coffee. They elicited WTP using exclusively the payment card method. It is stated that the questionnaire followed the NOAA recommendations (Arrow et al., 1993) where they included budget constraint reminders to the participants in order to reduce hypothetical bias. The results showed that consumers price premium was 16,25 cents for 453g of organic coffee in contrast with $6.5 for regular coffee (30% more). Also Plesmacker, Driesen and Rayp (2005) tried a similar case, measuring the WTP of Fair Trade Coffee in Belgium. It was found that the average price premium that consumers were willing to pay was 10%.
The previous papers showed that single bounded dichotomous choice format was the most common methodology used to calculate the WTP for organic food products. The Payment card, as shown by Tsakiridou, Zotos and Mattas (2006) and Loureiro and Lotade (2005) was another methodology applied.
9
2.3. Private versus public benefits of organic food products
Few papers have not only calculated the consumers’ WTP but also tried to analyze the public and private benefits which influence the value of consumers’ price premiums. In general, these papers didn’t analyze the proportion of each benefit in the estimated price premium. Different results have been reached in this area. While some papers claimed that public benefits are the main motivation for people to buy an organic product, others claimed that private benefits are the main motivation.
Bougheraraa and Combris (2009) investigated whether the consumers’ price premium for an eco-labeled product is due to selfish or altruistic motives. This study was done analyzing the effect of revealing to the consumer that eco-labeled products don’t necessary mean higher private benefits. In order to clarify this question a within- and a between- subjects design was used. The within-design was composed by a 3 step procedure. First consumers stated their value for the food products. Second they received public information about the private benefits of consuming an eco-labeled product (it does not lead necessary to higher private benefits). Third subjects bided again. This procedure had the objective to assess the role of private benefits in consumer’s WTP. The between subjects design was done by comparing the values given to organic products by two different groups of people. The first group bided without any information except the labels and in the second group the information was disclosed before consumers stated their values.
The results showed that this information did not affect the buying prices which means the consumers’ price premium did not derive from higher private benefits (e.g. higher taste) but from purely altruistic reasons. The between subjects design confirmed that consumers are not mistakenly assuming that public benefits of organic products denote higher taste or safety benefits.
The perspective of public benefits being the main reason for the consumers’ price premium is also defended by Lusk, Nilsson and Foster (2006). In this article psychometric scaling techniques were conducted, in order to evaluate the individuals’ degree of altruism and propensity towards free riding. Results indicated that more altruistic individuals had a higher WTP for organic pork than less altruistic individuals
10 and free riders. Therefore, the public benefits had a significant influence in the value which consumers attach to this type of products. It is important to mention that Lusk, Nilsson and Foster (2006) did not try to measure which benefit had a higher value to the consumer when purchasing this product. They only tested if individuals who seem to have higher altruistic attitudes would be willing to pay a higher price for organic products than less altruistic individuals.
In contradiction, the results of Lusk and Briggeman (2009) showed that price, nutrition and taste are the food values most important to consumers, in other words, private benefits. This investigation was conducted by evaluating which values were more important to the consumer when he/she was purchasing food. A best-worst scaling was applied for this purpose. This scaling method basically involves people stating the most and the least important value when purchasing food, out of a values’ list provided. Even though the paper describes which values were more important for consumers when purchasing food, it did not evaluate how much they would be willing to pay for each of these values. Another issue remains on the lack of knowledge about what consumers perceive as the benefits of organic food, correlating with the values they choose as the most important.
Cicia, Giudice and Ramunno (2009) also concluded that health (a private benefit) was always the main purchase motivation. In this article was conducted a research of the main benefits that consumers were looking for when purchasing an organic product, calculating the proportion of the WTP for each benefit. In this case a qualitative-quantitative approach was adopted. First a face to face survey was done with 45 consumers of organic food to understand the main motivations behind the consumption of this type of product. Later on, a quantitative approach was adopted, analyzing data from 203 telephone interviews, in order to calculate the monetary value attached to deep motivations. The calculation was done by comparing different types of tomatoes. The results showed that consumers overall were willing to pay a price premium of 0,86€ in comparison to the conventional tomato, where 0,46€ was related only to the deep “health” motivation (private benefit) and 0,40€ could be assigned to the deep “environmental” motivation (public benefit). Therefore, even
11 though the public benefit had a significant impact on the WTP of consumer, the private benefit was the most significant value.
In summary, different conclusions have been reached regarding which benefits were the main influencer to purchase an organic product. As can be seen in the papers above, most of the researchers have been focusing on estimating the WTP of consumer towards organic products without taking into consideration which benefits mainly influence the consumer’s price premium. A few of them tried to analyze these benefits, but just Cicia, Giudice and Ramunno (2009) have calculated the proportion prevailing from each type of benefit. This study has only been done in Italy and it contradicts with Lusk, Nilsson and Foster (2006) and Lusk and Briggeman (2009).
2.4. Embedding Effects
“Embedding is said to occur when the willingness-to-pay (WTP) values for a good differ according to whether the good is valued on its own or as part of a package of goods” (Dupont, 2003, page 319). From Hanemann (1994) perspective the embedding effect is divided into three different components: the scope, the sequencing and the subadditivity effect. The scope effect occurs when the willingness to pay varies inadequately with changes in the scales or scope of the item being valued. The sequencing effect occurs when the willingness to pay for a set of items to be valued, for example three lakes, gets a high value for the first item, but the other items add little value or nothing to the total value (Hanemann, 1994). Finally, the subadditivity effect occurs when “the price put on a good is greater if the good is first divided into parts which are evaluated individually, with the individual evaluations being summed, than if it is evaluated in its entirety” (Read, 2001, page 5).
In the previous literature several embedding effects were studied regarding the use of Contingent Valuation focused on public benefits/goods (Carson, Flores, & Meade, 2001; Klose, 1999; Venkatachalam, 2004; Rulleau, Dehez, & Point, 1992; Kahneman & Knetsch, 1992; Diamond & Hausman, 1994; Dupont, 2003).
In this article we will analyze into more detail the subadditivity effect between private benefits and public benefits. This effect is also defined by Hanemann, (1994, page 34) as “the willingness to pay for a composite change in a group of public goods may be
12 less than the sum of the willingness to pay for the individual changes separately”, in other words, the subadditivity effect occurs when different components are valued separately and the simple addition of the WTPs of separate components results in a higher WTP than WTP measured in a single scenario where all the components are evaluated together (Klose, 1999). Only a few articles covered this topic (Klose, 1999; Hanemann, 1994; Read, 2001) but without taking into consideration a combination of public and private benefits, just focusing on public ones.
Therefore, we will try to bring a new perspective of the subadditivity effect, considering the combination of private and public benefits implicit in an organic product.
13
Chapter 3 – Research Objectives and Research Design
This chapter is divided in two main parts: In the first part we describe the purpose of this research and the questions that need to be answered in order to achieve this purpose. The second part describes the methodology adopted in our empirical study.
3.1. Research Objectives
The purpose of this research is to explore the willingness to pay of the consumers in Portugal regarding organic products, understanding what benefits are implicit in this price premium and calculating the proportion of each benefit in it. Moreover the research has the objective of exploring the subaditivity effect with private and public benefits. A further objective is to investigate the role of a brand in explaining preferences for organic products.
To achieve the research objectives described above, the following questions have to be answered:
What is the price premium consumers are willingness to pay for organic coffee in comparison with a traditional coffee?
What percentage, in terms of value, is attached by the consumer to each type of benefit when purchasing this product?
Is there a subadditivity effect between public and private benefits?
What is the influence of a brand in the purchase of organic coffee?
The context chosen for the research was the consumption of coffee. This was so because coffee is a product that is widely consumed and purchased across all age categories.
14
3.2. Research Design
In order to address the research questions, a comparative method (a ‘between’ subjects design) was adopted. Each respondent was randomly assigned into one of the four scenarios described in section 3.2.1. Other experimental papers have also used a between subject design (Rousu et al. 2002; Lecocq et al., 2005; Rousu et al., 2007). 3.2.1. Scenarios Description
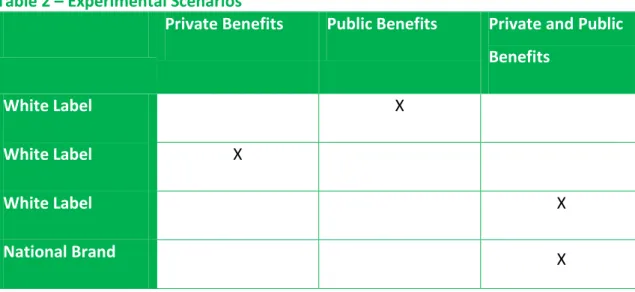
As mentioned above four different scenarios were created: in the first one, consumers were asked about their WTP towards a white label coffee with public benefits (eco-friendly coffee). In the second one, consumers were asked about their WTP towards a white label coffee with private benefits (healthy coffee). In the third one, consumers were asked their WTP towards a white labe coffeel with private and public benefits (organic coffee). Finally, in the fourth scenario consumers were asked about their WTP towards a branded coffee with public and private benefit. (Delta organic coffee) (Table 2)
Table 2 – Experimental Scenarios
Private Benefits Public Benefits Private and Public Benefits
White Label X
White Label X
White Label X
National Brand X
In each scenario the respondents were asked to picture themselves in a situation where they go to a large supermarket to buy 1 kg package of coffee and they have to choose between conventional coffee and a coffee with added benefits (Appendix 1). These added benefits were described to respondents based on the information of LiveStrong (2012).
15 The differences between the 4 scenarios lie therefore on the benefits that are implicit in each type of coffee and on coffee brand. These differences are presented below for each scenario.
Scenario 1 – White label “Eco-Friendly” Coffee
You are given a choice between two types of white label coffee: traditional coffee and coffee produced through eco-friendly methods. The Eco-friendly coffee is similar to traditional coffee on every attribute (taste, health impact, etc.) except for the following additional environmental benefits:
An eco-friendly coffee protects the environment by the use of alternative production method which prevent soil erosion and the deforestation, that otherwise will happen if the traditional method is used. The deforestation also affects migratory birds’ populations, which have fewer places to winter.
Scenario 2 – White Label “Healthy” Coffee
You are given a choice between two types of white label coffee: traditional coffee and coffee produced through healthy methods. The "Healthy coffee" is similar to traditional coffee on every attribute (taste, environmental impact, etc.) except for the following additional health benefits:
Many scientists discovered that 30% of insecticides, 60% of herbicides and 90% of fungicides used in the traditional coffee production can slightly increase the probability of getting cancer. It was also proved that pesticides and other conventional farming chemicals, also utilized in the traditional production, can cause damage to the nervous and reproductive systems. Drinking Healthy coffee eliminates the health risks posed above by the traditional coffee.
16 Scenario 3 - White Label Label Organic Coffee
You are given a choice between two types of white label coffee: traditional coffee and coffee produced through healthy and eco-friendly methods (organic coffee). The Organic coffee is similar to traditional coffee on every attribute (taste, aroma, etc.) except for the following additional benefits:
Health Benefits: the same as described in Scenario 2
Environmental Benefits: the same as described in Scenario 1
Scenario 4 – Delta Organic Coffee
You are given a choice between two types of Delta coffee: traditional coffee and coffee produced through healthy and eco-friendly methods (organic coffee). The Organic coffee is similar to traditional coffee on every attribute (taste, aroma, etc.) except for the following additional benefits:
Health Benefits: the same as described in Scenario 2
Environmental Benefits: the same as described in Scenario 1 3.2.2. Elicitation of Willingness to Pay
Respondents were informed of the regular price of coffee (eg. 6.20€/kg for the price of conventional white label coffee in scenarios 1, 2 and 3) and were asked about their willingness to pay for a coffee with added benefits (for example, environmental benefits in scenario 1).
The Double Bounded Dichotomous Choise method, which was already described in the section 2.1, was used.
For each scenario 5 bid sets were defined, each bid set containing a base, a low and a high bid value. (Appendix 2) The values of the bid sets were defined depending on the benefits that were implic for each scenario. For scenarios 1 and 2 where just one benefit was implicit on the coffee, the bid sets were half of the ones defined for scenario 3 and 4 where two benefits were implicit.
17
3. 3. Description of the Questionnaire
The questionnaire was composed by four main sections. In the first section the respondents were faced with a screening question where they were asked about their frequency of purchasing organic products. If a respondent answered less than 1 per week, he would not complete the survey since he was considered a non-coffee drinker. The second section was valuation regarding a type of coffee (eg. Scenario 1 would be regarding “Eco-Friendly” coffee), showing before the benefits of it (Appendix 1). The third sections, consumers were asked several questions regarding their attitudes towards a brand, the weight of public and private benefits in their price premium and the frequency of purchasing organic products. The questions of this section were just used in particular scenarios. Finally the forth section contained social demographic questions.
The questionnaire had 4 versions, corresponding to the 4 scenarios described above. The versions differed in the valuation section and in additional questions.
Also, it was not revealed to the respondents the real objective of the questionnaire since it could bias their answers regarding their willingness to pay towards the product of each scenario. It was only stated that “the survey was about preferences for different types of coffee”.
18
Chapter 4 – Data Collection and Sample
4.1. Survey Method and Sampling
4.1.1. Survey Method
The data collection was conducted through an Internet based survey. This method was chosen due to the several advantages that it brings in terms of time and costs. Regarding time, this method due to the social networks can reach thousands of people in short period of time. Concerning the costs, because the questionnaire was done in an electronic paper instead of real paper, it did not have costs associated with this last one such as postage, printing, data entry (Llieva et al., 2002; Watt, 1999; Witmer et al., 1999).
4.1.2. Target Population
The target population was coffee drinkers residing in Portugal, defined as consumers who drink coffee at least once a week. A qualifying question was used before starting the questionnaire to select our target (Appendix 1, Q1).
4.1.3. Sampling
In this research we started by disseminating the questionnaire among social networks, then we benefited from the snowball effect, therefore two sampling techniques were used: convenience and snowball.
The questionnaire had the particular requirement of the respondents being coffee consumers. In order to get this information from the respondents, the first question of the questionnaire was: “How frequently do you drink coffee?” If the respondent answered “less than 1 per week”, which was considered a non-coffee consumer, he/she would end automatically the questionnaire. (Appendix 1, Q 1)
4.2. Participants
Overall 367 people started to answer the questionnaire. From these 367, 20 people (5,5%) didn’t finish the questionnaire so they were eliminated from our sample.
19 Also, 94 participants (25,6%) were considered non-coffee consumers and they were also excluded from our sample.
Therefore, the remaining 253 respondents (68,9%) were suitable for further analysis. Regarding these respondents, 44 were faced with the “Delta Organic Coffee” scenario, 81 were faced with the “White Label Organic Coffee” scenario, 66 with the “Healthy Coffee” scenario and finally 47 were faced with “Eco-Friendly Coffee” scenario. Even though the scenarios were randomized among the respondents, there was an unbalance in the frequency of people faced with different scenarios.
4.3.1. Characterization of the Sample
In this sample 4 social demographic characteristics were analyzed: age, gender marital status and educational level. (Appendix 3)
Table 3 – Sample Summary Statistics
Age 18 – 23 44,7%
Female 57,3%
Single 60,1%
Bachelor Degree 48,2%
Regarding the age, 0,8% have less than 18, 44,7% have between 18 and 23 (which was expected since the questionnaire was distributed through social networks that mainly university students use) 18,6% have between 24 – 29, 10,2% have between 30 – 40, 9,5% have between 41 – 50 and finally 16,2% have more than 50 years.
Concerning gender, 42,7% are males and 57,3% are females.
In terms of marital status our sample is composed by 60,1% singles, 34,4% married, 5,1% divorced and 0,4% widowed.
Regarding educational level, 1,2% attended to elementary school, 18,2% attended to secondary school, 48,2% have the bachelor degree, 30,8% have the master degree and 1,6% had a Phd degree.
20 In terms of frequency that consumers purchase organic products, the results reveal that already 192 of the respondents (75,9%) bought organic.(Appendix 4)
From the 192 people consumers of organic products, 62,5% bought 1-2 of this type of products, 26% bought between 2 and 5, 7,8% bought between 6-10 and only 3,6% bought more than 10 of these products (Appendix 5).
The significant number of people that purchased organic products can be explained by the increasing awareness of food quality and safety by the consumers which was emphasized by several authors (Gil, Gracia, & Sánchez, 2000; Bernabéu, Olmeda, Diaz, & Olivas, 2008; Rodríguez, E., 2008).
Moreover, it is also interesting to analyze whether the purchase of organic products is correlated with any social demographic variables (age, educational level, marital status and gender) of the respondents. (Appendix 1, Q7 to Q10). In order to test this associations, a Chi-Square Independency test was used.
Regarding this test for age, educational level and marital status, it is clear in Appendix 6, 7 and 8 that their significance values are higher than 0,05, therefore no association was found between these variables and the answer of the question already mentioned.
Concerning the same test for gender (Appendix 9) the significance value (0,00) implies that these two variables are not independent. By the table shown in the same annex we can conclude that females (84,8% answered yes) are more willing to purchase organic products than males (63,9% answered yes).
21
Chapter 5 - Analysis of Results
In this section, we present the results of two studies. The first study involves scenarios 1, 2 and 3 and we analyze the consumers’ price premium for an organic white label coffee, the percentage allocated by the consumer to each benefit when purchasing this product and the subadditivity effect between public and private benefits. The second study involves scenarios 3 and 4 and we analyze the influence of a brand in the purchase of the organic coffee.
5.1. Study 1
5.1.1. What is the price premium consumers are willing to pay for an organic white label coffee compared to traditional coffee?
First of all it is important to understand the methodology used to calculate the respondents’ willingness to pay for white label organic coffee.
The first step was to collect data from the respondents in a way that we could visualize the range where their willingness to pay for organic coffee was situated. Therefore, it was defined a lower bound and upper bond of this range based on the answers of respondents to the valuation questions.1
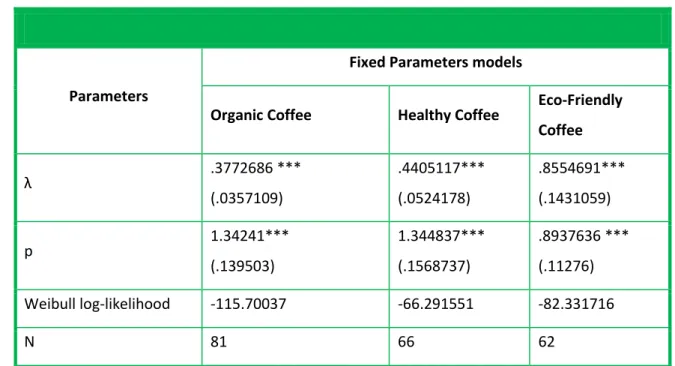
The second step was to estimate the distribution function of the respondents’ willingness to pay. Three possible models were tested: Exponential, Weibull and Loglogistic (Appendix 11). Based on the value of the likelihood function, the Weibull model was chosen. The survival function for the Weibull distribution is given by:
where it is the variable price and λ and p the parameters of the function. The main results are presented in Table 3.
Table 3 – Estimates of Weibull function regarding White Label Coffees
1
For instance, in scenario 3 of the questionnaire, if a respondent choose in the first question the organic white label product (6,48€) but would not choose it in the second question (6,88€), his/her lower bound
22
Parameters
Fixed Parameters models
Organic Coffee Healthy Coffee Eco-Friendly
Coffee λ .3772686 *** (.0357109) .4405117*** (.0524178) .8554691*** (.1431059) p 1.34241*** (.139503) 1.344837*** (.1568737) .8937636 *** (.11276) Weibull log-likelihood -115.70037 -66.291551 -82.331716 N 81 66 62
*** and ** indicate the coefficients are significantly different from zero at the 1 and 5 per cent significance level, respectively.
Standard errors are in parentheses.
Regarding the white label organic coffee, the distribution function with the values described in Table 3, is which is represented in Figure 1: Figure 1 – Weibull survival function for white label organic coffee
This figure shows the % of respondents who are willing to pay a specific price premium for the organic coffee.
The last step was to calculate the mean price premium for white label organic coffee. The formula used to calculate the mean was . On average the consumers’ price premium is 2,43€ for the organic white label coffee. In other words they offer 39,7% more for this type of coffee compared to the traditional coffee price.
0% 20% 40% 60% 80% 100% $0.2 0 $0.6 0 $1.0 0 $1.4 0 $1.8 0 $2.2 0 $2.6 0 $3.0 0 $3.4 0 $3.8 0 $4.2 0 $4.6 0 $5.0 0 $5.4 0 $5.8 0 $6.2 0 $6.6 0 $7.0 0 $7.4 0 $7.8 0 $8.2 0 $8.6 0 $9.0 0 $9.4 0 $9.8 0 % r e sp o n d e n ts WT P Price Premium
23 Comparing with the results of previous studies for organic products in Table 1, the price premium of +39,7% is surprisingly high.
Regarding coffee, the study of Loureiro & Lotade (2005) was done with just environmental benefits, “Eco Friendly coffee” in USA, and the estimated price premium of consumers for this product was just 2,5%, which means that a possible reason for our high price could be the health benefits implicit on this product. This possibility is further analyzed in the next section.
24 5.1.2. What percentage, in terms of value, is allocated by the consumer to each benefit when purchasing this product?
Respondents were faced with the question “Is your willingness to pay some additional amount of money for the organic coffee primarily based on environmental benefits or on health benefits? Please indicate the relative importance of each type of benefit by dividing 100 points between the two” (Appendix 1 Q4).
Table 4 – Weight of each benefit
Benefits Weight (%)
Health 63,09
Environment 36,91
Table 4 clearly shows that health benefits (average 63,09%) have a heavier weight than environment (36,91%) (Appendix 10).
In order to verify whether if the respondents’ answers match with their behavior when they are purchasing an organic coffee, an analysis was conducted regarding the price premium which they gave for each benefit when they are separated in two different products: “healthy coffee” and “eco-friendly coffee”. The parameter estimates of the Weibull function for healthy and eco-friendly coffee are reported in the Table 3 and represented in Figure 2.
Figure 2 – Weibull survival functions for Healthy and Eco-Friendly Coffee
0% 10% 20% 30% 40% 50% 60% 70% 80% 90% 100% 0.20 € 0.80 € 1.40 € 2.00 € 2.60 € 3.20 € 3.80 € 4.40 € 5.00 € 5.60 € 6.20 € 6.80 € 7.40 € 8.00 € 8.60 € 9.20 € 9.80 € Healthy Coffee Eco-Friendly Coffee
25 The results showed that on average respondents’ price premium is 2,08€ for a “Healthy Coffee” and 1,12€ for “Eco-Friendly Coffee”, which means the proportion in terms of the total price premium is 65% for health and 35% for environment. Therefore, the results of WTP elicitation appear to be totally consistent with the respondents’ perception about the relative importance of each benefit for them. To conclude, we estimated that the health benefits have almost 2 times the weight of environmental benefits in the price premium.
26 5.1.3. Is there a subadditivity effect between public and private benefits? In order to answer this research question it is essential to understand how can be calculated the sum of the two benefits in separate. We cannot simply sum both benefits since different people answered the valuation questions for each benefit (Healthy and Eco-Friendly Coffee). Therefore we don`t know if exists any correlation between them. Based on the estimated Weibull distribution we generated the values of WTP for health and environmental benefits for an artificial sample of 1000 consumers. This was done under 3 alternatives assumptions for the correlation between the WTP for the two benefits: 0, -0.5, +0.5.
For each alternative value of the correlation we summed the values of the WTP for the two benefits. Then we re-estimated the distribution of the WTP for the sum of the benefits by maximum likelihood.
With this in mind, three possible scenarios were created, one with 0 correlation (when the variables are independent), another with -0.5 (when variables are substitutes) and a third one with 0,5 correlation (when variables are complements). With 1000 answers for each scenario we reestimated the Weibull function for the sum of the benefits.
Figure 3 shows the estimates of Weibull functions for each scenario:
Figure 3 – Estimated distribution of WTP for both benefits for alternative values of correlation 0% 10% 20% 30% 40% 50% 60% 70% 80% 90% 100% $0.2 0 $0.8 0 $1.4 0 $2.0 0 $2.6 0 $3.2 0 $3.8 0 $4.4 0 $5.0 0 $5.6 0 $6.2 0 $6.8 0 $7.4 0 $8.0 0 $8.6 0 $9.2 0 $9.8 0 % r e sp o n d e n ts WTP Price Premium Correlation 0 Correlation -0,5 Correlation 0,5
27 In Figure 3 we can see that, even though the distribution functions change a little bit, the mean does not have a significant change between the scenarios: for 0 correlation 3,16€, for -0,5 correlation 3,17€ and for 0,5 correlation 3,13€. Therefore we choose one of the scenarios, the sum of benefits with correlation 0, to compare with the white label organic coffee.
Figure 4 – Comparison between the distribution functions of sum of benefits with correlation 0 and white label organic coffee
We can conclude looking at Figure 4 that the price premium is higher when the benefits are separated in Health and Eco-Friendly coffees than when they are together in an organic coffee (average price premium: 2,43€).
Therefore, we can state that a significant subadditivity effect exists concerning private and public benefits.
0.0% 10.0% 20.0% 30.0% 40.0% 50.0% 60.0% 70.0% 80.0% 90.0% 100.0% 0.20 € 1.00 € 1.80 € 2.60 € 3.40 € 4.20 € 5.00 € 5.80 € 6.60 € 7.40 € 8.20 € 9.00 € 9.8 0 € % r e sp o n d e n ts WtP Price
Sum of benefits with correlation 0
28
5.2. Study 2
5.2.1. The influence of a brand in the purchase of organic coffee
First of all, in order to evaluate the influence of a brand in the purchase of organic coffee, we had to choose a national coffee brand. The brand selected was Delta because it has high brand awareness among the consumers in Portugal, being one of the market leaders (Country Representative Business Awards Europe, 2012), Furthermore Delta already sells organic coffee in Portugal (Agricultura Biológica Take Home, 2012).
After the brand was chosen, we evaluated its influence in the purchase of organic coffee. In particular we were interested in testing whether the estimate price premium of organic coffee is significant affected by the brand. Therefore, a significance test was used. It tests if the respondents’ price premium changes between white label coffee and Delta coffee. This test can be done by analyzing if the variation of the two parameters of the distribution model, λ and P, is significant. Therefore the following specification was adopted for λ and p:
In these two expressions B was a dummy variable, where the value would be 1 if the price premium was towards Delta organic coffee and 0 if the price premium was towards white label organic coffee. A statistically significant estimate of ϴ1 or β1
indicates that consumers value the added benefits of organic coffee differently when the purchase decision is made in the context of a national brand, rather than a white label brand.
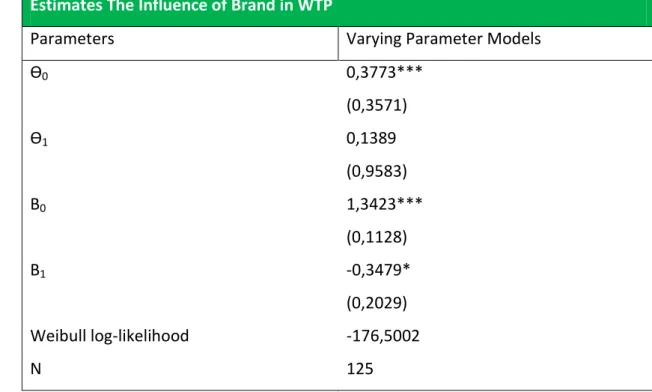
29 Table 5 – Estimates the Influence of Brand in WTP
Estimates The Influence of Brand in WTP
Parameters Varying Parameter Models
ϴ0 0,3773*** (0,3571) ϴ1 0,1389 (0,9583) Β0 1,3423*** (0,1128) Β1 -0,3479* (0,2029) Weibull log-likelihood -176,5002 N 125
*** and ** indicate the coefficients are significantly different from zero at the 1 and 5 per cent significance level, respectively.
Standard errors are in parentheses.
Due to the small sample which faced these two scenarios (125 respondents) the significant value used to compare was the percentile 0,10. The significance value for ϴ1
was 0,147 and for β1 was 0,086, which means that even though the difference in ϴ1 is
not significant (higher than 0,10), β1 is significantly different between the two brands
(lower than 0,10).
Figure 5 – Comparison between WTP distribution of Delta’s organic coffee and white label organic coffee
0% 10% 20% 30% 40% 50% 60% 70% 80% 90% 100% $0.2 0 $0.8 0 $1.4 0 $2.0 0 $2.6 0 $3.2 0 $3.8 0 $4.4 0 $5.0 0 $5.6 0 $6.2 0 $6.8 0 $7.4 0 $8.0 0 $8.6 0 $9.2 0 $9.8 0 % r e sp o n d e n ts WtP Price Premium
Delta Biological Coffee White Label Biological Coffee
30 As can be seen in Figure 5, the brand (Delta) surprisingly has a negative impact in the respondents’ price for Organic coffee. This impact can be shown by the difference in terms of mean in each scenario. Regarding the Delta Organic Coffee the mean price premium is 1,94€ and for White Label is 2,43€.
The negative correlation between Delta and the price premium can be possibly explained by the respondents’ image of Delta regarding health and environment. Therefore it was conducted a questionnaire (Appendix 1 Q4) regarding their attitudes towards Delta concerning healthiness and environment. The respondents would have answer from a scale 1 to 5 (where 1 is strongly agree and 5 strongly disagree) 4 questions about their perception about Delta regarding healthiness (Dennis B, Laverie, & Meiers, 2003; Boonghee, Donthu, & Lee, 2000) and 5 questions regarding environment (Yu-Chan, 2010). These sentences are described in Table 6.
Table 6 – Items of scales to measure attitudes towards Delta
Only respondents who were faced with Delta scenarios answered this attitudinal questionnaire. The respondents on average rated Delta 2,7 (3 is Neither Agree or Disagree) (Appendix 12) in both images which means that Delta is not connected with health or environment in their minds. Therefore the absence of this connection could be the reason why they don’t give a higher price premium for Delta organic coffee.
Health
It makes sense to buy Delta instead of any other brand, even if they are the same
Even if another brand has the same features as Delta, I would prefer to buy Delta
If there is another brand as good as Delta, I prefer to buy Delta
I Think Delta is a healthy coffee
Environment
Delta is regarded as the best benchmark of environmental commitments
Delta is professional about environmental reputation
Delta is successful about environmental performance
Delta is well established about environmental concern Delta is trustworthy about environmental promises
31 Also the significant price’s difference of traditional coffee between White label and Delta (6,12€ and 9,70€ per kg respectively), can explain the lower price premium chosen for Delta compared to White label.2
2
For instance: if the price premium was 0,36€, the price for white label organic coffee would be only 6,48€ and the price of Delta organic coffee would be 10,06€.
32
Chapter 6 – Main Findings & Implications
6.1. Main Findings
I performed this study with the aims of finding the price premium consumers in Portugal are willing to pay for an organic coffee and discovering the influence of a brand in this price premium. Also discovering the weight of public and private benefits in the consumers’ price premium and the existence of subadditivity effect between these two benefits were objectives of this paper.
Regarding the price premium it was found consumers in Portugal are willing to pay 39,7% (2,43€) more for a white label organic coffee than for traditional white label coffee, which is surprisingly high if we compare with previous studies who calculated price premiums for organic products. (Table 1)
Regarding the weight consumers attach to each benefit when purchasing an organic product, first we can conclude that the health benefits has two times (65%) the weight of environmental benefits (35%) in the price premium. Second, it is important to enhance that they are conscious about the weight that they give for each benefit, since their perceptions of this weight (Appendix 1 Q3) matches with our WTP estimates. The subadditivity effect between public and private benefits was also important issue to analyze since none of the previous literature had covered this effect. From the results obtained, a significant subadditivity effect was found regarding private and public benefits due to the higher value respondents attach for these benefits in separate, in comparison with the benefits together in just one product.
Last but not least, concerning the influence of the brand we have surprisingly found that when the purchase decision is made in the context of a leading national brand rather than a white label the WTP for the added benefits of organic coffee declines. This negative impact can be explained by the lack of relation, in consumer minds, of Delta with health and environmental benefits implicit in the organic coffee. They rated Delta in both images (health and environment) 2,7 out of 5, where 3 was neither agree or disagree. Therefore, this study shows that consumers’ preferences regarding the
33 attributes of a product (e.g. the coffee being organic) depends on the brand image being related or not with these attributes.
6.2. Implications
From the conclusion of this study, we can state that it is very important for brands that are involved in selling organic products to have a credible image that is consistent with the benefits of such products. If these image is not consistent with the products’ benefits, consumers are not willing to pay a high price premium for organic products as we saw with the case of the national coffee brand “Delta”. Since Delta is not associated with health and environmental benefits consumers are not willing to pay a higher price for Delta’s organic coffee compared to other brands or even with label brands.
For the companies of this industry, Portugal is an attractive market since a significant number of people already purchased organic products and they are willing to pay a high price premium for these products (in the case of coffee the average is almost 40% more). These findings can change the behavior of food companies towards organic products, who can take into consideration penetrating this new market, since it is starting to have a heavier weight in Portugal and not just as a niche market.
Moreover for all brands which are exploring the organic products’ market in Portugal, it is important to focus their communication on private benefits that has two times the weight of public benefits when consumers are considering the price premium they are willing to pay for an organic product. It doesn’t mean that they do not need to communicate the public benefits, because it still has some weight on the consumers price premium, it means that more attention needs to be given for private benefits.
34
6.3. Limitations
In this study three main limitations have been taken into consideration: Size of the sample, the sample bias and the hypothetical Bias.
Regarding the size of the sample, the study is only based on 367 people who do not represent the population in Portugal. Especially the size of the sample which answered the scenario regarding Delta is too small to give a clear behavior of consumers in Portugal towards the brand (just 51 respondents).
Taking into consideration the sample bias, due to the mainly use of social networks to disseminate the questionnaire, 44,7% of our sample was between 18 – 23 years old, which do not represent the population in Portugal.
Concerning the hypothetical bias, since our questionnaire was taken in a hypothetical scenario and not on a real one, we cannot be sure that the consumers in Portugal would have the same behavior as they showed in our hypothetical situation. However, there is an increasing evidence that carefully designed CVM studies, following the protocols established in recent studies (Carson, Flores, & Meade, 2001) and the recommendations made by the National Oceanographic and Atmospheric Administration (Arrow et al., 1993) yield both reliable and valid estimates of WTP (Carson, Flores, & Meade, 2001).
35
Bibliography
Preference Techniques for Estimating Contingent Value: The Intelligent Customer's Guide. (2000). EFTEC.
Agricultura Biológica Take Home. (2012). Retrieved 06 01, 2012, from Delta Cafés: http://www.delta-cafes.pt/pt/produtos/take-home/agricultura-biologica
Continente Online Café. (2012). Retrieved 05 10, 2012, from Continente Web site: http://www.continente.pt/ProductsIndexMain.aspx?CategoryName=12&SubCa tegoryName=12120201&CategoryPath=12|121202
Country Representative Business Awards Europe. (2012, 8 25). Retrieved 8 25, 2012, from Country Representative Business Awards Europe: http://www.businessawardseurope.com/download/EBA_case_study_Delta_fin al.pdf
What are the Benefits of Organic Coffee Consumption? (2012, 04 29). Retrieved 05 12, 2012, from Live Strong Web site: http://www.livestrong.com/article/412545-benefits-organic-coffee-consumption/
Alberini, A. (1995). Efficiency vs. bias of willingness-to-pay estimates: bivariate and interval-data models. J. Environ. Econ. Manage. 29, 169-180.
Arrow, K., Solow, J., Portney, P., Leaner, E., Radner, R., & Howard Schuman, E. (1993). Report of the NOAA panel on contingent valuation. Fed. Regist. 58 (10), 4601-4614.
Bernabéu, R., Olmeda, M., Diaz, M., & Olivas, R. (2008). Determination of the Surcharge That Consumers are Willing to Pay for an Organic cheese in Spain. 12th Congress of the European Association of Agricultural Economists.
Bishop, R. C., & Heberlein, T. A. (1979). Measuring Values of Extra-market Goods: Are Indirect Measures Biased? American Journal of Agricultural Economics, 61, 926-930.
36 Boonghee, Y., Donthu, N., & Lee, S. (2000). n Examination of Selected Marketing Mix
Elements and Brand Equity. JAMS, 28 (2), 195 - 211.
Bougherara, D., & Combris, P. (2009). Eco-labelled food products: what are consumers paying for? European Review of Agricultural Economics Vol 36 (3), 321-341. Bruner II, G. C. (2009). Marketing Scales Handbook - A Complitation of Multi-Item
Measures Volume 5. Illinois USA: GCBII Productions.
Cameron, T., & James, M. D. (1987). Efficient estimation methods for "closed-ended" contingent valuation surveys. Rev Econ Stat, 69(2), 269-276.
Canavari, M., Nocella, G., & Scarpa, R. (2005). Stated Willingness-to-Pay for Organic Fruit and Pesticide Ban. Journal of Food Products Marketing, Vol. 11(3), 107-134.
Carson, R. T., Flores, N. E., & Meade, N. F. (2001). Contingent Valuation: Controversies and Evidence. Environmental and Resource Economics, 173 - 210.
Cicia, G., Del Giudice, T., & Ramuno, I. (2009). Enivronmental and Health Components in Consumer Perception for Organic Products: Estimation of Willingness to Pay. Journal of Food Products Marketing 15, 324-336.
Colom-Gorgues, A. (2009). The Challenges of Organic Production and Marketing in Europe and Spain: Innovative Marketing for the Future With Quality and Safe Food Products. Journal of International Food & Agribusiness Marketing, 166– 190.
Dennis B, A., Laverie, D. A., & Meiers, A. (2003). Developing Parsimonious Retailer Equity Indexes Using Partial Least Squares Analysis: A Method and Applications. JR, 79 (3), 161 -170.
Diamond, P. A., & Hausman, J. A. (1994). Contingent Valuation: Is Some Number Better than No Number? The Journal of Economic Perspectives, Volume 8, Issue 4, 45 - 64.
37 Didier, T., & Lucie, S. (2008). Measuring consumer’s willingness to pay for organic and
Fair Trade products. International Journal of Consumer Studies 32, 479-490. Dupont, D. P. (2003). CVM Embedding Effects When There Are Active, Potentially
Active and Passive Users of Environmental Goods. Environmental and Resource Economics 25, 319 - 341.
Gil, J. M., Gracia, A., & Sánchez, M. (2000). Market segmentation and willingness to pay for organic products in Spain. International Food and Agribusiness Management Review 3, 207-226.
Hanemann, W. M. (1994). Valuing the Environment Through Contingent Valuation. Journal of Economic Perspectives Volume 8, Number 4, 19 - 43.
Jacobsen, J. (2012). Organic and natural holding strong. Beverage Industry, 58-62. Jolly, D. A. (1991). Differences Between Buyers and Nonbuyers of Organic Produce and
Willingness to Pay Organic Price Premiums. Jorunal of Agribusiness, 97 - 111. Kahneman, D., & Knetsch, J. L. (1992). Valuing Public Goods: The Purchase of Moral
Satisfaction. Environmental Economics and Management 22, 57 - 70.
Klose, T. (1999). The contingent valuation method in health care. Health Policy 47, 91 -123.
Krystallis, A., & Chryssohoidis, G. (2005). Consumers' willigness to pay for organic food: Factors that affect it and vaiation per organic product type. British Food Journal, Vol. 107 No. 5, 320-343.
Lampkin, N. (1990). Organic Farming. Farming Press.
Lecocq, S. M. (2005). The impact of information on wine auction prices: results of an experiment. Annales d'Economie et de Statistique 77, 37-54.
Llieva, J. B. (2002). Online surveys in marketing research: Pros and cons. International Journal of Market Research, 44 (3), 361–367.
38 Loureiro, M. L., & Lotade, J. (2005). Do fair trade and eco-labels in coffee wake up the
consumer conscience? Ecological Economics 53, 129-138.
Lusk, J. L., & Briggeman, B. C. (2009). Food Values. American Journal of Agricultural Economics , 186-196.
Lusk, J. L., Nilsson, T., & Foster, K. (2007). Public Preferences and Private Choices: Effect of Altruism and Free Riding on Demand for Environmentally Certified Pork. Environmental & Resource Economics 36, 499-521.
Noussair, C., Robin, S., & Ruffieux, B. (2004). A comparison of hedonic rating and demand-revealing auctions. Food Quality and Preference, 15, 393–402.
Olesen, I., Alfnes, F., Røra, M. B., & Kolstad, K. (2010). Eliciting consumers' willingness to pay for organic and welfare-labelled salmon in non-hypothetical choice experiment. Livestock Science 127, 218–226.
Park, J. H., & MacLachlan, D. L. (2008). Estimating Willingness to Pay with Exaggeration Bias-Corrected Contingent Valuation Method. Marketing Science, 27 (4), 691-698.
Pelsmacker, P., Driesen, L., & Rayp, G. (2005). Do Consuers Care about Ethics? Willingness to Pay for Fair-Trade Coffee. The Journal of Consumer Affairs, Vol. 39, No. 2, 363-385.
Randall, A., Ives, B., & Eastman, C. (1974). Bidding Games for Valuation of Aesthetic. J.Environ.Econ.Manag., 132-49.
Read, D. (2001). Is Time-Discounting Hyporbolic or Subadditive? Journal of Risk and Uncertainty 23:1, 5 - 32.
Rodríguez E., L. V. (2008). Contingent Valuation of Consumers’ Willingness-to-Pay for Organic Food. 12th Congress of the European Association of Agricultural Economists.
39 Rousu, M. H. (2002). The value of verifiable information in a controversial market: evidence from lab auctions of genetically modified food. Department of Economics Working Paper Series. Ames: Iowa State University.
Rousu, M. H. (2007). Effects and value of verifiable information in a controversial market: evidence from lab auctions of genetically modified food. Economic Inquiry 45, 409-432.
Rulleau, B., Dehez, J., & Point, P. (1992). The tourist recreational demand for coastal forests: DO forests really matter? Review of Agricultural and Environmental Studies, 291 - 310.
Sanjuán, A. I., Sánchez, M., Gil, J. M., Gracia, A., & Soler, F. (2003). Brakes to organic market enlargement in Spain: consumers’ and retailers’ attitudes and willingness to pay. International Journal of Consumer Studies, 27, 134-144. Sinha, R. K., Machado, F., & Sellman, C. (2010). Don't Think Twice, It's All Right: Music
Piracy and Pricing in DRM-Free Environment. Journal of Marketing, 74 (2), 40-54.
Tsakiridou, E., Zotos, Y., & Mattas, K. (2006). Employing a Dichotomous Choice Model to Assess Willingness to Pay (WTP) for Organically Produced Products. Journal of Food Products, 59 - 69.
Van Loo, E. J., Caputo, V., Nayga Jr., R. M., Meullenet, J.-F., & Ricke, S. C. (2011). Consumers’ willingness to pay for organic chicken breast: Evidence from choice experiment. Food Quality and Preference 22, 603-613.
Venkatachalam, L. (2004). The contingent valuation method: a review. Environmental Impact Assessment Review 24, 89 - 124.
Watt, J. H. (1999). Internet systems for evaluation research. In G.Gay & T. L.Bennington (Eds.). In Information Technologies in Evaluation: Social, Moral, Epistemological, and Practical Implications (pp. 23–44). San Francisco: Jossey-Bass.