Executives Misconducts
and Their Consequences
on the Associated
Companies’ Stock Markets
Cláudia Gaspar
Dissertation written under the supervision of Geraldo Cerqueira
Dissertation submitted in partial fulfilment of requirements for the
MSc in Economics with Major in Finance and Banking, at the
ii
Abstract
Corporate scandals drive news and media outbursts which temporarily catch the public’s interest; however, they may have a more significant effect on the business world. The purpose of this dissertation is to determine how executives misconduct affect the stock market price of their associated companies. All scandals that occurred between January 2013 and March 2019 within companies from S&P 500 and NASDAQ indexes were considered, with two exceptional cases. For this purpose, an event study methodology was applied. The findings suggest that corporate scandals committed by executives negatively affect the stock price of the concerned companies.
Scandals were grouped by characteristics to outline various patterns. Related to type, financial scandals cause a more significant impact on the value of companies than personal misconduct. In terms of industries, technology is more negatively influenced by the occurrence of a scandal than other industries. Regarding the position of the executives in the company, scandals concerning individuals in top positions affect more the stock price than scandals exercised by lower executives. The last characteristic, being a former or current executive within the company, led to inconclusive results regarding the value of the company following a scandal. In order to determine which characteristics, the market has penalised most severely in these companies under study, a regression analysis was carried out. The results are consistent in showing that an executive holding a top position is a crucial negative factor when a scandal is announced.
Title: Executives Misconducts and Their Consequences on the Associated Companies’ Stock
Markets
Author: Cláudia Gaspar
Keywords: Event study, Corporate Scandals, Financial impact, Executives Misconduct,
iii
Resumo
Os escândalos corporativos geram notícias e explosões na impressa que captam temporariamente o interesse do público, mas que podem ter um efeito mais significativo no mundo dos negócios. O objetivo desta dissertação é determinar como é que a indevida conduta dos executivos afeta o preço no mercado acionários das empresas associadas aos mesmos. Todos os escândalos ocorridos entre janeiro de 2013 e março de 2019 em empresas dos índices S&P 500 e NASDAQ foram considerados, com dois casos excecionais. Para tal, foi aplicada uma metodologia de estudo de eventos. As conclusões sugerem que os escândalos empresariais cometidos por executivos afetam negativamente o preço das empresas em questão.
Os escândalos foram agrupados por características para delinear vários padrões. Relativamente ao tipo, os escândalos financeiros causam um impacto maior no valor das empresas do que a indevida conduta pessoal. Em termos industriais, a tecnologia é negativamente mais influenciada pela ocorrência de um escândalo do que as outras indústrias. Quanto à posição dos executivos na empresa, os escândalos relativos a indivíduos em posições de topo afetam mais o preço acionário do que os escândalos exercidos por executivos inferiores. A última característica, ser ex-executivo ou atual-executivo na empresa, gerou resultados inconclusivos quanto ao valor da empresa após um escândalo.
Para determinar quais características o mercado penalizou mais severamente nestas empresas em estudo, foi realizada uma análise de regressão. Os resultados são consistentes em mostrar que um executivo com uma posição de topo é um fator crucial negativo aquando anúncio de um escândalo empresarial.
Título: Indevida Conduta dos Executivos e as suas consequências no mercado acionário das
empresas associadas
Autor: Cláudia Gaspar
Palavras-chave: Estudo de Evento, Escândalos Corporativos, Impacto Financeiro, Indevida
iv
Acknowledgements
My master's degree at the Católica Lisbon School of Business and Economics culminates with this dissertation. As such, I would like to extend my sincere thanks to all the people – teachers and colleagues – who have accompanied me in bringing this research from project to reality. A special mention to my supervisor, Geraldo Cerqueira, for his constant support and guidance, and for the valuable feedback that enriched my dissertation.
I would also like to thank all those who have spent endless hours with me in the Reuters Room, helping me throughout my master's degree and in particular during these months in which I wrote my dissertation. I am referring to my colleagues and friends: Juliana Crisóstomo, Ana Rita Godinho, Ana Luísa Silva, Ana Costa, Inês Almeida, Inês Coelho, Tiago Coelho, João Fradique, Henrique Carmo, Nuno Plácido, Miguel Silva and Peter Kleinhans.
Beyond the framework of my faculty, I want to mention the members of my tennis club – my second home – for their constant help and understanding of my work. As such, I would like to give a special thanks to an essential pillar of my life, my coach Miguel Sousa, who has always been with me and who has shaped the person I am today.
Last but not least, I am deeply grateful to all my family and friends, especially to my mother Helena, my father Manuel, my sister Rafaela and my cousin Daniela for their encouragement, their support and their endless patience.
v
Table of Contents
Abstract ii Resumo iii Acknowledgements iv Table of Contents vList of Figures vii
List of Tables vii
Glossary viii
1. Introduction 1
2. Literature Review 3
2.1. Corporate Scandals 3
2.2. How corporate scandals affect the company’s value and the overall economy 4
2.3. Summary 6
3. Data and Variables 7
3.1. Data 7
3.2. Variables 7
3.3. Summary of Statistics 9
4. Methodology 11
4.1. Event Study Methodology 11
4.2. Constructing Abnormal Returns and Parametric Tests 12
4.3. Non-parametric tests 16
4.4. Regressions 18
4.5. Estimation and Event Window 20
4.6. Hypothesis 21
4.7. Confounding Events 21
5. Results 23
5.1. Individual Corporate Scandals 23
5.2. All Corporate Scandals 25
5.3. Group of Corporate Scandals divided by their Type 27
5.4. Group of Corporate Scandals divided by Industries 30
5.5. Group of Corporate Scandals divided by the Executive’s Position 36 5.6. Group of Corporate Scandals divided by Current or Former Executive 38
vi 5.7. Regressions 41 5.8. Validation 43 5.8.1. Market Efficiency 43 5.8.2. Anticipation 44 5.8.3. Confounding Events 44 6. Conclusions 45 7. Reference List 48 8. Appendices 51
vii
List of Figures
Figure 1 CARs’ graphsList of Tables
Table 1 All corporate scandals committed by executives between January 2013 and March 2019
Table 2 Database’s summary statistics Table 3 CARs’ summary statistics Table 4 ACSAR of all companies
Table 5 Non-parametric tests for all companies
Table 6 ACSAR of personal misconduct scandals and of financial misconduct scandals
Table 7 Non-parametric tests of personal misconduct and of financial misconduct Scandals
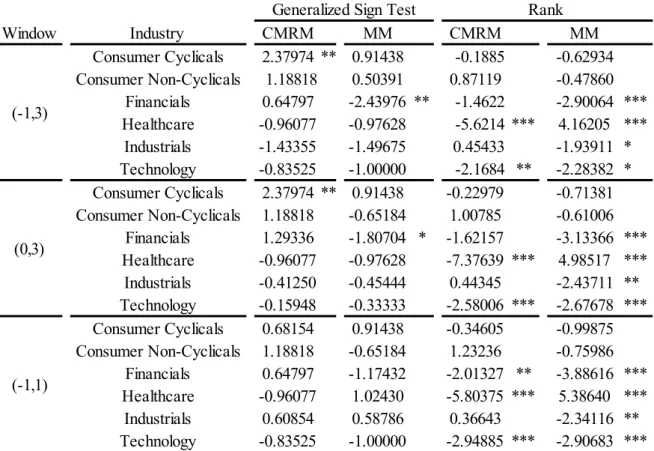
Table 8 ACSAR of each industry for the event windows (-1,3) Table 9 ACSAR of each industry for the event windows (0,3) Table 10 ACSAR of each industry for the event windows (-1,1) Table 11 non-parametric tests for each industry
Table 12 ACSAR of top position executives and lower position executives Table 13 Non-parametric tests for each executives’ position
Table 14 ACSAR current or former executives grouped
Table 15 Non-parametric tests for current or former executives grouped Table 16 CARs OLS regression
viii
Glossary
CMRM Constant mean return model
MM Market return model
AR Abnormal return
CAR Cumulated abnormal return SAR Standardized abnormal return
1. Introduction
Corporate scandals related to financial misconduct already have its popularity recognized, such as fraud, insider dealing, bribery, money laundering, between others. Enron and WorldCom are historically known as examples of this type of scandal. However, after October 2017, hence after the prominence of #MeToo, scandals related to personal misconduct such as sexual harassment, sexual assault, or even physical abuse are recurrent.
#MeToo is a movement founded in 2006 by Tarana Burke, a civil rights activist, to help survivors of sexual violence, especially among young and black women. This hashtag based movement begins to emerge around the world after Alyssa Milano, actress, tweeted: "If all the women who have been sexually harassed or assaulted wrote 'me too' as a status, we might give people a sense of the magnitude of the problem." This tweet came after the allegations of sexual assault by the Hollywood mogul and producer, Harvey Weinstein. To fully understand the extent of Milano's action, a year after the initial tweet, #MeToo hashtag was used over 19 million times on Twitter. It represents more than 55000 uses per day.
Knowing the power which a scandal can have on the company's values, the purpose of this dissertation is to investigate how Executive's misconduct affects the market value of the company. Moreover, taking into account the lack of relevant research around the subject, this dissertation will show an academic value on this "hot" topic. For example, previous literature has been focussing, almost exclusively, on financial misconduct scandals in general, without specifying any distinction between which position is the scandal been exercise by, if it is by regular employees or if it comes from a more higher rank employee such as executives for instance. Accordingly, this study will cover all types of scandals committed by executives, including the growing number of personal misconduct scandals being disclosed, adding value to previous literature. Despite the lack of past research on this subject, the reason why this dissertation will only analyse scandals exercised by executives is due to the more significant impact an executive action has in comparison to similar actions done by regular workers. To achieve the goal of this dissertation, an event study methodology is applied. Normal performance is estimated by Constant Mean Return and Market Return Models. Parametric tests are conducted to infer whether abnormal returns and cumulative abnormal returns are significantly different from zero. Non-parametric tests are performed to check the robustness
2
of the previous results, being the Generalized Signal Test and the Rank Test selected for this purpose.
To understand the effects of corporate scandals with different features, corporate scandals were grouped by characteristics. Thus, there is a broader group with all of the corporate scandals to understand the overall effect. The other groups are structured by types of scandal; the industry to which a company belongs; the type of executive position; and if the executive is a former or a current employee.
From past literature, the common conclusion lies in a significant negative impact on the companies' stock price once executives have committed corporate scandals. Furthermore, related to the type of scandal, it is expected that financial misconduct scandals still hold a more negative influence than personal misconduct scandals. This because the first ones are commonly associated with fines and penalties for the companies, meaning more losses to the company and therefore, for the investors. Regarding the position of the executive, it is projected that top position executives will have higher negative abnormal returns than the lower position executives. Hence, the top position has a higher decision power and so more newsworthy. In respect to current or former executives, it anticipated that current employees affect more negatively the value of the company after the scandal is announced. The reason behind this expectation is that current employees are the ones responsible for driving added value to the company. Concerning the industries, significant differences are not expected to be found since there is no specific industry that has more relevance in the market than others.
This dissertation is composed of a literature review about corporate scandals, and its impact on the company's value as well as in the overall economy. Afterward, in section three, data and variables are described. Section four presents all the methodology supporting the results. Then, in section five, all the results and findings of this study are shown. Finally, conclusions will be presented in section six, as well as some potential limitations of the study and suggestions for future research.
3
2. Literature Review
2.1. Corporate Scandals
Corporate scandals occur whenever negative information about the company is disclosure, which consequently affects the investors' opinion about the company in terms of efficiency, transparency, politic effectiveness, and credibility of its managers. Ordinarily, it is related to some prohibited act done under the rules of good governance.
According to Kuhn and Aschcraft (2003), there are three types of corporate scandals. The first one, the most commonly known, is associated with fraudulent accounting practices, such as mishandling company earnings for individual purpose, booking earnings for fictitious transactions, creating phantom affiliates or unique entities to cover the debt, or misleading results to avoid tax practices. The second type concerns the misuse of stock options and questionable loans in publicly traded companies, for instance, insider trading or option backdating. The last type has to do with collusive relationships between supposedly independent parties such as financial analysts, banks, auditors, managers, and the board of directors.
Regarding theoretical explanation which justifies the goal to commit corporate scandal, there are two primary considerations.
Firstly, the economic view explains that agents commit corporate crimes in an attempt to maximize their own utility (i.e., their personal gain). Chain, Tsai, and Li (2015) also claim that executives might commit corporate crimes when the individual utility from the misbehaviour is higher than the utility derived from the executive compensation scheme. Watts, Maniam, and Leavell (2018) identify that narcissistic and self-confident individuals tend to be more likely to commit corporate crimes, but they also recognized that the higher the position in the company, the higher are the opportunities to commit illegalities.
Secondly, the resource-based perspective proposes that corporate scandal is yield by default internal factors within the firm, which lead it more inherently disposed to commit corporate illegalities. For instance, Kochan (2002) specific highlights five internal characteristics as poor organization culture and structure, lack of character from the firms' employees and the pressure to excel in the short term formed by market forces and requirements. Moreover, Key (1999) argues that by definition culture is the shared beliefs of a company's members, hence the existence or inexistence of ethical values will be reflected in the beliefs its members and
4
consequently, will be reflected their behaviours. Baucus (1989) similarly claims that the organization's culture influence how ethical decisions are made, and the pressure to adapt people behaviour to organizational culture may also lead to unethical conduct. Furthermore, Jory, Ngo, Wang, and Saha (2015) alleges that the competitive nature of the business exercise a massive pressure on companies' management to the extent of executives losing their jobs if they fail to deliver some specific targets. To prevent this situation, some managers engage in illegal practices to satisfy investors.
On the other hand, Narayanan, Schipani, and Seyhun (2006) discover that many executives engage in option backdating practices to increase their options awards further. They compared the executive compensation gained illegally with the damage shareholders have suffered from the misconduct release. The Authors discover that executive benefit resulted in illegal behaviour averages $2.5 million per firm over a five-year period, and once those practices were publicly known, the average loss by the shareholders rounds $400 million per firm. Jensen (2005) also claims that sometimes executives participate in value-destroying activities to boost the value of the shares, therefore, also according to Karoff, Lee, and Martin (2006), such activities can indeed be tremendously costly since firms lose real value when they are caught.
2.2. How corporate scandals affect the company’s value
and the overall economy
Several types of research have been conducted to analyse the impact of corporate scandals in the stock price of a company. Long and Rao (1995) study the effects of unethical behaviour, including scandal, bribery, employee discrimination, illegal payments, environmental pollution, and insider trading on shareholder wealth. The authors discover that the costs of reported unethical corporate behaviour result in significantly negative abnormal returns to shareholders. Likewise, Rao and Hamilton (1996) conclude that once their unethical conduct publicly exposed a company, it is stock price would fall. Murphy, Shrieves, and Tibbs (2009) also found negative stock price reactions after the announcements of alleged misconduct. Karpoff and Lott (1993) find that either the firm's or government's announcements of alleged or actual corporate misconduct correspond to an economically and statistically significant loss in the company's stock price. Karoff, Lee, and Martin (2006) examined 585 firms targeted by SEC for financial misconduct, and they discovered that the imposed market' penalties were much more substantial than the penalties imposed on the firms via the legal and regulatory system. With a similar conclusion, Armour, Mayer, and Polo (2011) found that companies
5
involved in corporate scandals experience significant abnormal losses on stock prices of approximately nine times the penalties and compensation paid.
Jain, Jain, and Rezaee (2010) analysed stock market reactions to option backdating probe announcements, and, for the 245 implicated companies, they detected negative abnormal returns. These results were more modest for an internal investigation than for SEC announcements, and the most severe results were from the Department of Justice Investigations. Bernile, Jarrell, and Mulcahey (2006) found that exposure to options backdating experience negative abnormal returns around the announcement dates. Likewise, Narayanan, Schipani, and Seyhun (2006) discovered an adverse market reaction after the disclosure of option backdating. Janney and Gove (2011) examined the market reaction to the firm's acknowledgment of involvement in the US stock option backdating scandal. Firms involved in CSR are less prone to experience a corporate scandal; nevertheless, the wrong-doing of this firm are penalized with hashed sanctions. They also find evidence that stock price drops less severely if the company itself does the discloser.
Jory, Ngo, Wang, and Saha (2015) conduct more profound research about the corporate scandal as they did not restrict their sample on only financially motivated scandals, they include personal nature and sexual harassment scandals. All scandals had involved a CEO, directly or indirectly. They find that the announcement-period cumulative abnormal return is always negative and significant. They also conclude that the days following the announcement increases the stock price volatility in the short-term only if the company does not apply corrective actions after the scandal.
Regarding the difference between financial and other types of scandals, Doherty, Dowling, and Miller (2011) discovered that people respond less negatively to moral scandals than to financial ones, when they do not involve abusive power; otherwise, it substantially affects responses to both types of scandals.
Besides the impact that these corporate scandals have on firms, they also have an impact on society. A more extreme view made by Watts, Maniam and Leavell (2018) exhibits evidence that companies within the same industry which are subject to negative publicity, not only affects the company's net income but as well as investor's decision on how to apply their money, which consequently increases the government's duty to look for answers related to this event. As an anticipatory answer, the government will create new regulations in order to prevent future corporate scandals. Garzert (2015) also argues that the direct economic cost of corporate financial misconduct can be a minor element of its overall negative consequences. By reducing
6
the trust in financial markets, financial misconduct may decrease stock market participation and potentially increase the cost of capital for all firms.
2.3. Summary
Previous research shown above suggests that the market reacts negatively to corporate scandals, although those covered scandals were almost all related to financial misconduct. Only Long and Rao (1995), Rao and Hamilton (1996) and Jory, Ngo, Wang, and Saha (2015) address scandals that were not financially motivated. Long and Rao (1995) included employee discrimination and environmental pollution announcements. Rao and Hamilton (1996) comprised employee discrimination, environmental pollution, and business ethics scandals. At last, Jory, Ngo, Wang, and Saha (2015) admitted all types of scandals – like extramarital affairs or sexual harassment - linked to CEOs' involvement.
This dissertation extends the literature review by analysing corporate scandals where only executives were involved, and the motivation was not only financially in order to see if the conclusions would remain the same despite the type of scandal.
7
3. Data and Variables
3.1. Data
In this dissertation, an “event” is defined when there is news related to a corporate scandal involving a company´s executive, therefore, by definition, those that show high levels of social pressure around the top managers’ related scandal. All analysed events were extracted from companies within S&P 500 or NASDAQ indexes between January 2013 and March 2019, with two exceptions as it will be specified further ahead.
The primary sources of the database are the SEC, Financial Times, New York Times, Wall Street Journal, Bloomberg, Reuters, and VOX. Although the presence in one of those journals/websites is not a mandatory criterion, it is the biggest significant factor. After analysing the media pressure, a small group of companies was established. All observations were checked for its presence in Thomson Reuters Eikon News Tab. In total, there are 40 individual observations, with two exceptions, Retrophin, and National Beverage. They were included in the sample due to the number of new and pressure related to them.
All stock prices were retrieved from Thomson Reuters Eikon, and the final sample includes 40 top managers’ related scandals.
3.2. Variables
This section shows how data was organized, since corporate scandals have different characteristics, and therefore can be grouped in different ways.
Consequently, those corporate scandals are divided into two types: financial misconduct scandals and personal, inappropriate conduct scandals. Financial misconduct scandals are the ones involving financial illegalities like fraud, insider trading, bribery, money laundering, misleading investors between others. The inappropriate personal scandals are the ones concerning people’s improper behaviour as internal misconduct, sexual harassment, sexual abuse, rape allegation, among others.
The scandals are also grouped by their industry. There are six industries in the database: Consumer Cyclicals, Consumer Non-Cyclicals, Financials, Healthcare, Industrials, and Technology.
8
Another relevant feature is the type of position that the executive has in the company. There are two types of positions: top position and lower position. In order to better understand this feature, top positions are Founders, CEOs, CFOs, CIOs, Nº2, Presidents, and Vice Presidents. Lower executive positions are the remaining ones.
The last group reflects the executive’s presence: whether the executive is a current or a former worker of the company.
Table 1 outlines all the corporate scandals and the characteristics mentioned.
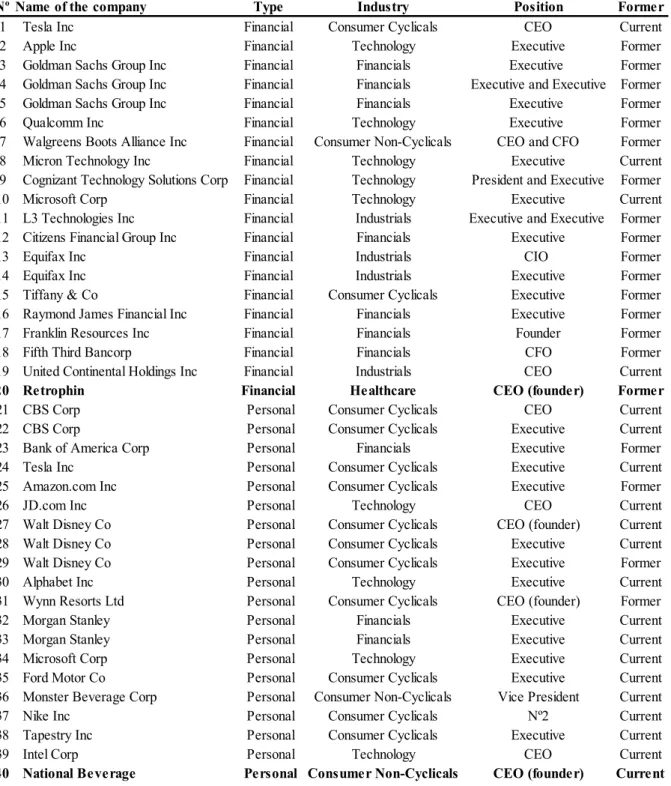
Table 1: This table shows all corporate scandals committed by executives between January 2013 and March 2019, from US companies listed in S&P 500 or NASDAQ indexes. The two exceptions are identified in bold.
Nº Name of the company Type Industry Position Former
1 Tesla Inc Financial Consumer Cyclicals CEO Current 2 Apple Inc Financial Technology Executive Former 3 Goldman Sachs Group Inc Financial Financials Executive Former 4 Goldman Sachs Group Inc Financial Financials Executive and Executive Former 5 Goldman Sachs Group Inc Financial Financials Executive Former 6 Qualcomm Inc Financial Technology Executive Former 7 Walgreens Boots Alliance Inc Financial Consumer Non-Cyclicals CEO and CFO Former 8 Micron Technology Inc Financial Technology Executive Current 9 Cognizant Technology Solutions Corp Financial Technology President and Executive Former 10 Microsoft Corp Financial Technology Executive Current 11 L3 Technologies Inc Financial Industrials Executive and Executive Former 12 Citizens Financial Group Inc Financial Financials Executive Former 13 Equifax Inc Financial Industrials CIO Former 14 Equifax Inc Financial Industrials Executive Former 15 Tiffany & Co Financial Consumer Cyclicals Executive Former 16 Raymond James Financial Inc Financial Financials Executive Former 17 Franklin Resources Inc Financial Financials Founder Former 18 Fifth Third Bancorp Financial Financials CFO Former 19 United Continental Holdings Inc Financial Industrials CEO Current
20 Retrophin Financial Healthcare CEO (founder) Former
21 CBS Corp Personal Consumer Cyclicals CEO Current 22 CBS Corp Personal Consumer Cyclicals Executive Current 23 Bank of America Corp Personal Financials Executive Former 24 Tesla Inc Personal Consumer Cyclicals Executive Current 25 Amazon.com Inc Personal Consumer Cyclicals Executive Former
26 JD.com Inc Personal Technology CEO Current
27 Walt Disney Co Personal Consumer Cyclicals CEO (founder) Current 28 Walt Disney Co Personal Consumer Cyclicals Executive Current 29 Walt Disney Co Personal Consumer Cyclicals Executive Former 30 Alphabet Inc Personal Technology Executive Current 31 Wynn Resorts Ltd Personal Consumer Cyclicals CEO (founder) Former 32 Morgan Stanley Personal Financials Executive Current 33 Morgan Stanley Personal Financials Executive Current 34 Microsoft Corp Personal Technology Executive Current 35 Ford Motor Co Personal Consumer Cyclicals Executive Current 36 Monster Beverage Corp Personal Consumer Non-Cyclicals Vice President Current 37 Nike Inc Personal Consumer Cyclicals Nº2 Current 38 Tapestry Inc Personal Consumer Cyclicals Executive Current
39 Intel Corp Personal Technology CEO Current
9
Information regarding the name of executives involved and the date of the announcement of the scandal are presented in Appendix A. In addition, information on the indices to which the companies belong is given in Appendix B.
3.3. Summary of Statistics
For a better understanding of the sample distribution, Table 2 includes several panels.
Panel A validates the Index where the companies are listed, Panel B summarizes the types of scandals, Panel C shows the scandals by industry, Panel D consider the presence of top executives in the scandal, Panel E presents the number of current and former executives involved in corporate misconduct, and, at last Panel F displays the number of personal misconduct scandal before and after #MeToo. In Appendix C, there is an analysis related to the number of people involved in corporate scandals in each company and each industry.
As it can be acknowledged by Panel A the majority of scandals relies on S&P500, 60% of the companies are only listed in S&P500 whereas 8% are only listed in NASDAQ, 28% is listed in both Indexes and 5% of the sample represent the two exceptions, i.e., the ones that are listed neither in S&P500 nor in NASDAQ.
Regarding the type of scandals, there are 20 cases of financial misconduct and other 20 related to inappropriate personal conduct. Regarding the industry, Consumer Cyclicals is the most representative one with 13 scandals, followed by Financials with 10 and 9 corporate scandals for Technology. Those types of industries represent more than 80% of the sample.
Looking specific for an executive position, 18 corporate scandals were committed by top position executives, whereas 22 were committed by lower position ones. Moreover, 50% of the scandals were performed by current executives and 50% by former executives.
Focusing only on personal scandals, an impressive result was found; 95% of those were only disclosed after #MeToo gained strength.
The last Panel only provides 31 companies, despite the fact there are 40 corporate scandals in total, meaning that there are companies in which their executives committed more than one corporate scandal. In total, 7 companies show more than one corporate scandal during the sample period: Goldman Sachs, Walt Disney, Tesla, Microsoft, Equifax, CBS, and Morgan Stanley. However, by more carefully looking at the number of executives involved in scandals, there are 46 executives implicated. Eleven companies have more than 1 executive involved, being Goldman Sachs, Walt Disney, and Alphabet, the organizations with more persons
10
involved. The same process for the industry, Consumer Cyclicals, Financials and Technology has more than 11 executives engaged in corporate scandals.
Table 2: This table shows the database’s summary statistics in 7 panels described above.
Panel A:
Index Nº Scandals %
S&P500 35 88% Panel G:
NASDAQ 14 35% Number of scandals in each company Nº Scandals %
Only S&P500 24 60% 1 Goldman Sachs Group Inc 3 8%
Only NASDAQ 3 8% 2 Walt Disney Co 3 8%
Both 11 28% 3 Tesla Inc 2 5%
None 2 5% 4 Microsoft Corp 2 5%
5 Equifax Inc 2 5%
Panel B: 6 CBS Corp 2 5%
Type Nº Scandals % 7 Morgan Stanley 2 5%
Financial 20 50% 8 Apple Inc 1 3%
Personal 20 50% 9 Qualcomm Inc 1 3%
Sum: 40 10 Walgreens Boots Alliance Inc 1 3%
Panel C: 11 Micron Technology Inc 1 3%
Industry Nº Scandals % 12 Cognizant Technology Solutions Corp 1 3%
Consumer Cyclicals 13 33% 13 L3 Technologies Inc 1 3%
Financials 10 25% 14 Citizens Financial Group Inc 1 3%
Technology 9 23% 15 Tiffany & Co 1 3%
Industrials 4 10% 16 Raymond James Financial Inc 1 3%
Consumer Non-Cyclicals 3 8% 17 Franklin Resources Inc 1 3%
Healthcare 1 3% 18 Fifth Third Bancorp 1 3%
Sum: 40 19 United Continental Holdings Inc 1 3%
Panel D: 20 Retrophin 1 3%
Executive Position Nº Scandals % 21 Bank of America Corp 1 3%
Top Position 18 45% 22 Amazon.com Inc 1 3%
Lower Position 22 55% 23 JD.com Inc 1 3%
Sum: 40 24 Alphabet Inc 1 3%
Panel E: 25 Wynn Resorts Ltd 1 3%
Current or Former Nº Scandals % 26 Ford Motor Co 1 3%
Current 20 50% 27 Monster Beverage Corp 1 3%
Former 20 50% 28 Nike Inc 1 3%
Sum: 40 29 Tapestry Inc 1 3%
Panel F : 30 Intel Corp 1 3%
Personal Scandals Nº Scandals % 31 National Beverage 1 3%
After #MeToo 19 95% Sum: 40
Before #MeToo 1 5%
11
4. Methodology
4.1. Event Study Methodology
An event study uses financial market data to analyses the impact of a specific event on the value of the company by its share price. With this methodology, it is possible to understand if there is an abnormal change in the market price associated with an unanticipated event, inferring the significance of the event.
The first published event study was from James Dolley (1933), who examined the impact of stock splits on market prices. However, it was Ball and Brown (1968) and Fama, Fischer, Jensen, and Roll (1969) who introduced the standard method nowadays used. The first ones considered the earnings’ information, and the second ones tested the effects of stock splits on the stock prices, controlling for confounding events.
For McWilliams and Siegel (1997) three assumptions are underlying an event study: Market efficiency, unanticipated event, and isolation of confounding effects. The first one implies that the effects of an event should immediately be reflected in the stock prices because markets ought to include all the information available for traders. Regarding the second assumption, the event under study must be unanticipated. Therefore, the market did not have any previous information about the event, reflecting the implications immediately on the market price as described in the first assumption. With this, it is expected that the stock market only reacts to the information that investors receive about the event on the announcement day. In what concerns the last assumption, it is mandatory to be sure that there are no confounding effects during the event window, as other events might be overlapping this particular event study, influencing the companies’ financial performance.
Even though there is no unique structure, there is a general flow of analysis presented by Macklinlay (1997) in 7 steps. Firstly, an event of interest is defined as well as the event window (i.e., the examination period over the companies’ stock prices). The second step involves the definition of the selection criteria for the inclusion of companies in the study. Thirdly, to analyse the event’s impact, it is necessary the measure of the abnormal return, for which the normal return is also needed. There are several options for modelling the normal returns, being the most common ones the Constant Mean Return Model and the Market Return Model. After designing the model, the fourth step, it is essential to define the estimation window, where the parameters are estimated. Generally, the estimation window precedes the event window, to prevent the
12
event’s influence in the estimation of the normal performance model. Therefore, it is possible to calculate the abnormal returns (ARs) and the cumulative abnormal returns (CARs).
The fifth stage serves to test the sample for the abnormal and cumulative abnormal returns, being of high relevance, define the null hypothesis and the techniques for aggregating the individual company abnormal returns. There are several tests - parametric and non-parametric tests - to infer the statistical significance of ARs and their quality depends on the characteristics of the inherent data. Potential problems can emerge when testing the hypothesis. They should be taken into account because ARs is, frequently, not independent and/or they do not have identical variance. Binder (1998) summarizes this subject as follows: abnormal return estimators often have a cross-sectional correlation in the event horizon, heterogeneity variance across companies, correlation across time for an individual company, or even higher variance during the event-period than comparing to the surrounding periods. Although it is essential to be aware of such characteristics, it is often possible to merely ignore them as, in practice, they are minor.
In the sixth phase, results are introduced, finishing this analysis with the seventh phase, the interpretation and the conclusion of the results.
Proceeding this general flow, the conclusions from the event study are valid if readers are confident that the researcher has genuinely identified the abnormal returns associated with the event.
4.2. Constructing Abnormal Returns and Parametric
Tests
To test the market reaction to the scandal, it is essential to compute the Cumulative Abnormal Returns (CARs). In order to do that, some steps must be followed.
The first step is to compute the Abnormal Returns (ARs), using formula 1:
𝐴𝑅𝑖𝑡 = 𝑅𝑖𝑡− 𝐸(𝑅𝑖𝑡|𝑋𝑡) (1)
Where
𝐴𝑅𝑖𝑡= Abnormal Returns 𝑅𝑖𝑡= Actual Return
13
To estimate the normal performance, two statistical models were computed: The Constant Mean Return Model and the Market Model.
Constant Mean Return Model (CMRM) is probably the simplest model, therefore, in some cases can even be more successful than sophisticated models. The expected return 𝐸[𝑅𝑖𝑡] is assumed to be constant, and it is computed by the mean of 𝑅𝑖𝑡 from the estimation window with 𝑇 days:
𝐸[𝑅𝑖𝑡] =1
𝑇∑ 𝑅𝑖𝑡 𝑇
𝑡=1
(2)
The abnormal return of company 𝑖 on day 𝑡 (𝐴𝑅𝑖𝑡) can be calculated the following way:
𝐴𝑅𝑖𝑡 = 𝑅𝑖𝑡 − 𝐸[𝑅𝑖𝑡] (3)
Alternatively, the Market Model (MM) uses the market portfolio to predict the returns of a security i. In this case, the normal performance is defined as:
𝑅𝑖𝑡 = 𝛼𝑖 + 𝛽𝑖𝑅𝑚𝑡+ 𝜀𝑖𝑡 (4) Where 𝑅𝑖𝑡= Return of a security i 𝑅𝑚𝑡= Actual Return 𝛼𝑖= intercept term 𝛽𝑖= systematic risk 𝜀𝑖𝑡= zero mean error term
With this model, the Abnormal Return of company 𝑖 on day 𝑡 (𝐴𝑅𝑖𝑡) can be calculated the following way:
𝐴𝑅𝑖𝑡 = 𝑅𝑖− (𝛼𝑖 + 𝛽𝑖𝑅𝑚𝑡) (5)
This methodology represents a potential improvement over the CMRM by eliminating a portion of the returns that are related to market variations. Thus, the variance of the abnormal return is reduced, and more accurate are the results. The advantage of using the Market Model will
14
depend on the R2 of the regression: the higher the R2, the greater is the reduction of the variance of the abnormal returns, and the higher is the gain of using this model. In this dissertation, both models are applied since CMRM is useful to compare results from the MM.
In order to test the null hypothesis of no abnormal returns, 𝐴𝑅𝑖𝑡 is divided by the standard deviation of the Abnormal Returns of company i from the estimation window:
𝑡𝐴𝑅𝑖 = 𝐴𝑅𝑖𝑡 𝑆𝐷𝐴𝑅𝑖
(6) Where Standard Deviation is:
𝑆𝐷𝐴𝑅𝑖𝑡 = [ 1 𝑇 − 2∑(𝐴𝑅𝑖𝑡) 2 𝑇 𝑡=1 ] 0.5 (7)
The significance level is form on 𝑇 − 2 degrees of freedom.
To achieve all inferences of the event, the abnormal returns have to be aggregated. This aggregation is based in two dimensions – through time and across companies. Firstly, as MacKinlay (1997) said, it is necessary to compute the aggregation through time – the cumulative abnormal return. This concept aggregates all measured effects of the event on the stock price of company 𝑖′ 𝑠, and it is calculated as:
𝐶𝐴𝑅𝑖 = ∑ 𝐴𝑅𝑖𝑡 𝐾
𝑇=1
(8)
The significance of the 𝐶𝐴𝑅𝑖 can be tested as:
𝑡𝐶𝐴𝑅𝑖 =
𝐶𝐴𝑅𝑖 𝑆𝐷𝐶𝐴𝑅𝑖
(9) Where Standard Deviation of CAR is:
𝑆𝐷𝐶𝐴𝑅𝑖 = (𝑘 × 𝑆𝐷𝐴𝑅2 𝑖)0.5 (10)
Where
15
Additionally, to compute the aggregation across securities, another concept was introduced – the Standardized Abnormal Return (SAR). This process gives to each abnormal return the same variation, by dividing the abnormal return by its standard deviation:
𝑆𝐴𝑅𝑖𝑡 =𝐴𝑅𝑖𝑡 𝑆𝐷𝑖𝑡 (11) With 𝑆𝐷𝑖𝑡 being: 𝑆𝐷𝑖𝑡 = {𝑆𝐷𝐴𝑅2 𝑖× [1 +1 𝑇+ (𝑅𝑚𝑡− 𝑅̅̅̅̅)𝑚 2 ∑𝑇𝑡=1(𝑅𝑚𝑡− 𝑅̅̅̅̅)𝑚 2 ]} 0.5 (12) Where 𝑆𝐷𝐴𝑅2 𝑖= Residual variance 𝑅𝑚𝑡= Market return on day 𝑡
𝑅̅̅̅̅ = Average return on the market portfolio 𝑚
The standardized abnormal returns can be cumulated over the time period of the event window and can be calculated as:
𝐶𝑆𝐴𝑅𝑖 = ( 1
𝑘0.5) ∑ 𝑆𝐴𝑅𝑖𝑡 𝑘
𝑡=1
(13)
Assuming that the values of 𝐶𝐴𝑅𝑖 are independent and identically distributed when 𝐶𝐴𝑅𝑖 is divided by its standard deviation, its values are identically distributed. The average effect of the event on all companies in the sample on day t is given by the average standardized cumulative abnormal returns (ACSAR), and it is calculated as:
𝐴𝐶𝑆𝐴𝑅𝑡 = 1 𝑛× 1 𝑆𝐷𝐶𝑆𝐴𝑅 ∑ 𝐶𝑆𝐴𝑅𝑖𝑡 𝑛 𝑖=1 (14) Where 𝑆𝐷𝐶𝑆𝐴𝑅 is: 𝑆𝐷𝐶𝑆𝐴𝑅 = [ (𝑇 − 2) (𝑇 − 4)] 0.5 (15)
16
To test the hypothesis of 𝐴𝐶𝑆𝐴𝑅𝑡 being significantly different from zero can be computed as:
𝑍𝐴𝐶𝑆𝐴𝑅 = 𝐴𝐶𝑆𝐴𝑅𝑡× 𝑛0.5 (16)
If 𝐴𝐶𝑆𝐴𝑅𝑡 is statistically significant, it is possible to infer that the event had an impact on the stock price of the n firms.
The aggregation of abnormal returns assumes that there are no overlaps between the windows of security events, which allows to aggregate the AR without having problems related to a zero covariance. In this dissertation, this problem does not apply since the event window of all securities are different.
4.3. Non-parametric tests
Parametric tests are perceived to be less accurate at testing the null hypothesis of no abnormal returns since it depends on the assumption of normality. Non-parametric tests are an alternative approach as they do not require such demanding restrictions about return distributions and potentially, produce more powerful results. Those tests are typically used in-line with parametric tests to authenticate the results as not driven by outliers. Therefore, they provide robustness checks for parametric ones. This situation is especially significant for small samples due to the impact a single firm's returns can have on the sample statistic. Based on Rani, Yadav, and Jain (2016), I used the generalized sing test and rank test.
The generalized sign test presented by Cowan (1992) is a developed version of the sign test. The sign test is a binomial test that assesses if the frequency of positive abnormal returns equals 50%. The generalized sign test, instead of assuming a fraction of 0.5, adjusts the fraction to positive abnormal returns in the estimation period. Hence, it investigates if the number of stocks with positive cumulative abnormal returns in the event window surpasses the number expected in the absence of abnormal returns, that is, a period unaffected by the event. The advantage of this test is the not required symmetry of the cross-sectional abnormal return distribution and the more reliability as the length of the event window increases.
The expected number is based on the fraction of positive abnormal returns in the estimation period:
17 𝑝̂ =1 𝑛∑ 1 𝑇 𝑛 𝑗=1 ∑ 𝑆𝑗𝑡 𝑇 𝑡=1 (17) And 𝑆𝑗𝑡 = {1 𝑖𝑓 𝐴𝑅𝑗𝑡 > 0 0 𝑜𝑡ℎ𝑒𝑟𝑤𝑖𝑠𝑒 (18) Where T is the estimation window
The generalized sign test uses the normal approximation to the binomial distribution with parameter 𝑝̂. It is calculated as:
𝑍𝐺 = 𝑤 − 𝑛𝑝̂ ⌊𝑛𝑝 ̂ (1 − 𝑝̂)⌋12
(19)
Where
𝑤= number of stocks in the event window for which the cumulative abnormal return is positive
Under the null hypothesis, there is no difference between the proportion of positive returns in the event window and its proportion of positive returns in the estimation window.
The rank test developed by Corrado (1989), based on a residuals’ ranking, exams the existence of abnormal returns. This test considers the combined estimation and the event window as a single set of returns. Then, assigns a rank to each firm. Rank one is attributed to the smallest residual.
The issue relies on the construction: the ranks of the residuals of different days are dependent. However, Campbell and Weasley (1993) argue that for a short event window, the effect of ignoring the dependence should be insignificant. The test statistics is specified as:
𝑍𝑅𝑎𝑛𝑘 = [( 1 𝑁∑𝑁𝑖=1𝑘𝑖0) − 𝑘̃] 𝑆𝑘 (20) With 𝑘̃ = 𝐿+1 2 𝑆𝑘 = √ 1 𝐿∑ ( 1 𝑁∑ (𝐾𝑖𝑡− 𝑘̃) 𝑁 𝑖=1 ) 2 𝑇2 𝜏=𝑇1+1 (21) Where
18
𝑘̃= Expected rank of the company i 𝑁= Number of companies
𝐿= Total number of observations in the estimation and event window 𝑆𝑘= standard deviation
𝐾𝑖𝑡= Rank of the abnormal return of company i at time t
𝜏 = 𝑇1+ 1 to 𝜏 = 𝑇2 = Beginning and the end of the event window
4.4. Regressions
Additionally, the impact of specific criterions in the results of CARs of the companies was analysed. This step will help this dissertation to understand which corporate scandals' characteristics will the market penalize harder. The regression analysis allows us to establish these conclusions.
The impact on the company’ results of the type of industry, type of scandal, type of position of the executive and whether the executive is a former or a current employee was assessed.
First of all, to analyse the impact of the industry in the CARs, this dissertation includes the CAR as a dependent variable and industries dummies as independent variables. As previously mentioned, there are 6 different industries; therefore, 5 dummies were created in the regression, as followed:
𝐶𝐴𝑅𝑖 = 𝛼 + 𝛽1𝐹𝑖𝑛𝑖 + 𝛽2𝑇𝑒𝑐𝑖 + 𝛽3𝐼𝑛𝑑𝑖+ 𝛽4𝐶𝑜𝑛𝑁𝐶𝑖 + 𝛽5𝐻𝑒𝑎𝑖+ 𝜀𝑖 (22) Where:
𝛼 = constant 𝜀𝑖 = error term
𝐹𝑖𝑛𝑖, 𝑇𝑒𝑐𝑖, 𝐼𝑛𝑑𝑖, 𝐶𝑜𝑛𝑁𝐶𝑖 and 𝐻𝑒𝑎𝑖 indicate the following industries: Financials, Technologies, Industrials, Consumer Non-Cyclicals, and Healthcare.
The intuition behind is: if 𝛽1 = 1, the enterprise is in the financial industry and 𝛽1 =0 if it is not; If 𝛽2 = 1, the company is in the technology industry and 𝛽2 = 0 if it is not; if 𝛽3 = 1 the corporation is in the industrial industry and 𝛽3 = 0 if it is not; if 𝛽4 = 1 the firm is in the consumer non-cyclical industry and 𝛽4 = 0 if it is not; and for last; if 𝛽5 = 1 the company is in the healthcare industry and 𝛽5 = 0 if it is not. As well, 𝛼 absorbs the impact of the industry Consumer Cyclicals.
19
The second regression intends to seek the impact which the type of scandals have on CARs:
𝐶𝐴𝑅𝑖 = 𝛼 + 𝛽1𝐹𝑖𝑛𝑇𝑦𝑝𝑒𝑖 + 𝜀𝑖 (23)
Where 𝛼 = constant 𝜀𝑖 = error term
𝐹𝑖𝑛𝑇𝑦𝑝𝑒𝑖 indicates financial corporate scandals.
The rationality behind this equation is: if 𝛽1 = 1, the scandal is financial and if 𝛽1 = 0, otherwise. Additionally, 𝛼 absorbs the impact of personal scandals.
The same logic was applied for the type of position of the executive:
𝐶𝐴𝑅𝑖 = 𝛼 + 𝛽1𝐿𝑜𝑤𝑃𝑜𝑠𝑖+ 𝜀𝑖 (24)
Where 𝛼 = constant 𝜀𝑖 = error term
𝐿𝑜𝑤𝑃𝑜𝑠𝑖 indicates executives with a lower position
The subjacent logic is: if 𝛽1 = 1, scandal is committed by an executive with lower position, and if 𝛽1 = 0, otherwise. In addition, 𝛼 absorbs the impact of the scandals committed by executives with a higher position.
The last regression interprets the influence of an executive being a former/current employee on the company:
𝐶𝐴𝑅𝑖 = 𝛼 + 𝛽1𝐹𝑜𝑟𝑚𝑖 + 𝜀𝑖 (25)
Where 𝛼 = constant 𝜀𝑖 = error term
20
The insight underlying it is: if 𝛽1 = 1, a scandal is committed by a former employee and if 𝛽1 = 0, otherwise. Moreover, 𝛼 absorbs the impact of the scandals committed by current executives.
4.5. Estimation and Event Window
In previous sections, it was defined that the estimation window is used for the expected returns’ calculation. According to Mackinlay (1997), the estimation window with 250 prior days from the corporate scandal was used. It is a commonly used the period prior to the event window for the estimation window and does not include any overlap between these two to prevent the event from having any influence in the estimated returns. The characterization of the event window is rather complex, as McWilliams and Siegel (1997) described. The length of the event window must be select in order to capture the abnormal returns of the event without including any confounding effects. The day before the event should be analysed since information may be leak out before the announcement and, because it is likely that investors do not react immediately to the announcements, the event window may also include the day after the event. In addition, the event window can be extended to understand whether the event created prolong significant negative abnormal returns allowing to see how long it took to recover from the scandal. Consequently, to understand the impact of the announcement of inappropriate behaviour in the market price of the companies, this study analyses three different event windows.
The first window of the event goes from the day before to the third day after the scandals disclose – (-1,3). The reason for this length is to capture cases where the information was leaked before the announcement and to access if there is a prolonged effect of the scandal.
The other event window ranges from the day of the announcement to three days after the event – (0,3). In this case, this dissertation does not include any day before the announcement day as companies avoid to leak information about such scandals publicly. For instance, in terms of financial scandals, the announcements are made by government agencies, and they are expected to be more reliable and therefore harder to have information leakage. Regarding inappropriate personal scandals, companies often try to hide these cases and, when it is not possible, they minimize them by changing the type of inappropriate behaviour that the executive has committed.
The last window of the event goes from the day before the event to the day after – (-1,1), to understand the short-term impact of the scandal.
21
The advantage of having these three event windows besides the comparison between them is the validation of the assumptions described at the beginning of this methodology.
4.6. Hypothesis
Based on previous literature, corporate scandals committed by executives are expected to hold a significant negative impact on the market value of their companies.
Accessing the type of corporate scandals, as literature review mentioned, it is expected that financial misconduct scandals still hold a more negative influence than personal misconduct scandals since the latter are commonly associated with fines and penalties for the companies, turning into more losses to the company and therefore for the investors. Nevertheless, it is expected to discover some significant results in personal misconduct, since this type of scandal is more visible now than before. This is again in-line with the changing awareness created from movements like #Metoo.
Moreover, it is expected that corporate scandals committed by top position executives produce a more negative effect on returns than the scandals committed by lower position executives, not only because they are a bigger target of media reactions, but mainly due to the fact that top executives like CEOs, CFOs, Founders, Presidents, among others, representing how the company is managed and which values emerge from such direction. Therefore, illegal actions from such higher-position organizational hierarchy make investors doubt management skills and lack of trust in the specific company.
Furthermore, scandals exercised by current executives are expected to influence more the company’s value than the scandals committed by former executives. The reason behind this expectation is that current employees show the actual values the company is driven by. In the case of former executives’ scandals, a lot of times, companies already know the existence of the scandal before going to the public. Therefore, they had time to implement strategies to change these values and, consequently prevent the existence of corporate scandals.
Those conclusions are expected to be achieved in all results from this dissertation.
4.7. Confounding Events
It is crucial to ensure that the results are only caused by the event and not influenced by another confounding event. A reduced length of the event window reduces that likelihood. The fact that
22
almost all companies in this database belong to the largest US companies means that they are mostly international, which makes them more likely to be affected by confounding effects. To deal with this situation, Foster (1980) suggests eliminating the abnormal returns of the day of the confounding event.
23
5. Results
As mentioned before, 40 corporate scandals were analysed. Through the three-event windows, many scandals have individual negative significant abnormal and cumulative abnormal returns. However, to take more inferences, is essential to understand the effect of the scandals not only in an individual way but also in a group way. Moreover, it is also vital to conclude which features would imply a more significant impact on companies after the scandal’s announcement. Consequently, a regression analysis will be present.
Therefore, in this section, it will be presented the individual ARs and the CARs, a study of the corporate scandals grouped, and the regression analysis. The analysed groups are all corporate scandals together, the different types of corporate scandal, the different industries, the different executives’ positions, and for last, the different situations in the company - current or former executives.
5.1. Individual Corporate Scandals
Taking into account the large size of the database, the individual analysis of each corporate scandal would be time-consuming, and it would not bring any practical advantage. Nevertheless, all the ARs, CARs, and the respective T-starts are presented in Appendix D. As previously mentioned, throughout the three-event windows, there are several negative ARs and CARs.
Figure 1 presents the CARs for both models – CMRM and MM - in three graphs, correspondent to each event window. To effortlessly visualize the results, as some values are small and challenging to understand in the graphs, table 3 illustrates a summary statistic about the CARs.
Table 3: This table shows CARs’ summary statistics for both models – CMRM and MM - for the three-event windows: (-1,3), (0,3), and (-1,1). The summary statistics are how many negative CARs are in the 40 corporate scandals, how many negative and significant CAR there are in the sample, and the same for positive and significant CARs. CMRM MM CMRM MM CMRM MM (-1,3) 13 26 2 6 1 0 (0,3) 10 24 3 6 4 1 (-1,1) 14 22 4 5 1 0 Negative CARs Negative Significant CARs Positive Significant CARs
24 Figure 1: This figure shows the CARs’ graphs for both models – CMRM and MM- for the three-event windows: (-1,3), (0,3), and (-1,1). The lighter colours represent the companies which their CAR is significant at least at 10% of significance. SS stands from statistical significance.
-22.00% -17.00% -12.00% -7.00% -2.00% 3.00% 8.00% C B S - M o o nv es C B S - R o se B an k o f Am er ic a Te sl a - Jur ve tso n A m az o n JD Wal t D isn e y L as se st er W al t D isn e y He el y W al t D isn e y L ee A lph ab et R ub in W yn n M o rg an S tan le y Fo rd Jr . M o rg an S tan le y G re e nb er g M ic ro so ft Sr iv as tav a Fo rd M o ns te r N ik e Ta pe st ry In te l N at io na l B e ve rag e Te sl a - M us k A pp le L ev o ff G o ldm an J un g G o ldm an N g G o ldm an Ve lla Qu al co m m W al gr ee n s M ic ro n C o gni zan t M ic ro so ft J o rg e ns o n L3 Cit iz ens Equ if ax - Y ing Equ if ax - B o nt hu Ti ff an y R ay m o n d Fr an kl in Fi ft h Uni te d R et ro ph in
CARs (-1,3)
CMRM MM -22.00% -17.00% -12.00% -7.00% -2.00% 3.00% 8.00%CARs (0,3)
-22.00% -17.00% -12.00% -7.00% -2.00% 3.00% 8.00%CARs (-1,1)
25
By looking to the graphs and this table, it is possible to conclude that MM proves to show more negative CARs for the three-event windows than CMRM. Similarly, in significance terms, MM displays more cases of negative and significant CARs and less episodes of positive and significant CARs than CMRM, for every event window. Those results are elucidated by the fact that CMRM includes a portion of the returns that is related to variation in the market's return. In this case, produces more positive CARs than negatives, showing that, in general, the market is growing. It is essential to highlight that in MM more than half of the sample has negative CAR, as opposed to the CMRM where approximately a quarter of the sample show negative CARs. The reason for this is exclusively related to the market presence in CMRM since all scandals happened on distinct dates. Therefore, there is no confounding event that affects all of the scandals simultaneously.
5.2. All Corporate Scandals
To analyse the overall impact of scandals, ACSARs were calculated. Depending on the chosen event window, there are different significance levels attached to them, as Table 4 illustrates.
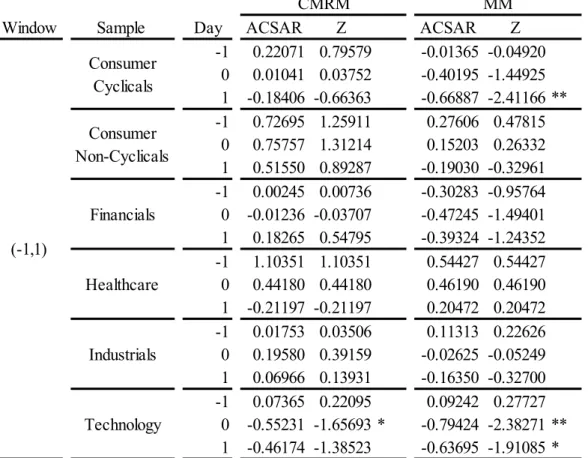
Table 4: This table shows the average cumulative standardized abnormal returns of all companies that an executive commits a corporate scandal grouped for CMRM and MM, for the three-event windows: (-1,3), (0,3), and (-1,1). The z test determines whether the null hypothesis of no ACSAR is equal to zero is rejected or not.
*Rejects the null hypothesis at the 10% significance level ** Rejects the null hypothesis at the 5% significance level *** Rejects the null hypothesis at the 1% significance level
Starting with the event window (-1,3), it is conceivable to understand that in MM, all of ACSAR are negative and they are all significant at least at 5% level after the scandal is announced. In respect to CRMR, there are negative ACSAR on the day of the announcement and in the day
Window Day ACSAR Z ACSAR Z
-1 0.17278 1.09274 -0.01372 -0.08680 0 -0.03653 -0.23107 -0.40712 -2.57487 ** 1 -0.07772 -0.49154 -0.48451 -3.06432 *** 2 0.14519 0.91824 -0.34888 -2.20653 ** 3 0.26319 1.66458 * -0.32955 -2.08424 ** 0 -0.56902 -3.59883 *** -0.23104 -1.46121 1 -0.59174 -3.74251 *** -0.31800 -2.01121 ** 2 -0.39924 -2.52505 ** 0.11062 0.69960 3 -0.36608 -2.31530 ** 0.40700 2.57407 ** -1 0.17278 1.09274 -0.01372 -0.08680 0 -0.03653 -0.23107 -0.40712 -2.57487 *** 1 -0.07772 -0.49154 -0.48451 -3.06432 *** (-1,3) (0,3) (-1,1) MM CMRM
26
after, but with no significance. On the other hand, on the third day after the announcement, the ACSAR is significantly but positive.
In the event window (0,3), the CMRM holds since the day of the scandal, negative and significant ACSAR. Especially the day and the day after the announcement with the most significantly negative results. Regarding MM, the first two days of the event have negative ACSAR, but only the day after the scandals disclose confirms a significant result at 5% level, probably showing delay in investors’ reaction. The second and third days of the event has positive ACSAR. The third day after the announcement is significant at 5% level, showing recovery from the hit.
In the last event window, (-1,1), the CMRM yield negative ACSAR for the day of the announcement and the day after. However, both results are not significant. In the MM, both the day and the day after the announcement are negative and significant ACSARs at 1% level.
To sum up, CMRM only shows evidence of negative impact from the corporate scandal in the event window (0,3), whereas MM shows a negative impact in all event windows. Because CMRM has a portion of the market’s returns makes results of MM more reliable of the isolated impact of the executives misconducts. Therefore, it is possible to argue that corporate scandals committed by executives affect the company’s market stock price.
To check the robustness from previous parametric results, this section analyses the results of the non-parametric tests and establish a relation to the parametric tests. The results are present in table 5.
Table 5: This table shows the results for non-parametric tests - Generalized Sign Test and Rank Test – for all companies grouped for CMRM and MM, for the three event windows: (-1,3), (0,3), and (-1,1).
When applying CMRM, the event window (-1,3) and (-1,1) do not provide any statistical evidence. However, in the event window (0,3), the generalized sign test shows that the proportion of positive returns in the event window is statistically different from its proportion of positive returns in the estimation window at 10% confidence level for all companies.
27
Regarding MM, there are no signs of differences between the event window nor the estimation window.
The rank test does not reveal any statistical evidence in neither of the models across all event windows. As a consequence, the null hypothesis of absent abnormal returns cannot be rejected. The results obtained for both models as well as for the three-event windows present inconsistency across the parametric and the non-parametric tests. In CMRM, parametric tests express to be statistical significance in the event window (0,3) and in MM, parametric tests confirm statistically negative results in all event windows. Though, generalized sign test only shows significance in CMRM and when the event window is (0,3). The rank test is not significant in any model.
These differences can be explained by the fact that the generalized sign test does not take into account the magnitude of the values. Corrado (1989) describes the rank test for a one-day event window and, in this dissertation, a three, four, and five days of event window are applied. Additionally, Cowan (1992) states that as the size of the event window increases, the rank test’s power decreases faster than the sign test. Moreover, those results do not come up as a surprise since each corporate scandal is unique. The way each company deals with the executives’ illegalities, the magnitude of the government’s penalties (in the cases of financial misconduct), and the different media coverage suffered by each company will influence the investors’ reaction differently.
Succinctly, even that the parametric and non-parametric do not show consistent results because of theoretical flaws or even because of the specifications of the event, the overall conclusion is that executives’ misconduct affect the stock price of the companies.
5.3. Group of Corporate Scandals divided by their Type
As previously mentioned, there are two types of corporate scandals: personal misconduct and financial misconduct. This section interprets the results by grouping the scandals in these two categories as table 6 presents.
Observing the event window (-1,3) concerning CMRM, only personal misconduct has negative ACSAR one day after the scandal announcement, although not significant. Conversely, the group of financial misconduct does not show negative results on any day of the event window.
28
Regarding MM, all event windows, either personal or financial misconduct, have negative ACSARs. For the personal misconduct, only the day after the announcement is significant. For financial misconduct, every day is significatively influencing the market price of the companies with the exception of the second day after the announcement.
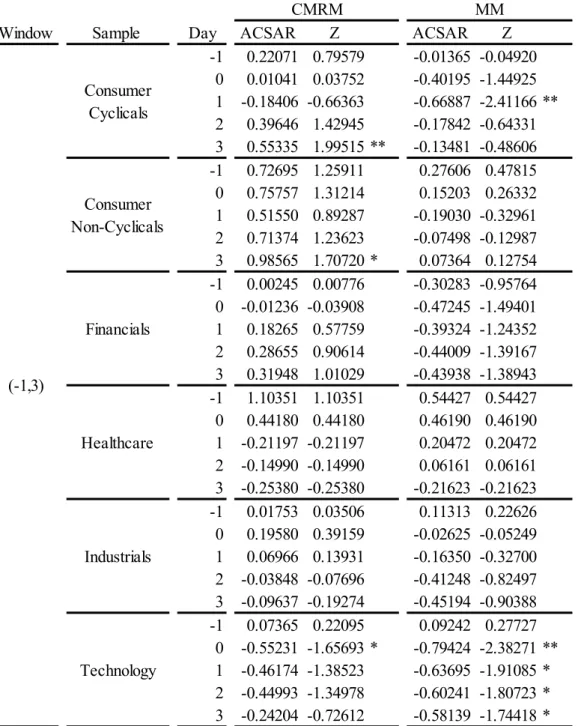
Table 6: This table shows the average cumulative standardized abnormal returns of personal misconduct scandals and financial misconduct scandals for CMRM and MM, for the three-event windows: (-1,3), (0,3), and (-1,1). The z test determines whether the null hypothesis of no ACSAR is equal to zero is rejected or not.
For the event window (0,3), CMRM establishes a significant negative impact on both types of scandal. With MM, personal misconduct shows negative impact on the day of the announcement, and the day after, but providing no significant level. Moreover, the last day of the event window shows significant positive values, presenting signs of recovery from the hit. In regards to financial misconduct, the day of the announcement, and the day after, affect significantly negative the stock price of the companies at 10% level of confidence. The other two days are not significant.
Window Sample Day ACSAR Z ACSAR Z
-1 0.16444 0.73540 -0.01807 -0.08082 0 0.10474 0.46843 -0.33945 -1.51809 1 -0.03305 -0.14782 -0.53108 -2.37508 ** 2 0.17181 0.76835 -0.36544 -1.63429 3 0.40752 1.82248 * -0.26006 -1.16301 -1 0.18112 0.80998 -0.00937 -0.04192 0 -0.17781 -0.79521 -0.47479 -2.12334 ** 1 -0.12239 -0.54732 -0.43794 -1.95852 * 2 0.11857 0.53024 -0.33233 -1.48621 3 0.11887 0.53159 -0.39904 -1.78455 * 0 -0.47588 -2.12820 ** -0.02927 -0.13091 1 -0.65419 -2.92562 ** -0.24358 -1.08933 2 -0.42012 -1.87885 * 0.16493 0.73757 3 -0.29097 -1.30126 0.72827 3.25693 *** 0 -0.66217 -2.96131 *** -0.43280 -1.93555 * 1 -0.52930 -2.36709 ** -0.39242 -1.75494 * 2 -0.37837 -1.69211 * 0.05631 0.25182 3 -0.44119 -1.97307 ** 0.08572 0.38335 -1 0.16444 0.73540 -0.01807 -0.08082 0 0.10474 0.46843 -0.33945 -1.51809 1 -0.03305 -0.14782 -0.53108 -2.37508 ** -1 0.18112 0.80998 -0.00937 -0.04192 0 -0.17781 -0.79521 -0.47479 -2.12334 ** 1 -0.12239 -0.54732 -0.43794 -1.95852 * (-1,1) (0,3) Personal Misconduct (-1,3) Personal Misconduct Financial Misconduct CMRM MM Personal Misconduct Financial Misconduct Financial Misconduct
29
Related to the event window (-1,1), CMRM presents similar results for both misconducts, although their significance is null.
All in all, the event window (0,3) is the only case of CMRM that shows a negative influence from both types of scandals on the companies’ stock price. In the case of using MM, financial scandals always produce a negative impact on the stock price of the companies regardless of the choice of the event window. When applying the same model, personal scandals present the same conclusion than financial scandals for the event windows (-1,3) and (-1,1). Having this said, it is possible to see and conclude, that in all cases, financial misconduct has a more lengthy and robust effect on the company’s value than in personal misconduct.
This section studies the robustness of the parametric results, analysing the results of the non-parametric tests Generalized Sign Test and Rank Test. All results are presented in table 7.
Table 7: This table shows the results for non-parametric tests - Generalized Sign Test and Rank Test – for personal misconduct and financial misconduct scandals for CMRM and MM, for the three-event windows: (-1,3), (0,3), and (-1,1).
According to the table, by using CMRM, the generalized sign test is significant at least 10% in the event window from (-1,3) and (0,3) for personal misconduct. On the other hand, using the MM, the generalized sign test shows significant at 1% level for financial misconduct in the event window (-1,3).
For those three cases, the number of stocks with positive cumulative abnormal returns in the event window exceeds the number expected in the estimation window.
The rank test shows statistical evidence for both models in all event windows for financial misconduct. In the event windows 1,3) and (0,3) this significance is at 10% level and for (-1,1) this level of confidence is around 5%. Therefore, the null hypothesis of absent abnormal returns can be rejected for financial misconduct.
Window Misconduct CMRM MM CMRM MM Personal 1.68020 * 0.47943 0.04403 0.74296 Financial -0.27366 -2.81068 *** 1.72412 * 1.75692 * Personal 2.14027 ** 0.03220 0.01062 0.77780 Financial 0.63250 -1.46543 1.86068 * 1.90288 * Personal 1.22012 0.92665 -0.03743 0.80734 Financial -0.27366 -1.46543 2.10280 ** 2.25801 ** (-1,3) (0,3) (-1,1)